Preface: Explaining our market timing models
We maintain several market timing models, each with differing time horizons. The “Ultimate Market Timing Model” is a long-term market timing model based on the research outlined in our post, Building the ultimate market timing model. This model tends to generate only a handful of signals each decade.
The Trend Model is an asset allocation model which applies trend following principles based on the inputs of global stock and commodity price. This model has a shorter time horizon and tends to turn over about 4-6 times a year. In essence, it seeks to answer the question, “Is the trend in the global economy expansion (bullish) or contraction (bearish)?”
My inner trader uses a trading model, which is a blend of price momentum (is the Trend Model becoming more bullish, or bearish?) and overbought/oversold extremes (don’t buy if the trend is overbought, and vice versa). Subscribers receive real-time alerts of model changes, and a hypothetical trading record of the those email alerts are updated weekly here. The hypothetical trading record of the trading model of the real-time alerts that began in March 2016 is shown below.

The latest signals of each model are as follows:
- Ultimate market timing model: Sell equities
- Trend Model signal: Neutral
- Trading model: Bullish
Update schedule: I generally update model readings on my site on weekends and tweet mid-week observations at @humblestudent. Subscribers receive real-time alerts of trading model changes, and a hypothetical trading record of the those email alerts is shown here.
A bright tomorrow
Mark Hulbert recently wrote a column which determined that the US equity market is overvalued based on five of six valuation metrics. He concluded “if you were concerned last fall about stock market overvaluation, you should be almost as concerned now”.

I beg to differ. I will show most of these valuation metrics are either not useful, distorted, or a product of the low interest environment that the market is operating under. I go on to sketch out a likely bright long and medium future for US equities, which argues for an America First approach to equity investing.
An overvalued market?
Hulbert’s six valuation metrics can be categorized as:
- Price to asset value: Price/book, Q-Ratio (price to replacement cost)
- Cash flow: Price to sales, CAPE, P/E ratio
- Yield: Dividend yield
Many of these have their own special problems. The price to asset ratio is becoming less and less relevant for equity valuation in an environment where the competitive advantage of companies depend heavily on the value of their intellectual property. Jim O’Shaughnessy of OSAM pointed out that the price to book factor has become virtually useless as a stock picking technique. In that case, why should it be relevant for equity valuation? The same goes for the Q-Ratio, which measures price to replacement asset.

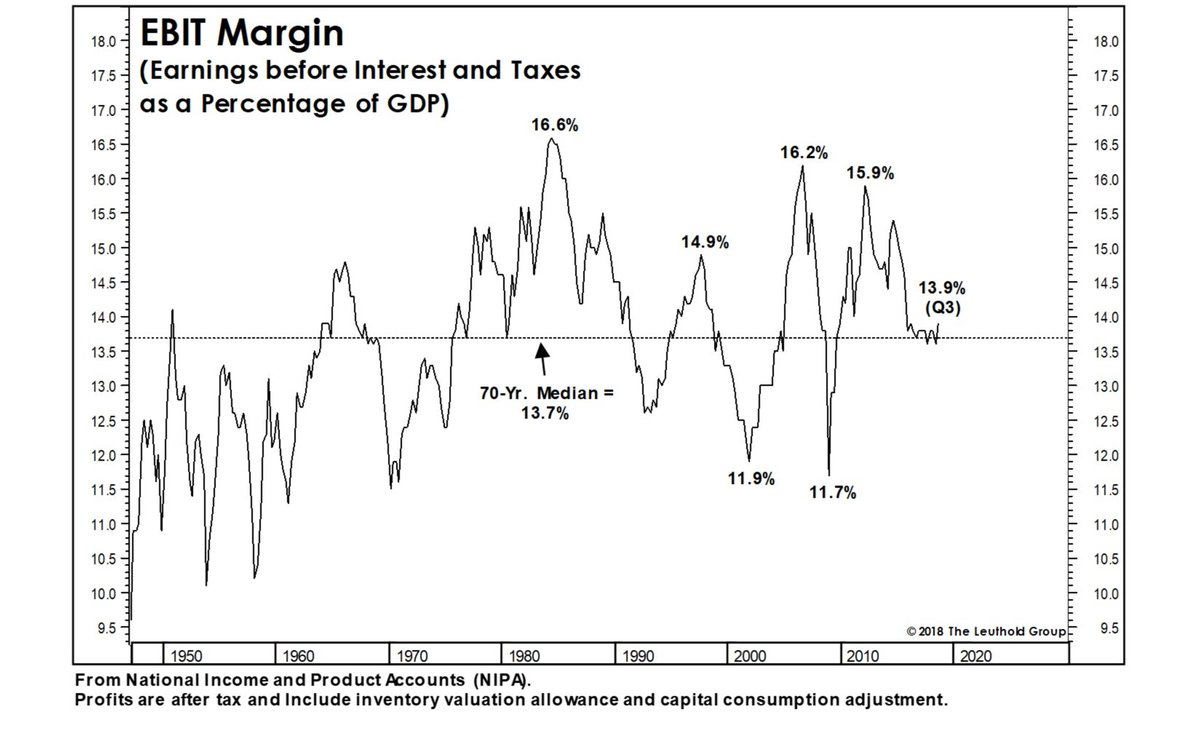
Let me next address the cash flow ratios. The price to sales factor has become distorted as a valuation metric. Recall that P/E = Price to Sales x Net Margin. Analysis from the Leuthold Group indicates that net margins have surged since about 2000. It is therefore no surprise that price to sales have also risen in sympathy.

Does that mean that net margins are due to mean revert? Not necessarily. The Leuthold Group also showed that EBIT margins, which is a proxy for operating margin, has remained fairly steady over the same time period. The rise in net margin was the result of two factors, corporate tax cuts that began with in the Bush II era, and falling interest rates which reduced interest expense.
The next cash flow valuation metric to consider is CAPE, or the Cyclically Adjusted P/E ratio. Bob Shiller has stated that CAPE should not be used as a market timing indicator, either short or long term. Consider this chart of CAPE, which has been above its 10-year average for most of the time since the start of the Tech Bubble. Does that mean you should have been out of stocks all this time? Even if you had sold out at the top of Tech Bubble, when would you have bought back in? Stock prices have more than doubled since that peak.

Hulbert did allow that the market appears reasonably priced based on the P/E ratio. Indeed, the market is trading at 15x forward earnings, which is roughly the 10-year historical average, indicating an undemanding P/E valuation.

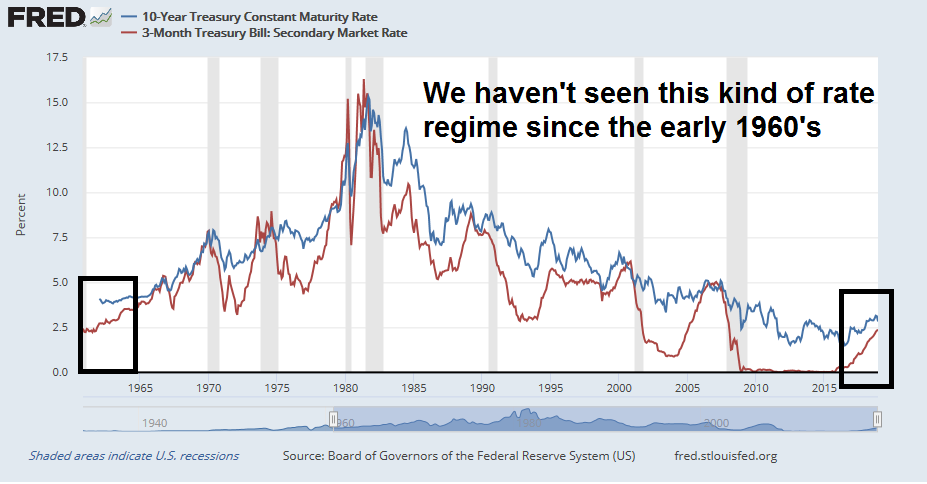
Lastly, Hulbert pointed out that the dividend yield is high compared to its own history. But what should you compare the dividend yield to? The chart below shows the yield on 3-month and 10-year Treasury paper. You need to go all the way back to the early 1960’s to find a similar interest rate environment. If stocks are expensive based on dividend yield, so is the fixed income market. In that case, what is the alternative?
A demographic dividend ahead
Looking forward for the next 10 years, I would argue that the US is about to reap a demographic dividend. By 2021, the Millennials will be the biggest age cohort of the American population. Moreover, they are moving into their prime earnings and child bearing years.
While history doesn’t repeat but rhymes, we can see a similar age demographic profile for the Baby Boomers in 1991. To be sure, the Baby Boomer population bulge was more pronounced that the Millenials are today, but remember what happened to stock prices during the 1990’s.
In 2011, researchers at the San Francisco Fed presented some results that related age demographics to market P/E ratios. They found that there was a strong correlation between the middle aged to old cohort ratio to market P/Es, based on the savings behavior of different age cohorts. Their forecast was for market P/Es to bottom out at about 2020-2021.

A follow-up study published in 2018 found that the P/E ratio did not behave as expected. However, that could be attributable to the unusual monetary policy regime which encouraged risk-taking during that era.

Nevertheless, expect rising demand for equities as Millenials become middle-aged and enter their prime earnings and savings years.

The 2020s may turn out to be a golden age for US equity returns, which should be an advantage for the US economy compared to others. Europe, by contrast, has an aging population and it does not have a Millennial “echo boom” in the American manner.
China is undergoing the height of its demographic boom now, but its population is aging rapidly, and the availability of cheap workers will grow scarcer as time goes on.

In short, demographic patterns argue for an America First strategy for long-term equity investing.
America First, medium term
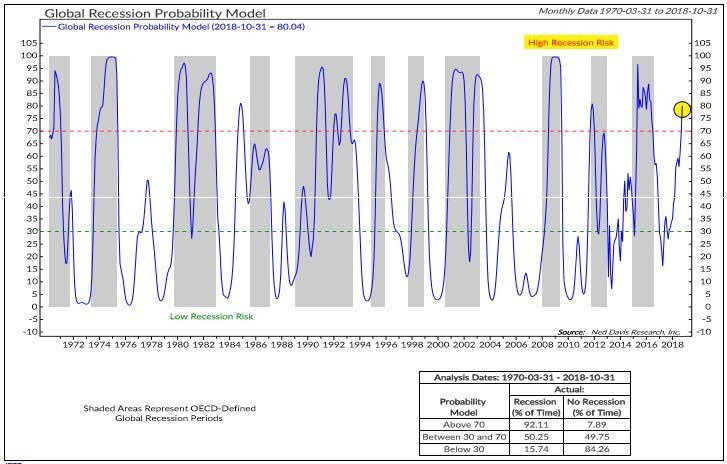
There is also a case to be made for an America First approach over a medium term (6-12 months) time horizon. I wrote before that US recession odds are receding. However, the global economy remains fragile. The Ned Davis Research (NDR) Global Recession Model shows the chances of a global recession has rapidly risen.
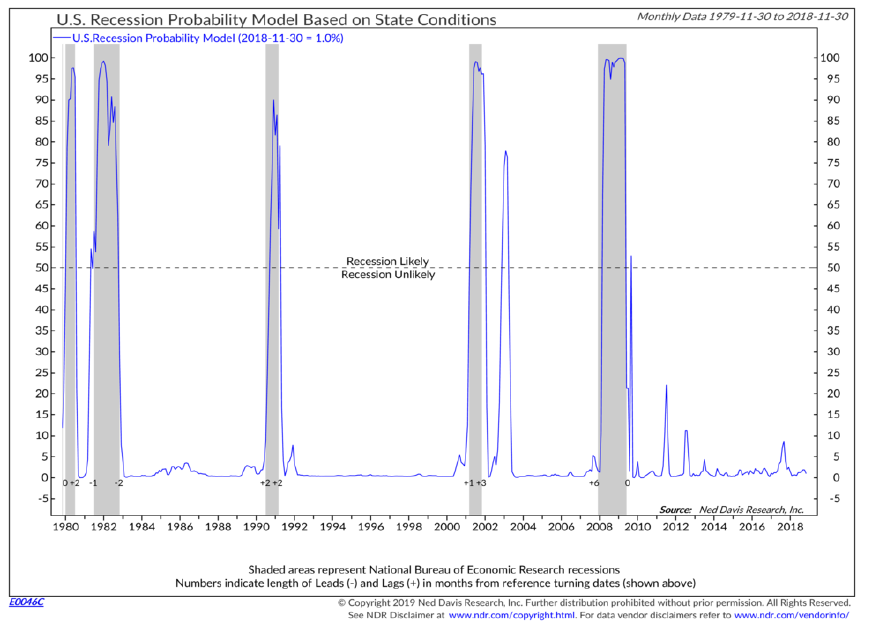
By contrast, the NDR US Recession Model shows recession risk is still low, which concurs with my own analysis.
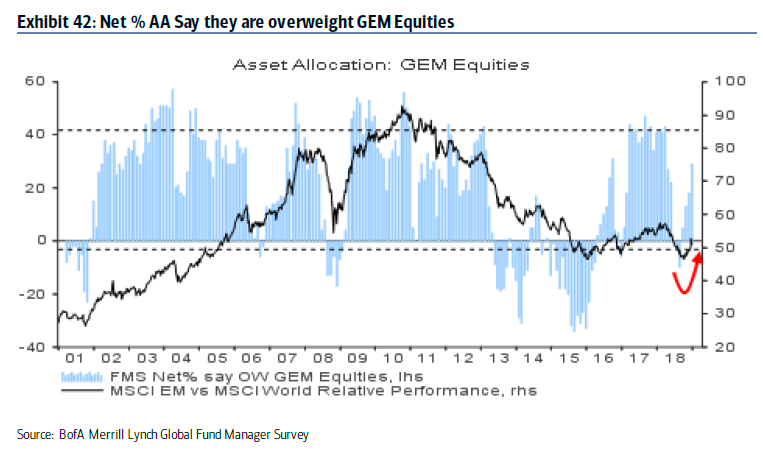
If a non-US recession were to develop, current positioning would favor the outperformance of US stocks. The latest BAML Fund Manager Survey shows that institutional managers have sold their US equity position down to neutral, eurozone zone equities to an underweight position (not shown), and they are avoiding the UK (not shown).
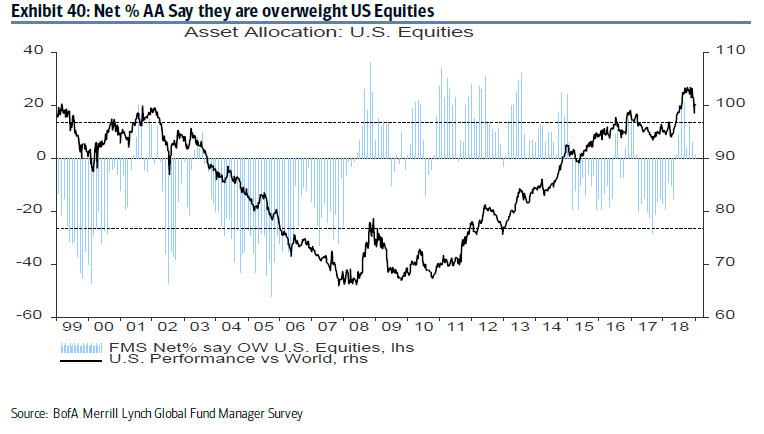
However, they have gone risk-on by pouring money into emerging market stocks.
The chart below depicts annual global real M1 growth compared to US equity returns. Global real M1 growth usually leads equity prices by about 10 months. However, should the US decouple from the rest of the world in a slowdown, a possible template of this scenario would be the Asian and Russian Crises of 1997-98. In that case, look for a reversal of fund flows as managers pile into the US market as a safe haven. While the US was not totally insulated from the Russia Crisis because of financial contagion from the collapse of LTCM, the Fed managed to stabilize and rescue the financial system in short order. Blink and you missed the market downdraft.

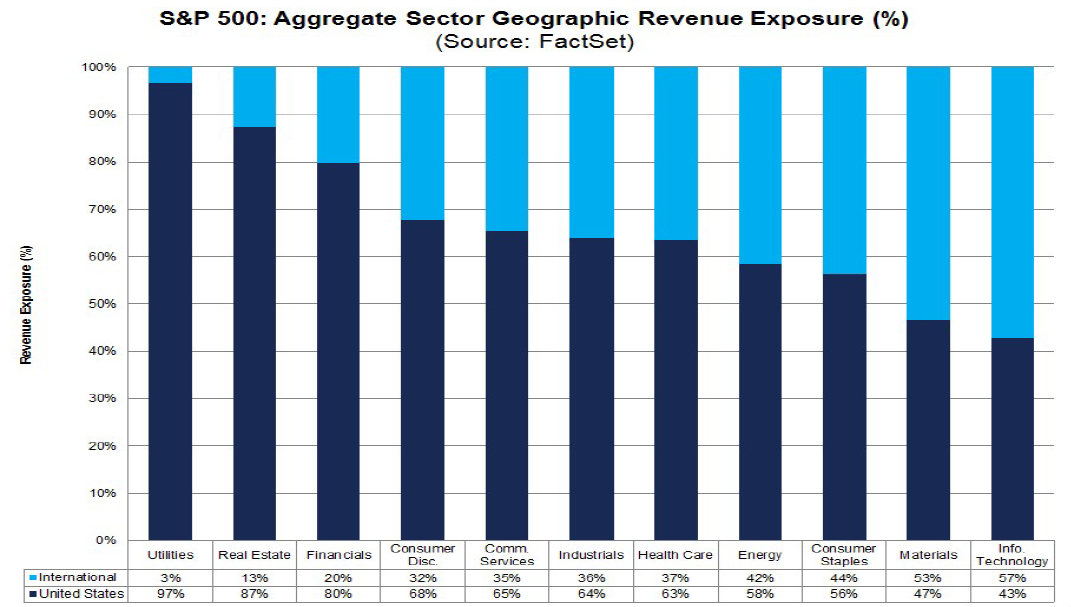
Under a scenario of a non-US slowdown, investors would flock into USD assets as a safe haven, and US equities as the only source of growth left standing. However, FactSet reports that 37% of the revenues of the S&P 500 come from foreign sources, companies with international operations will be vulnerable because of a combination of declining foreign sales and unfavorable currency effects from a rising USD. Under these circumstances, investors should tilt their exposure to domestically oriented companies among large cap stocks, or mid and small caps which tend to have fewer foreign operations.
Key long-term risks
There are a number of key risks to the bullish outlook for US equities, both in the long and medium term. While the demographics research from the San Francisco Fed was highly intriguing, the same researchers turned their sights to foreign markets in 2014, and they found they could not reproduced the same results in non-US markets.

I believe that the differences in research results can be attributable to the strong equity culture in the US compared to the other markets, and the size of the US market which produces a strong home bias where American investors generally do not venture outside its borders.
As an example, the World Bank reported that the 2017 US market cap to GDP ratio, which can be thought of as a proxy for the strength of the equity culture, is 165.7%. By contrast, the market to GDP ratio is 61.5% for Germany, 106.5% in France, and 77.9% for the eurozone.
One of the key assumptions of the demographics study is domestic investors are largely responsible for changes in their own market. That is only true if investors have a strong home bias, and foreign investors have minimal participation in a country’s equity market. The US equity market comprise slightly over half of the global market cap, which can encourage a home bias for American investors. By contrast, an MSCI report indicated that UK investors, who also have a fairly strong equity culture, only put 25% to 45% of their equity allocation into UK stocks. How many Americans do you know only allocate that little to domestic equities?
U.K. institutional and retail investors, respectively, held more than 25% and 45% of their stock holdings in U.K. companies, according to industry research.1 To illustrate U.K. investors’ relative concentration in their home market, U.K. stocks made up only 5.2% of the free-float market capitalization of the MSCI ACWI Index as of the end of December 2018.
The San Francisco Fed research only addressed the demographics effects on Wall Street, the demographics of the aging of the Millennials on Main Street is equally important. Unlike their parents, the Millennial generation is facing a number of economic headwinds as they enter their prime earnings years. One of their key problems is wage stagnation, and labor’s falling share of the GDP pie.

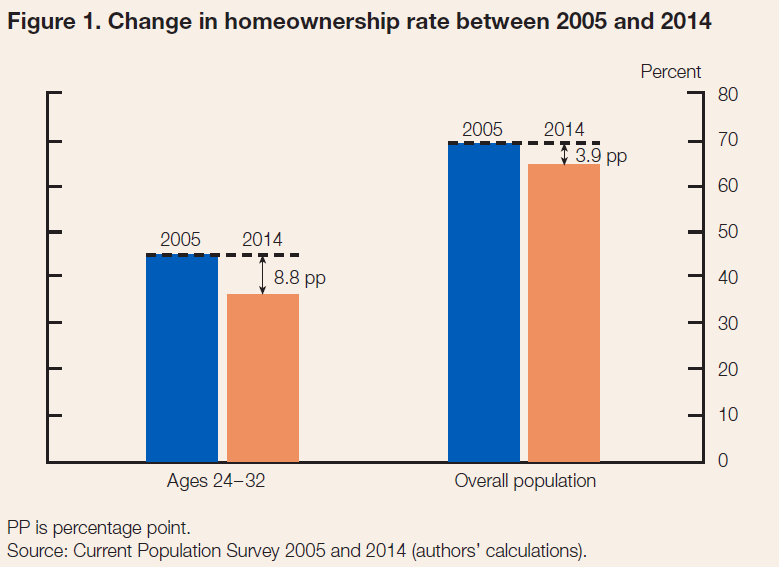
Another headwind can be found on the liability side of the Millennial cohort’s balance sheet. A recent Fed study concluded that the burden of student loans has prevented about 400,000 young Americans from buying homes between 2005 and 2014.
The authors of the study also pointed out that student loan debt has broader implications for consumers:
This finding has implications well beyond homeownership, as credit scores impact consumers’ access to and cost of nearly all kinds of credit, including auto loans and credit cards. While investing in postsecondary education continues to yield, on average, positive and substantial returns, burdensome student loan debt levels may be lessening these benefits.
Despite the tailwinds of a rising work force over the next decade, the size of the demographic dividend will be dependent on policy decisions made in Washington. A recent Pew Research Center poll indicates that the Millennial and Gen Z cohorts are more liberal than their elders, and look for government for solutions. This may create greater political pressure to alleviate problems such as income inequality and student debt in the coming years, and unleash a demographic driven spending boom over the next couple of decades.

Key medium-term risks
In the medium term, there are two key risks to the bullish forecast. If the American economy were to sidestep a recession while non-US economies slow, financial contagion risk will have to be contained. Last week, we saw two Chinese HK-listed developers mysteriously plunge without warning because of a rumored default and the cross-shareholdings and cross-collateralization of shares pledged in loans:
Jiayuan International Group Ltd., Sunshine 100 China Holdings Ltd. and Rentian Technology Holdings Ltd. fell over 75 percent in a matter of minutes and at least 10 companies were 20 percent lower or more by the close, wiping out HK$37.4 billion ($4.8 billion) in market value. Most of that came from Jiayuan, which lost HK$26.3 billion on record volume.
“Some of these companies might have cross-shareholdings in each other and when one of those starts to tumble, it brings down other related stocks,” said Hao Hong, chief strategist with Bocom International Holdings Co. “It’s likely more similar stock crashes could happen this year. A lot of share pledges in Hong Kong are underwater, and as soon as the positions are liquidated it triggers an avalanche.”

So far, so good. The sell-off was isolated to a small group of companies, and the damage contained. This is something that investors will have to keep an eye on.
From a domestic viewpoint, the partial government shutdown is starting to raise concerns on Wall Street about economic growth. The latest estimates call for a cut of 0.1% in GDP growth per week, but the damage could begin to escalate. Politico reported that Wall Street is starting to get worried that a prolonged stalemate could push the economy into recession[emphasis added]:
Recessions don’t just happen, after all. They are usually triggered by largely unforeseen shocks to the system, like the tech over-investment and dot-com crash of the late 1990s or the credit crisis of 2008. The government shutdown is not there yet. But the longer it drags on, the closer it gets.
“You can take the ruler out right now and calculate the exact impact from missed paychecks and contracts and you don’t have to go many months to get to zero growth,” said Torsten Slok, chief international economist at Deutsche Bank. “But this is not just some linear event. It can get exponentially worse in very unpredictable ways, from government workers quitting, to strikes, to companies not going public. It’s no longer just a political sideshow, it’s a real recession risk.”
Now some are slashing their estimates even further. Ian Shepherdson of Pantheon Macroeconomics this week said if the shutdown lasts through March it could push first-quarter growth below zero, a sentiment echoed by J.P. Morgan Chase CEO Jamie Dimon on the bank’s earnings call on Tuesday in which he implored Trump and Congress to make a deal.
While some of the economic damage will be reversed once the shutdown is ended, when government employees receive back pay, workers will nevertheless have to deal with the degradation of their credit ratings. The real damage comes from the contractor sector, especially when contract employees will not be paid for the shutdown period. There has been a significant shift in federal government employment since 2000 as more services were outsourced. The number of contractors has grown while the count of full-time employees have stagnated.

US economic growth is already slowing from an annualized pace of 3-4% growth in H2 2018 to about 2% in 2019. Should the budget impasse and the partial government shutdown continue, growth could slow sufficiently to spook the markets that a recession is about to start. In addition, should the US-China trade talks end without a deal and a renewed trade war, the global growth outlook is also likely to darken.
In conclusion, the market may be setting up for an America First era of U.S. equity outperformance, both in the medium and long term. The long-term outlook is favourable because of an anticipated demographic dividend. U.S. equities with a domestic focus may outperform over the next 6–-12 months because of stronger economic growth prospects compared to the rest of the world. However, investors should be aware that demographics is are not necessarily destiny, and there are other factors affecting long-term equity returns. In the medium term, the U.S. is not immune to financial contagion from abroad, and it is also at risk of policy error that could tank economic growth.
The week ahead: Waiting for direction
Looking to the week ahead, short-term direction is uncertain after several weeks of strong gains. The market’s behavior during the early part of Q4 earnings season also give little clue to future price direction. Results are roughly in-line with historical norms. The EPS beat rate is slightly above average, while the sales beat rate is slightly below, but results are highly preliminary. Forward 12-month EPS edged down only -0.01% last week, which is in stark contrast to the more recent history of downgrades. Is this the end of falling forward EPS estimates? It is too soon to tell.

On the other hand, Leigh Drogen of Estimize indicated that an earnings recession is ahead based on crowd-sourced earnings estimates (click this link if the video is not visible).
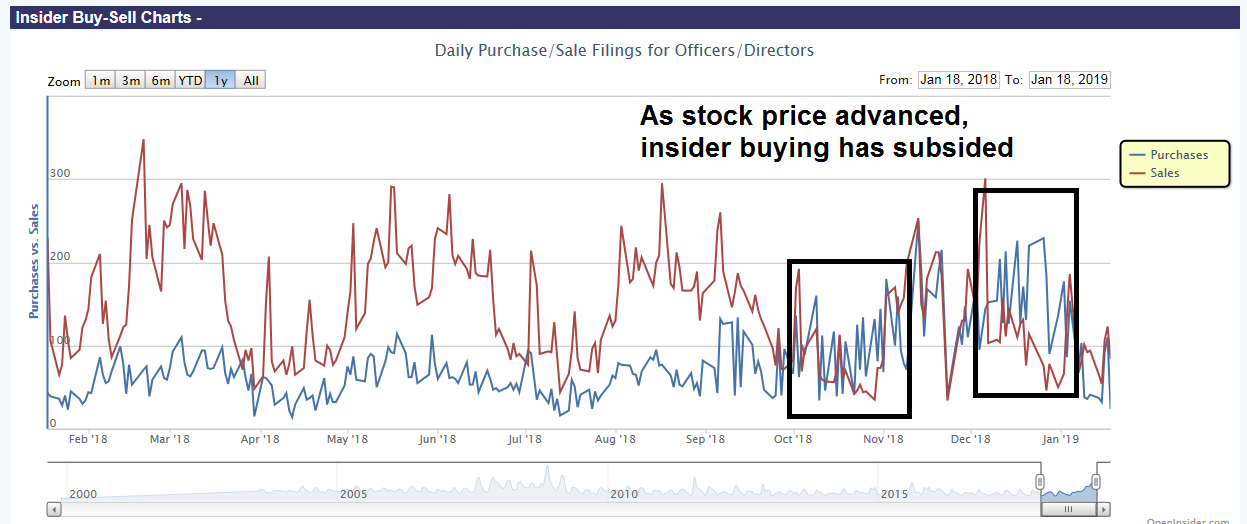
In addition, the bullish signal from insiders has turned neutral. The quick price recovery has tempered the enthusiasm of insiders. This group of “smart investors” bought heavily in past dips, but they have reverted to their normal pattern of selling as the market recovered.
The technical perspective is also mixed. On one hand, recent bullish market action is typical of past episodes of Zweig Breadth Thrusts (see A rare “What’s my credit card limit” buy signal) and what Walter Deemer calls breakaway momentum. If history is any guide, expect the market to continue to grind upwards.

But the market is obvious quite overbought. What is less clear is whether current readings represent a series of good overbought conditions that accompany strong advances, or just an extended market ready for a pullback. The chart below shows RSI-5 and RSI-14 to illustrate the difference between short and medium term momentum. RSI-5 is overbought at 85, but RSI-14 has not risen above 70 indicating an overbought condition. The 10-year history of past episodes give little guidance. The market went on to rise further in half of similar instances (blue vertical line), and retreat in the other half (red vertical line).

In the very short run, the SPX is likely to encounter overhead trend line resistance at 2680-2685, with initial support at 2635, and secondary support at 2575. Watch these levels and keep an open mind.

The upcoming week may turn out to be a make or break period for market direction. Internals such as market cap leadership is not yielding any definitive clues. Mid and small cap stocks remain in relative downtrends, and NASDAQ names are mired in a relative trading range.

My inner investor is adopting a neutral position on the market. Stock prices have recovered sufficiently that they represent value, but they are no longer screaming buys. He has moved his asset allocation back to a neutral weight from an underweight position in equities.
My inner trader is leaning slightly bullish, but only slightly. The market is overbought on short-term breadth, but an examination of the last ZBT (warning, N=1) shows that prices reached a similar overbought condition, pulled back briefly, and went on to more gains. Should the market weaken early next week, he is prepared to buy the dip, but a strong risk control discipline is required should the pullback turn into a deeper correction.

Disclosure: Long SPXL
So, for those with very long term horizons (a decade or more), here is a simple formula to follow;
A combination of VTI/VT/VCSH.
With what Cam has written above, one could have a larger % of VTI than VT (say 80/20/0 or 75/15/10% or 50/10/40) . VCSH can be changed up to 40% based on where one is in a lifetime risk cycle. VCSH can also be changed to a state Muni fund in the state where you live (some states are not investible).
https://finance.yahoo.com/news/only-two-vanguard-index-funds-182003885.html
Looking at the attitude of our younger generations, clearly US is heading toward the direction of old France. Ironically France today is trying to move toward the direction of old US; see how hard it is. Just ask Macron. My personal opinion is that US is not going to have high growth in the future, when everyone is looking for other people’s money (OPM) thru government taxation. Coupled with high level of debt and escalating health care cost, it would be lucky there is no crisis. US is now a feel-good society. A little hardship and people squeak like pigs in a slaughterhouse.
I completely agree with you. 50% US population is on a handout. Asset prices are historically high, and fueled by debt (QEs). The current younger generation has seen two bear markets of 50% or more in this century. Who wants to loose share holder capital?
Companies (like Uber, Lyft, Pinetrest and many like these) are going public at very high valuations. Such high valuations means that the public who buys them, will lose capital, because of very high valuations. Good example of this is Snapchat, and Alibaba. New IPOs are usually what drives US markets. This phenomenon was discussed at length in Wall Street Journal at length last year.
With QT and attempted normalization of interest rates, and generally high valuations, one could make a case of moderate rise in US stocks. I detailed in the last article on this platform, that so far, this century, $&P 500 has returned 5.6% per annum. 5.6% per annum is too low a reward for investing in risky stocks. A 3% treasury, may be a better risk adjusted return.
Now, if the US Fed prints 50-100 Trillion $s, pushes Fed fund rates to -5%, what I have written would not be true. Would these things happen? Yes, anything is possible. Well, even Ben Bernanke could not have imagined that he would be responsible for 4 Trillion $ of money printing and Fed funds rate of 0.25% were he asked in year 2000.
Last quarter’s correction apparently took stocks down to (a historic PE ratio average of) 15.6. Ask yourself the question if a PE ratio of 15.6 is a bargain price? IMHO, no. Even at a bear market bottom of March 2009, PE ratio dipped only to around 11-12. So, we had a bear market bottom in year 2000, year 2009, next in 2019-20? Give or take every decade?
Now, as Cam has pointed out stock market valuations depend on underlying inflation, interest rate environment etc. So, if the current stock market falls to say 2100 (S&P 500), there will be new QE and Fed funds rates approaching zero. Buy some gold as insurance.
The elders of the Baby Boomers dismissed them as a bunch of (literal) hippies who wanted to do nothing and looked for handouts. But the Boomers grew up, got married, had babies, got jobs, and created a powerful demographic boom.
Interesting.
There are significant inter-generational differences that are slowly becoming apparent. The graph that you have posted above from the Pew research centre shows just one such difference.
How the post boomer generation will behave is very difficult to predict. Though the boomer generation settled down, and created a powerful demographic boom, as you say, there is also a serious hangover of debt that the boomer generation is leaving behind. Future generation may be less cavalier. America, post world war 2 was a land of opportunity, but the same adage may not be as true (despite the rhetoric) in the coming generations. Some of this has to do with globalized nature of the world.
The 17.7% annualized returns from the 1980-2000 period led to a 5.6% annualized returns from 2000-2018. So, yes, the 17.7% returns from 1980-2000 could be attributed to the boomer generation (1946-1964; they would be 54 years old or younger by year 2000).
So, the post boomer generation “boom” has created a 5.6% annualized return in the last two decades. Where is the ‘post boomer’ generational boost?
As I write this post, here is an interesting analysis of the next decade;
https://www.marketwatch.com/story/how-low-will-the-sp-500-go-buffett-and-shiller-know-2019-01-23
The above article does appear to predict what the next decade of stock market returns may look like (with due apologies to those who dispute the Professor Shiller’s CAPE methodology).
Furthermore, the same article also critiques on the returns of gold and bonds, as part of a very well diversified portfolio.
Ciovacco posted his study of 25 A/D breadth thrusts. I think it is worth a browse.
https://www.ccmmarketmodel.com/short-takes/2019/1/20/similar-breadth-thrusts