Mid-week market update: Since my publication detailing the Zweig Breadth Thrust buy signal (see A rare “what’s my credit card limit” buy signal), I have been inundated with questions about the possible twists and turns of the market after such a signal. I discussed this issue extensively in 2015 (see The Zweig Breadth Thrust as a case study in quantitative analysis), my conclusion was:
What can we conclude from examining the data? Perturbing the data can yield different ZBT signals, Even discounting the different versions of the ZBT buy signals, I think that everyone can conclude that we saw a bona fide ZBT buy signal last week.
The question then becomes one of what subsequent returns were and how much can we rely on ZBT to take action in our portfolios. My conclusion, which agrees with Rob Hanna, is that the stock market tends to rise after ZBT buy signals. At worse, stocks didn’t go up, so a long position really doesn’t hurt you very much. The poor ZBT returns from the 1930’s represent a market environment from a long-ago era that may not be applicable today and therefore those results should be discounted.
Investors and traders should not treat these models and indicators so literally. History doesn’t repeat, it rhymes.
This is another reason why I am not a big fan of analogs. I recently referred to the 1962 Kennedy Slide as a possible template for the stock market, though I was thinking in terms of the bottoming pattern. From a different perspective, Global Macro Monitor highlighted a 1962-2019 analog for the stock market, which was picked up by Zero Hedge (bless their bearish hearts).

Does this look scary? Does this mean that the stock market is about to fall off a cliff, or is this just click bait?
Market implications
While I would never say “never”, but consider what happened in 1962. The so-called Kennedy Slide was the result of Kennedy going after the steel companies. He ultimately prevailed by sending in the FBI into steel company offices, and the homes of steel executives. The market panicked because it was anticipating what industries JFK would go after next.
What would be the catalyst for such a sell-off today? Here are a few possible candidates that I can think of:
- A full-blown trade war with China because negotiations have broken down
- Trump crosses the a State of Emergency Rubicon (see A State of Emergency for the markets too?)
In other words, you would be betting on some catastrophic event like this as the base case scenario. While we recognize that such outcomes are risks, it is difficult to see how they represent the central tendency.
The risk of small sample sizes
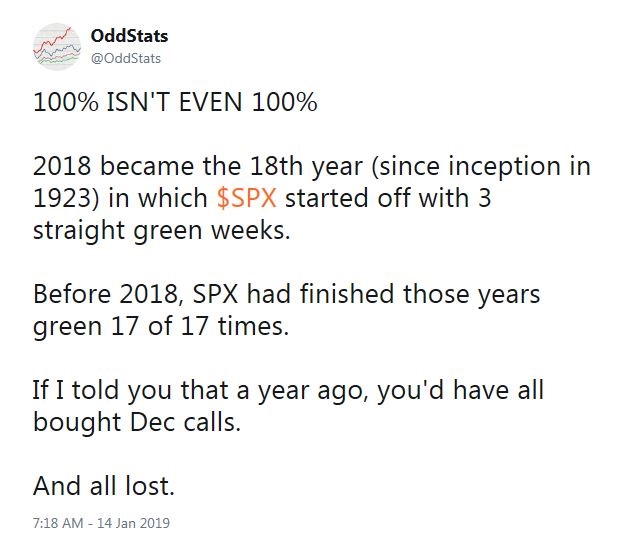
Traders need to avoid the mindset that there is some magic black box that gives them 100% certainty. Here is one example from OddStats of how a historical study (N=17) with 100% certainty isn’t really a sure fire bet..
If you torture the data hard enough, it will talk, but should you believe everything it tells you, especially with a small sample size? Here is another historical analog of the 1982 market compared to the 2019 market from OddStats. How much should you trust the historical pattern?

A more sensible approach to an event like a ZBT is to recognize that it represents an unusual price momentum surge using historical analysis like this one from Troy Bombardia. Even then, traders should be wary of torturing the data until it talks.

So far, the market has paused its advance earlier this week, and we may continue to see some near-term pullback or consolidation. If history is any guide, weakness should be viewed as buying opportunities, barring any unexpected cataclysmic news.
No free lunch
I pointed out before (see A 2018 report card) that, regardless of how good the historical record of a trading system, you are making a bet somewhere. It is a truism in finance theory that you have to take on risk to be rewarded with higher returns, and if you don’t want to take a risk, then you earn the risk-free rate. All trading systems have vulnerabilities, and those vulnerabilities will fail at some point. That’s a feature, not a bug.
There is no certainty in the markets. You can only profit by playing the odds in an intelligent and sensible fashion.
Disclosure: Long SPXL
Well put!
Here Here!!
F
>The poor ZBT returns from the 1930’s represent a market environment from a long-ago era that may not be applicable today and therefore those results should be discounted.
Forgive me Cam, I am not a nit-picker. You have probably heard the Ray Dalio 1937 analogy by now – tightening in an era of unconventional monetary policy may make the 1930s relevant after all. Am curious about your comments on this point. Best, mk
Behavioral economics tells us that our Confirmation Bias will have us choosing the outcome we expect from a range of possibilities. So for the ZBT we have it possibly going up and up or making a second low before going up and up. Our personal choice of which we take is our personal bias.
How do we overcome our biases to do better?
My suggestion is to set up an objective action strategy. Let me brainstorm this as an example (just that not one I use).
Let’s say one commits to buying one third of one’s trading position when a ZBT arrives. Then add another third if market retraces half the gain from the low. If the market then turns up from this minor pullback and makes a higher high from you first purchase level buy the last third. If the market doesn’t turn up but makes a double bottom , buy then with your last third.
That is an example of an investor that is bearish and hesitating to buy in after markets have rallied. The objective strategy gets them in to some degree with any future outcome.
How about an investor with an bullish bias? They might go all-in with all their chips when a ZBT arrives but have a ten day moving average exit/rebuy strategy with half (or more) of their investment.
All this to say, an objective strategy will help overcome one’s biases. Customize it to suit your thinking.
So, market was around 2632, on 11-26-2018 and circa 11-19-2017. We are now at the same point now, give or take.
Someone who bought the market on 11-26-2018 or on 11-19-2017, bought it with no ZBT signal.
None of these constitute long term buy signals. Sure, as trading signals, these would likely work, as Cam has show elegantly.
That said, our focus should be on earnings per share of S&P 500 and monetary policy, market valuation, geopolitical risks and corporate debt (this may be Black Swan event, this time), trade war, consumer confidence, all linked to each other. The question remains here is whether we are going to open the next trap door down, here, at 2634 (50 dma) on the S&P 500. Bear markets are painful affairs, and for now, there has not been enough pain. The metric of pain, can be in Vix level, put to call ratios, bull bear ratios or CNN fear and greed index, but more importantly time. So, how does the average Joe feel, if come 11/2019 and 11/2020, market is at 1550 (50% loss from the peak of 2018)? Would we see 1550 (this number is also the peak of 2000 and 2007 bull markets)? Well, Cam has pointed out Fibonacci retracement of 33% to 2100. If we were to see 2100, emotional selling could well take us down much below 2100.
Excellent points D.V.
As an investor, that is what I am trying to understand at this juncture. ZBT could be good for trading, however None of the issues that you have mentioned have been squared away. Hence my hesitation on actually believing this bounce. All of the things that really matter, i.e. Earnings, valuation, corporate debt, trade war, Brexit, consumer confidence (which is most surely taking a hit with the shutdown), have not been resolved.
I agree with your sentiments, and do believe that “the Pain” has not been felt by the weak hands and they have not capitulated, yet for me to think about a bear market bottom.
We could both be wrong and Ken might be on to something since he is more of a professional than at least myself. And he has pointed out counter points very well. Maybe this is the Proverbial “Wall of worry”
I am in a wait and see pattern.
Thanks again for your contribution to this blog over the last few years.
Mohit
Stocks returned on an average 17.7%, PER ANNUM from 1980-2000.
From 2000-2018, the return has been only 5.6% per annum.
Before getting too comfortable with stocks, think again, if you are getting adequate risk adjusted returns in stocks or not.
Class A Illinois farmland has appreciated from 3000$ to 12k give or take (8% annualized return), in the same time.
Physical gold (bullion) has risen from 265$ to 1290$ in the time frame (9% annualized return).
Understand that Illinois farmland has lost roughly 30% or so value from its peak (my returns are after taking this loss, at current prices). Same for gold, which has lost roughly 30% from its peak. Again, my returns on gold are after the loss, on current prices.
The question is will current stock prices return historic 8-10% returns in the next decade? If they do, next decade should see massive annualized gains, so that there is a return to mean. If stock prices are random, it is possible that S&P 500, could yield an annualized over 10% return over the next 1-2 decades, so that there is mean reversion to 8-10%. Stocks have created returns with significant volatility, as compared to a widely diversified asset portfolio. For my money, I like to cut risk, as rewards are nebulous. I have done well in the last two decades by limiting exposure to stocks. Academics will tell you otherwise, but 5.6% annualized returns are way sub par, for the risk one would incur on capital. By comparison, a 20 year US treasury bond in 2000 was close to 7% annual yield.
It is important to measure investment horizons over years and decades, not in months and quarters. Last quarter of 2018 was an anomaly in that respect.
Thanks for the extra clarifications.
Cam, this has been a great call. Thank you. The sentiment – at least based on market chatter – seems to have reversed quite a bit. Is it time to close some longs in the trading account?