Preface: Explaining our market timing models
We maintain several market timing models, each with differing time horizons. The “Ultimate Market Timing Model” is a long-term market timing model based on the research outlined in our post, Building the ultimate market timing model. This model tends to generate only a handful of signals each decade.
The Trend Model is an asset allocation model which applies trend following principles based on the inputs of global stock and commodity price. This model has a shorter time horizon and tends to turn over about 4-6 times a year. In essence, it seeks to answer the question, “Is the trend in the global economy expansion (bullish) or contraction (bearish)?”
My inner trader uses a trading model, which is a blend of price momentum (is the Trend Model becoming more bullish, or bearish?) and overbought/oversold extremes (don’t buy if the trend is overbought, and vice versa). Subscribers receive real-time alerts of model changes, and a hypothetical trading record of the those email alerts are updated weekly here. The hypothetical trading record of the trading model of the real-time alerts that began in March 2016 is shown below.

The latest signals of each model are as follows:
- Ultimate market timing model: Sell equities
- Trend Model signal: Bearish
- Trading model: Bearish
Update schedule: I generally update model readings on my site on weekends and tweet mid-week observations at @humblestudent. Subscribers receive real-time alerts of trading model changes, and a hypothetical trading record of the those email alerts is shown here.
A look ahead to H1 2019
It gives me little pleasure to say “I told you so”. But I told you so.
I warned in early December that earnings were going to disappoint in 2019 (see 2019 preview: Winter is coming). Since then, tumbling earnings estimates have been one of the main reasons for the weakness in stock prices.

The recent warning from Apple is just setting the table for further disappointment, and the upcoming Q4 earnings season will be revealing as to how far estimates have to fall. I expect more market sloppiness in Q1 and the first six months of 2019, until the uncertainties surrounding the upcoming growth deceleration and trade war are resolved.
A Wile E Coyote moment
Call the growth deceleration whatever you want. Bloomberg reported that Ben Bernanke called it a Wile E. Coyote moment for the American economy because the stimulus effects of the tax bill is wearing off:
U.S. economic growth could face a challenging slowdown as the Trump Administration’s powerful fiscal stimulus fades after two years, according to former Federal Reserve Chairman Ben Bernanke.
Bernanke said the $1.5 trillion in personal and corporate tax cuts and a $300 billion increase in federal spending signed by President Donald Trump “makes the Fed’s job more difficult all around” because it’s coming at a time of very low U.S. unemployment.
“What you are getting is a stimulus at the very wrong moment,” Bernanke said Thursday during a policy discussion at the American Enterprise Institute, a Washington think tank. “The economy is already at full employment.”
The stimulus “is going to hit the economy in a big way this year and next year, and then in 2020 Wile E. Coyote is going to go off the cliff,” Bernanke said, referring to the hapless character in the Road Runner cartoon series.
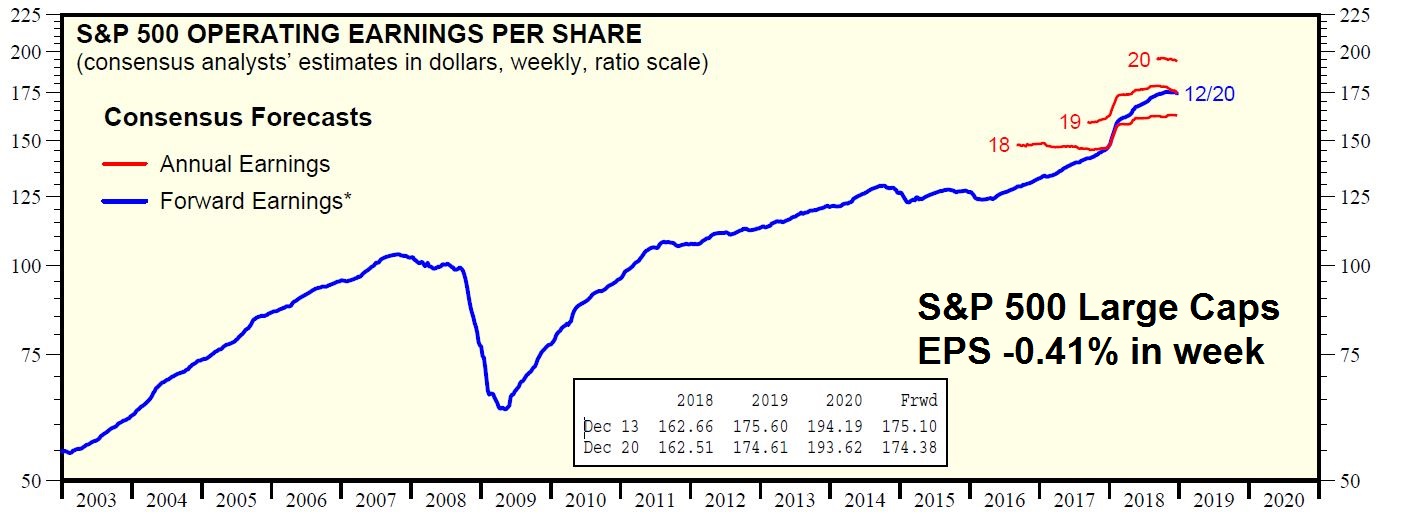
As this analysis from FactSet shows, the tax cut boost to EPS estimate is over. Q4 2018 estimate revisions are normalizing compared to its own history.

Analysis from Ed Yardeni found that forward 12-month earnings estimates are flat to down across all market cap bands:


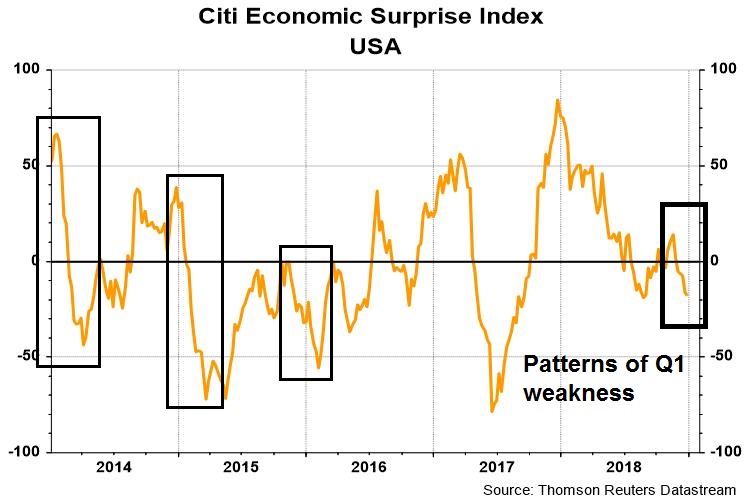
From a top-down perspective, the market faces the additional headwinds of likely macro disappointment. The Citigroup US Economic Surprise Index (ESI) measures whether macro data is beating or missing expectations. The historical experience shows that ESI has tended to fall early in the year, possibly because of faulty seasonal adjustment effects. The latest readings show that the disappointments are already underway.
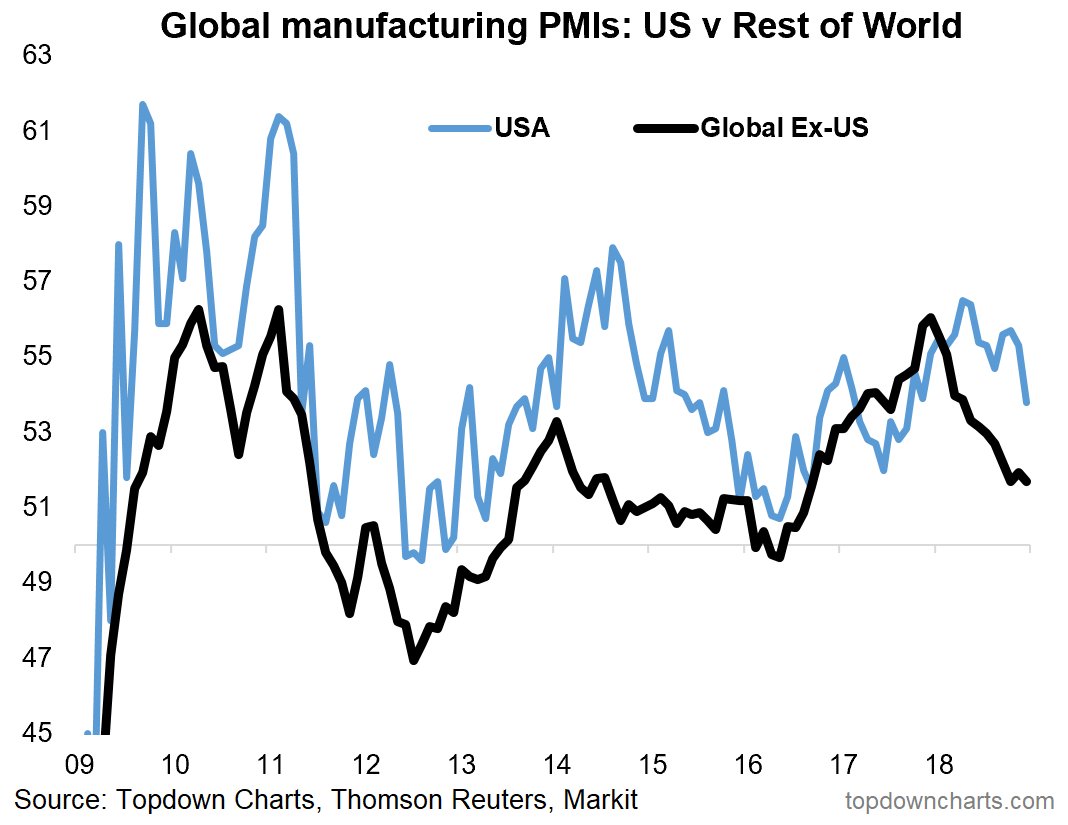
There is also economic weakness from overseas. Not only did the latest US ISM report decelerate and miss expectations, global PMIs are all falling. As a reminder, roughly 40% of the revenues of S&P 500 come from non-US sources.
Eurozone PMIs are weak, with the core European countries of France and Germany leading the way downwards.

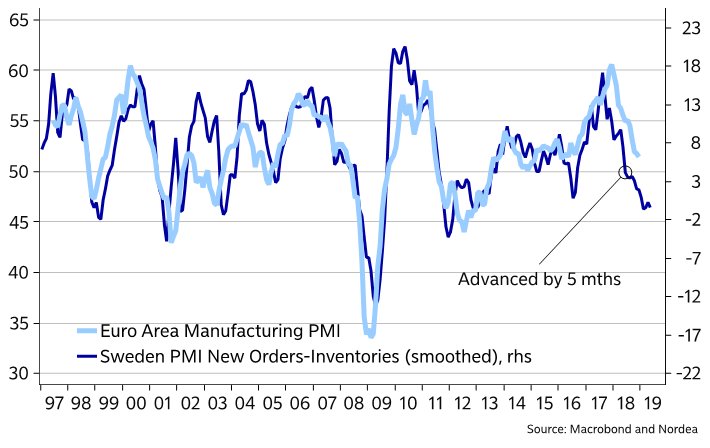
The weakness is probably not over. Nordea Markets pointed out that Sweden is a small open export-oriented economy and serves as a good leading indicator for the rest of Europe. The latest readings for Swedish PMI indicates more pain to come.
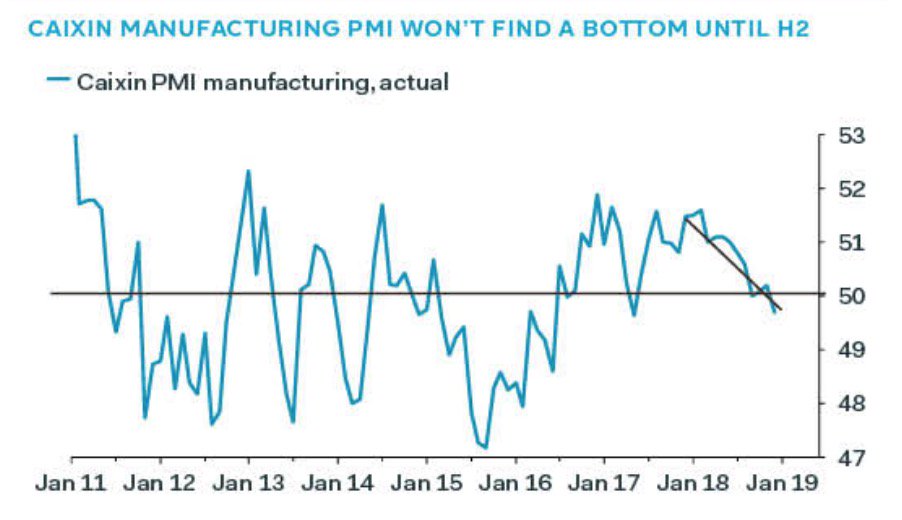
Then we have China. The Apple warning highlighted the weakness in China, even without the full effects of the tariffs. The latest Caixin PMI, which measures the activities of smaller companies, came in below expectations and under 50, indicating economic contraction.
China ESI is also indicating macro disappointment.

What about stimulus? When the economy weakens like this, doesn’t Beijing respond with a stimulus program? To be sure, there have been some limited stimulus, such as tax cuts, reserve requirement ratio cuts by 1% in two stages of 0.5%, and administrative measures ordering banks to lend to small businesses. The WSJ reported the government is singling out the small business sector for special attention:
Shoring up smaller private businesses—which provide more than 80% of employment—has become a priority after years when policies and practices largely favored big state-owned companies. In recent months, Beijing has rolled out several measures to help small companies issue bonds, get bank credit and be covered with more tax breaks.
Mr. Li urged the state-owned bank executives on Friday to lend to small businesses at closer to benchmark rates, according to people with knowledge of the meetings. Borrowing at rates close to the benchmark is a privilege long enjoyed by big state-owned companies
“Stabilizing employment relies on thousands of small and micro enterprises, which can’t develop without support from inclusive finance,” Mr. Li told a group of bankers, according to state-run China Central Television.
Mr. Li also told the bankers that as they allocate 30% of new lending to small businesses they should cap the ratio of bad loans at 2%, the people with knowledge of the meetings said. That level is low for lending to smaller businesses, which are considered riskier borrowers, though the current overall bad-loan ratio for all commercial banks is just below 1.9%, according to data from the banking regulator.
While the efforts are well-intentioned, such initiatives may amount to nothing more to the proverbial “pushing on a string” as they will just create more bad loans:
China Citic Bank in eastern Zhejiang province, a private business hub, received government orders last month to boost loans to small companies at a rate so low as to be unprofitable, according to a credit manager at the main provincial branch.
“Some of this lending will definitely lead to losses given such a low interest rate,” the officer said. “But since it’s an administrative order, we have no choice.”
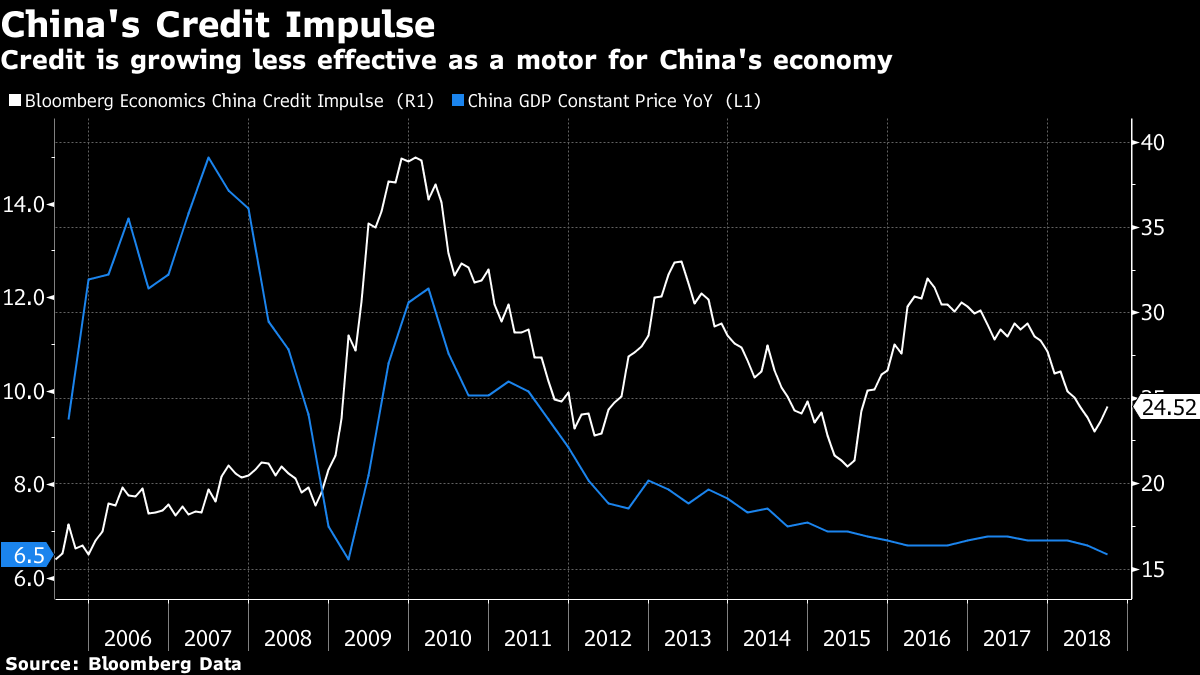
The Chinese authorities are running out of bullets. John Authers of Bloomberg illustrated the problem of diminishing return on credit driven stimulus with this graph.
Bottom line, both the US and global economies are decelerating.
The silver lining
While the combination of top-down and bottom-up fundamental momentum is negative, there are a number of contrarian silver linings for equity bulls. These factors are early indications that the market is starting a bottoming process, and downside risk may be limited from current levels.
I offered a bottom spotting checklist last week (see How to spot the bear market bottom), and one of the conditions is some signs of long-term sentiment capitulation. In particular, I stated that I would like to see II %Bears to rise above %Bulls, as sentiment had been stubbornly complacent. Lo and behold, the latest survey shows a spike in %Bears above %Bulls.

Here is a longer term perspective of II sentiment from Tiho Brkan. The spike in bearish sentiment is a constructive sign that the market is undergoing a bottoming process, though sentiment tends to be an imprecise indicating for timing exact bottoms.

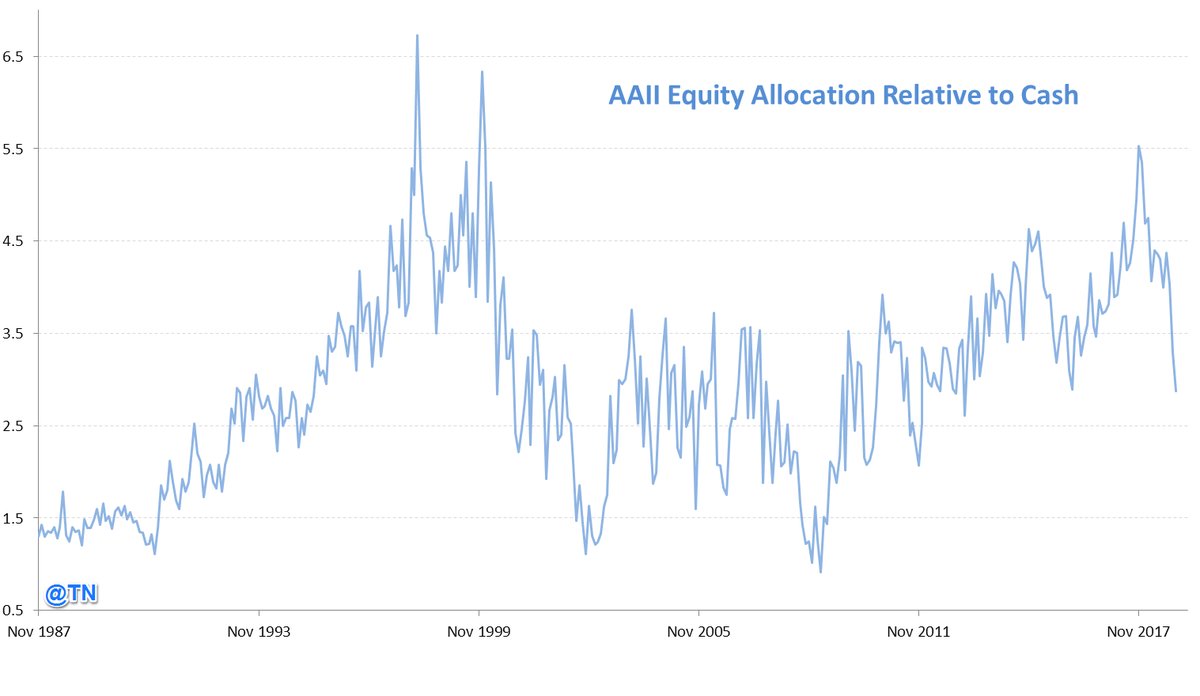
Still, I would like to see further signs of prolonged bearishness. As an example, the AAII asset allocation survey shows that while individual investors are pulling back their equity allocations, readings are nowhere near levels that indicate full capitulation.
Another constructive sign that the market may bottoming is the behavior of insiders. Insiders bought the dip in October and November, and they are buying the latest market weakness.

To be sure, this group of “smart investors” were buying the dip all the way down during the 2008-2009 bear market. Nevertheless, this represents a hopeful sign that fundamentals are not collapsing and the stock market offers good value at current levels.

The trade war wildcard
So is the market bottoming here, and investors should be preparing to buy stocks at current prices?
Not so fast! I had offered the following qualifications to my forecast in early December (see 2019 preview: Winter is coming):
If the economy avoids a recession under the “mild winter” scenario, I expect stock prices to weaken in H1 2019, and that should provide the buying opportunity for investors. If the US and China can keep the trade tensions controlled, and the world sidesteps a recession, then the mild winter scenario is very much in play.
On the other hand, if either the trade conflict deteriorates into a full-blown trade war, or if the macro data in my set of long leading indicators weaken enough to signal a recession, then all bets are off.
Much depends on the progress of the Sino-American trade negotiations. Here are the bull and bear cases.
From the bulls’ viewpoint, Trump’s behavior in the last few weeks has demonstrated that he is acutely aware of the judgment of the stock market. A trade war induced recession is virtually certain to sink his chances of re-election in 2020. He will do everything in his power to come to an agreement with the Chinese. One template might be the NAFTA 2.0 negotiations, where he extracted a number of minor concessions and declared victory. The urgency for a deal from China’s viewpoint is equally evident. The Chinese economy is slowing, and Beijing can ill-afford a slowdown which threatens financial and social stability. Chinese negotiators have already put together a package of substantial concessions. Somewhere between the American and Chinese positions, there is common ground for a trade agreement which will de-escalate tensions.
The bears will argue that both sides have limited negotiating room. There is already a substantial bipartisan consensus in Washington that China poses a threat to America from both trade and geopolitical perspectives. If Trump were to conclude a deal, he risks being outflanked in 2020 as being “soft on China”.
In addition, a CNN interview with Trump economic advisor Kevin Hassett is a hint that the Americans are digging and believe they have substantial negotiating leverage, which presents the risk that the US could overplay its hand. Hassett told CNN that, in the wake of the Apple earnings warning based on sales weakness in China, that “There are a heck of a lot of U.S. companies that have a lot of sales in China that are basically going to be watching their earnings be downgraded … until we get a deal with China. It’s not going to be just Apple.” Hassett went on to state that the Apple news puts American negotiators in a better position: “I think that puts a lot of pressure on China to make a deal. Their economy, for them, you might call a ‘recession.’ It’s slowing down in a way that they haven’t seen in a decade.” He added that, “China is feeling the blow of our tariffs.”
From the Chinese perspective, China will hold annual session of the National People’s Congress, China’s parliament, in March just after the expiry of the 90-day deadline. This is the most important political event of the year. Xi Jinping cannot be seen to be humiliated ahead of the Congress. Xinhua report “As required by the 19th National Congress of the Communist Party of China, Beijing is committed to deepening reform and furthering opening-up. In the process, some economic and trade issues that are of Washington’s concern will be solved.” Translation: Xi can only make concessions within the framework of the policies adopted at the party congress of October 2017, which is an affirmation of its industrial policy.
Xi stated at the 2017 congress, “The Communist Party of China will lead the country to basically realize socialist modernization by 2035.” The plan calls for “stronger and bigger” state-run companies. And China will move closer to achieving the target if it acquires overseas companies with advanced technologies in accordance with “Made in China 2025,” a carefully designed blueprint for upgrading China’s strategic industries. In other words, it cannot, and will not abandon “China 2025”.
The “China 2025” industrial policy has been a major stumbling block for both sides. The recent arrest of Huawei CFO Meng Wanzhou, as well as American efforts to lock major Chinese 5G providers Huawei and ZTE out of its market, as well as the market of its major allies, are viewed by Beijing as an effort to obstruct China’s 2025 industrial policy.
Realistically, the best case scenario would see no deal by the March 1 deadline, but both sides agree to keep talking, and the next round of tariffs put on hold while negotiations continue. It would be a “kick the can down the road” solution. The worst case would see negotiations break down and the next round of tariffs imposed on China. The IMF has projected a full-blown trade war would take 1.6% off China’s GDP growth and 1.0% off US GDP growth. Recession fears would spike, and the markets would undergo a major risk-off episode.
Fed policy error risk
The other major risk to the market is a Fed policy error that over-tightens the economy into recession. There is an enormous gulf between market expectations and the Fed’s dot plot. The market now expects no rate hike this year, and a possible rate cut by the end of 2019. By contrast, the Fed’s dot plot has two more quarter point rate hikes penciled in.
Who is right?
The market got very excited last Friday when Jay Powell charted a less hawkish tone by walking back his past remark about balance sheet reduction being on autopilot. He went on to state that the Fed is listening to the markets and the downside risks they are conveying. In short, the Fed is data dependent, and policy direction is especially unclear when the Fed abandons forward guidance.
While recent Fed speakers have hedged their remarks about being data dependent, recent former insiders like Bill Dudley has been more frank. A Bloomberg interview with former New York Fed president Bill Dudley shed some light into the Fed’s thinking. Dudley was a member of the triumvirate of the Fed chair (Yellen), Vice Chair (Fischer), and New York Fed President (Dudley) who drove most of the important monetary policy decisions. It was therefore illuminating to hear someone who can speak so honestly about Fed policy, and Dudley’s comments revealed a strong model-based cultural approach to policy decisions:
The recent stock market slump was probably necessary for U.S. policy makers to achieve their goal of restraining the expansion, former Federal Reserve Bank of New York President William Dudley said.
“Their view is, the economy is growing at an above-trend pace, we already have a very tight labor market, we need to slow the economy,” Dudley said in a Bloomberg Television interview Thursday. “Somewhat tighter financial conditions aren’t really a bad thing. They’re probably a necessary thing for the Fed to achieve its objectives.”
What about financial stability?
In his time at the New York Fed, which spanned the global financial crisis, Dudley elevated the importance of systematically incorporating changes in financial conditions into monetary policy decisions.
An index he designed while working as chief economist at Goldman Sachs Group Inc. before joining the Fed shows that conditions — a measure which combines the stock market, credit spreads and the exchange rate — are the tightest in about two years.
“What the Fed’s saying in their forecast is they still think — despite the sell-off in the stock market, despite the slowdown in global growth — that the economy is going to grow at an above-trend pace next year, and that’s why they’re continuing to tighten,” Dudley said.
“If the stock market were to keep going down, and the economy starts to weaken, then the Fed will definitely take a pause.”
Here is what it means to listen to the markets. Monetary policy operates with a lag, and the Fed is not going to react to every blip in stock prices. Financial conditions indices have begun to rise, indicating heightened stress, but levels are not excessive compared to past pre-recessionary readings.

Similarly, credit spreads are edging up, but levels are not alarming.
There is undoubtedly a debate raging at the Fed between the camp of the modelers and the camp of the pragmatists, led by Powell. In last Friday’s discussion, Powell made a parallel between the current situation to the 2015-2016 slowdown, and implied that the Fed could slow its pace of monetary policy tightening as it did during that period. Gavyn Davies, writing in the FT, compared and contrasted the data from two eras, and highlighted the likely opposition to the Powell narrative:

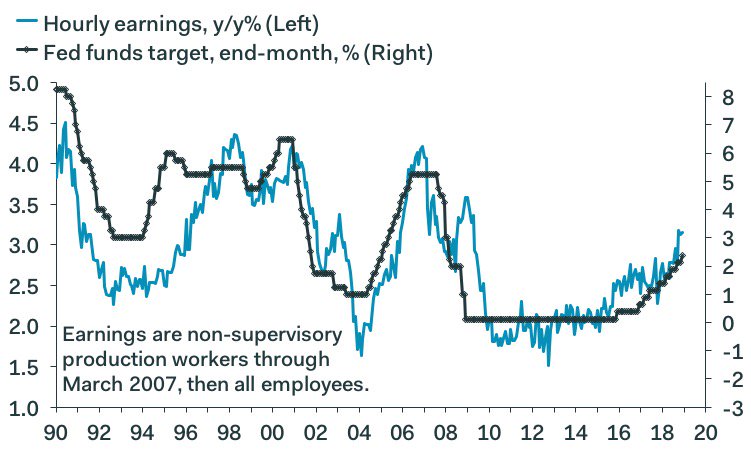
For some further context on the entrenched model-based culture at the Fed, here is the historical relationship between the growth in Average Hourly Earnings and the Fed Funds Rate. Regardless of the debate on the effectiveness of the Phillips Curve, it is not dead in the eyes of policy makers.
Bottom line, there is a Powell Put, but it is unclear where the strike price is. A strictly model-driven Fed could turn out to be a lot more hawkish than the market thinks, especially in light of the blowout December jobs report.
Two scenarios
In conclusion, the roots of the current pullback is one of the most ambiguous that I encountered during my career. I expect market in H1 2019 to be sloppy as it resolves these uncertainties. Conventional technical analysis suggests that the stock market is undergoing a bottoming process. Long-term sentiment is showing signs of capitulation, and insiders are buying. If history is any guide, the market should make an initial bottom in January, following by a rally and several months of choppiness, followed by a re-test of the previous lows. The re-test, which is expected to occur within a 2-6 month time frame, would be the final bear market bottom. The template to follow are past market panics, where stock prices fell but the economy did not fall into recession.

On the other hand, should a trade war erupt, or if an overly hawkish Fed pushes the economy into recession, all bets are off. The template might be the 2001-2002 market, where the market made an initial panic low in the aftermath of the 9/11 attack, rallied, and chopped around, only to decline into an ultimate double bottom a little over a year later.

In both cases, expect the market to be choppy in the next few months.
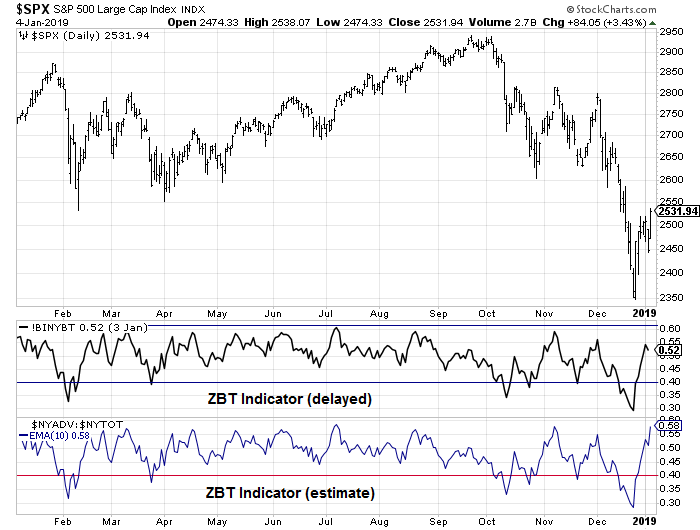
The week ahead: Can the breadth thrust carry the day?
When the stock market surged on the combination of the Job Report and dovish Powell comments, a lot of technicians got excited because of the breadth surge that exceeded the 9:1 ratio. This is consistent with a possible Zweig Breadth Thrust. The market became deeply oversold during the decline that ended December 24, 2018. Day 1 of the ZBT count began on December 27, and the market has 10 trading days, which would end next Thursday January 10, 2019 to flash a ZBT buy signal.
The bulls can also point to an unconfirmed breakout of a cup and handle formation on the hourly chart, with an upside target of about 2700.

There are different ways of interpreting the current conditions. SentimenTrader observed that the historical records shows that such breadth thrusts tend to resolve bullishly over the next three months. While such a development is intermediate term bullish, he was silent on what happens in the interim.

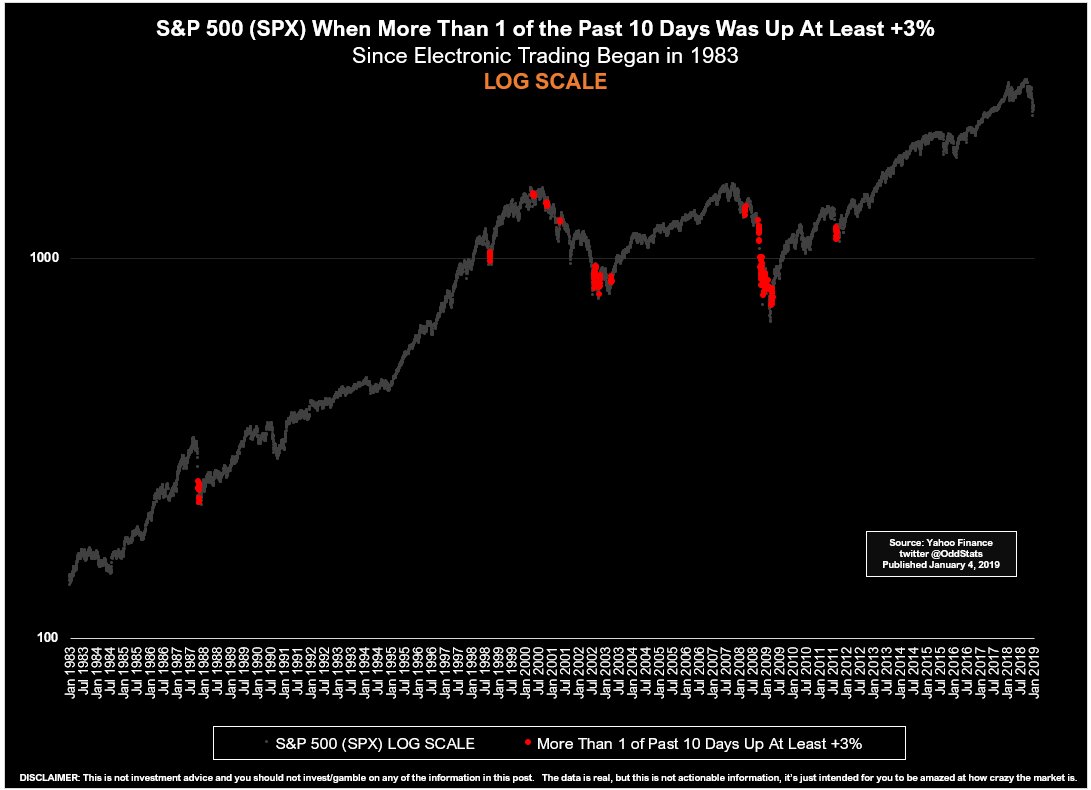
On the other hand, a historical study from OddStats documented what happened when the SPX rose 3% or more within a 10 day period. The results are not very encouraging.

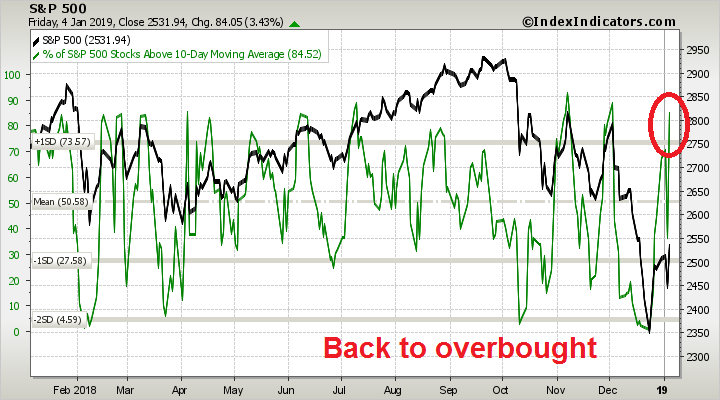
As expected with breadth thrusts, the market is back to an overbought reading.
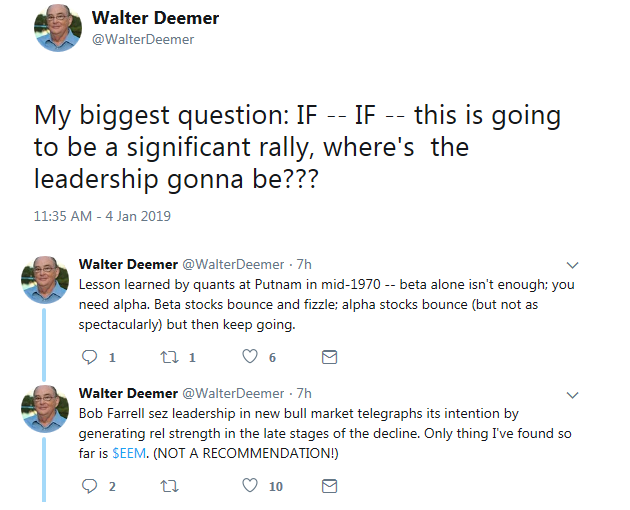
Technical analyst Wally Deemer also cast doubt on the sustainability of the rally based on a lack of leadership.
My inner investor remains bearish. My inner trader took profits on his long positions last Wednesday, and Friday`s bullish reversal has him very near his stop loss levels. Despite the breadth thrust exhibited by the market, he is watching to see if there is any bullish follow through before covering his shorts.An interim bottom is at hand, but it remains to be seen if we have seen the final low yet.
Disclosure: Long SPXU
Thank you for this post of factors and scenarious to consider and their impications. Seems like there is so much uncertainty, that in the past was discounted by the markets , but now is being paid more attention to, complacency levels still high.
Is the least risky option for China is to continue making progress in talks wit US, but kick any deal down the road until after the National Peoples Congress?
What do you mean by progress? The intent of the US side is to get a deal done by the March deadline. The Chinese can offer what they want or can, but if it’s not accepted there is no deal. It takes two to tango.
Forgive my brashness but I believe I have a valid perspective on what’s happening and where markets are going. Hopefully, it will help.
Spoiler alert, I’ve turned bullish. Read on for reasoning.
I have been doing original research on stock market cycles for many years, I’ve missed every bear market for my clients since the mid-1980’s.
I just missed another. At the beginning of the fourth quarter I posted on this blog these comments;
October 7, 2018 at 4:14 pm
I believe we are in a similar market environment like 2015. There we had a deep recession and bear markets in their companies’ stocks in the energy and commodity producing industries accompanied by bear markets in ever country outside the US. Although the S&P 500 and NASDAQ didn’t fall the required 20% it was a rough ride. There was a deep, surprise dive in August 2015 and markets bottomed in early 2016 when commodity prices started to recover.
Similar to 2015, we have international markets heading for or already in bear markets.
I don’t know whether the S&P 500 will decline the 20% for an official bear market but I believe rough times are ahead NOW, not in 2019. Rough enough that people will look back and wished they’d have missed it.
Ken says:
October 21, 2018 at 4:27 pm
I came to a turning point this week in my approach to the investment world that will guide me for the next few years. I believe this new strategy will make me the best performing portfolio manager in the world. A tall order, but if I miss my goal somewhat, my clients will still do great.
————————————————————
In Cam’s last newsletter Josh Brown in a video commented on people saying they called the decline. When I capitalized NOW in my post I was very emphatic.
My saying I would become the best performing portfolio manager in the world is starting to happen. My Model Growth Portfolio (a real live discretionary portfolio client that I measure) had a zero percent rate of return to the second decimal place in December when the S&P 500 went down 9.0% (total return). To be flat during the worst performing December since 1931 was such a relief. For all the fourth quarter, it was down 3.0% while the market was down 13.5% (total return). That’s a good jump on the competition already.
What now? I started on December 24 to shift from super underweight equities to now normal weight. My research says we may have just completed something rare, a Anti-Beta Factor Crash Bear Market. That is a fancy quant term for a bubble market popping. This type of bear market doesn’t need a recession. The absence of a recession any time soon is what fooled most investors this time.
This is like 1987, when we had a bear market with a strong economy and strong earnings growth (50% YOY then). After the 87 Crash, markets went up for two years.
In December, we hit EXTREMELY panicky sentiment levels. Many sentiment indicators were at all-time lows. The CITI Panic Indicator (great indicator) just gave a buy signal. Here’s a link to it.
https://safehaven.com/investing/stocks/Is-It-Time-To-Buy-The-Stock-Market-Dip.html
Merrill Lynch just issued a buy on the market based a large part on sentiment in their model.
It’s not just sentiment that has turned around and believe me, my own views have changed so quickly here that my head is spinning. The interest rate outlook that was my bearish case for the weakness in the housing and auto industries to spread to the economy has changed 180 degrees. I rank the ETF sectors every weekend from the last sentiment low (Dec 24 now) and lo and behold the Homebuilders ETF is leading! That makes perfect sense because it was crashing due to higher mortgage rates which are now going DOWN.
When things change, I change.
The other factor that is positive is the Chinese market. It has started a bull market with all of my big picture factors in place, Value, Sentiment and Government stimulus. I see mining stocks are also leaders. This happens when China awakens.
I believe Apple’s China sales problems are consumer nationalism hurting US brands not Chinese consumer weakness. Watch when Huawei announces their phone sales for the same quarter and they don’t fall like Apple’s. That will show what’s really happening.
So I’m bullish but a chicken bull. I’m using moving average lines as an objective stop loss discipline.
In 1987, the Anti-Beta Crash did not lead to a recession but in 2000, the Dot.com Beta Crash morphed into an economic downturn. This one could too. David Rosenberg, a great economist, says the economy will have a sharp fall over the next quarter or two.
If the Anti-Beta Crash Bear turns into a normal Recession Bear, we will have another leg down.
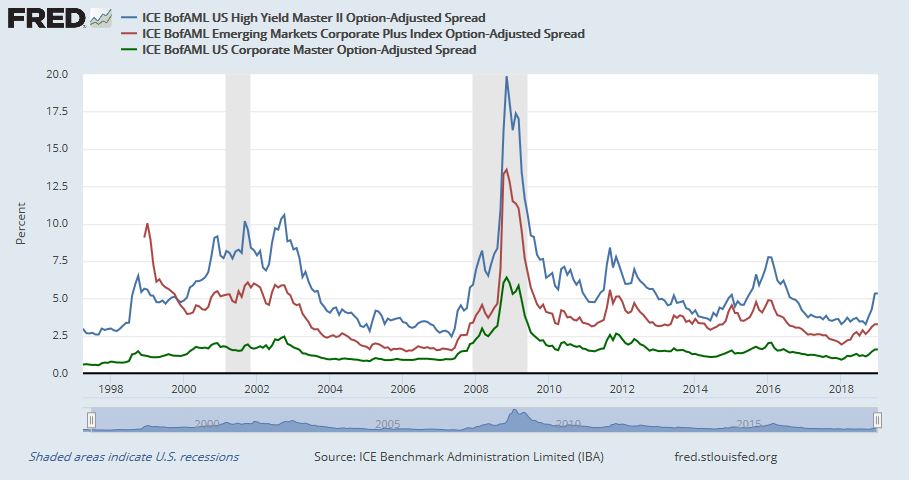
I’m watching the high yield spreads to detect stress levels in the economy. If spreads fall, I’ll get overweight stocks. I listen to Rosenberg and other economic indicators. The Economic Surprise Indicator mentioned in the newsletter above hit a low in early 2016 on the chart when the market hit its low. So it’s current action is good for low happening now, not a negative. It’s all part of an investor sentiment low.
Over the next few quarters, I’m not trying to outperform markets by targeting highly volatile investments in specific industries. I accept that it’s truly impossible to say what’s going to happen with any industry with all the conflicting forces in the business and political world today. I’ll simply try to get a decent rate of return with mainly, general, vanilla things as stocks recover as I expect from panic selling lows.
Most appreciated. Thanks Ken.
Good stuff Ken! Thanks for sharing.
Thanks very much, Ken!
Here’s the current chart of 2020 and 2019 Fed Funds Futures. It’s likely one of the most incredibly, surprising charts I’ve ever seen. It must effect one’s outlook for rates.
The 2020 expected rate has fallen from 2.9% to 2% in a couple of months when everyone is worried about how strong the economy is with low unemployment, strong consumer sentiment etc. etc. Here it is;
https://product.datastream.com/dscharting/gateway.aspx?guid=b7ec9234-f31b-4931-89e1-1040262ad80a&action=REFRESH
Excellent analysis and perspective as usual. Cam, on the homepage you show 2 performance type graphs. One is the ‘Trade Signal’ graph. The other is a graph of your ‘Long term track record for the SPX’, with up and down arrows. Does this graph and arrows reflect signals generated from your Trend Signal, or something else? Thanks.
That graph represents mainly the Trend Model, spiced by my top-down macro interpretations. I would say it’s 70-80% technical (trend model) and 20-30% fundamental.
Cam, when the trend model changes do you send out a notice to subscribers on the day as you do with the trade model?
People mention bear traps and bull traps, but is this a hindsight observation? Are there any indicators/signatures that hint when one is forming? If things stay up today we may get that ZBT
Extreme up volume thrusts (yellow) are generally bullish events (60% profitable, 15 trades 2007 to present). But they are also rare and limited resources which are of limited force as price approach resistance (previous support). Plot on the bottom panel shows moving average of $UVOL ratio and it shows that the breadth thrusts may be approaching an overbought area. So any buy entries here may be limited to gains from this point to the previous support area (DOW 24,200 which is also about the 60% Fibonacci retracement).
https://imgur.com/6Jm94Qd
In Oct of 2015, we had a very nice second breadth thrust (plotted as yellow cross) that propelled the markets for a month (10/5/15 to 11/3/15). It is difficult to tell how far a breadth thrust can take you but you can take the relative strengths of NYSE issues above and below 200D MA as a guide, but since that relative strengths plot is so flat, it is likely that the markets will be choppy going forward.
https://imgur.com/lEzAEz0
Alright, count me bullish short term. After getting stopped out last Friday morning of my short position and staying neutral until today’s closing, I am seeing a back to back Up Volume ratio of 0.76 or more for consecutive days. The last time that happened? It was around the July 2018 lows (7/6/2018), and the market never looked back until Oct 3, 2018. Not suggesting there will be a 3 month rally, but short term bullish.