Mid-week market update: The Zweig Breadth Thrust buy signal occurred a little two weeks ago. For those who jump onto the bullish bandwagon, it has been an exhilarating ride. This week, the inevitable pullback has arrived. The SPX breached a key uptrend on the hourly chart yesterday (Tuesday), and it could not hold the morning good news rally induced by the positive earnings reports from Comcast, IBM, and United Technologies.

How far can this pullback run?
The bear case
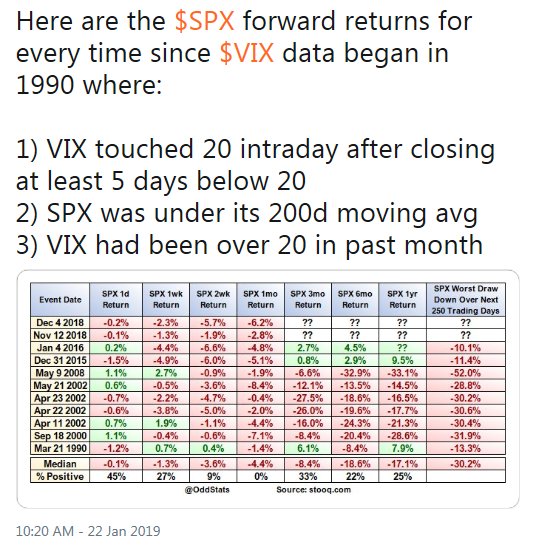
There is a case to be made for a deeper correction, perhaps all the way to test the December lows. OddStats posted some bear porn, based on the historical behavior of the VIX. The forward returns look downright ugly.
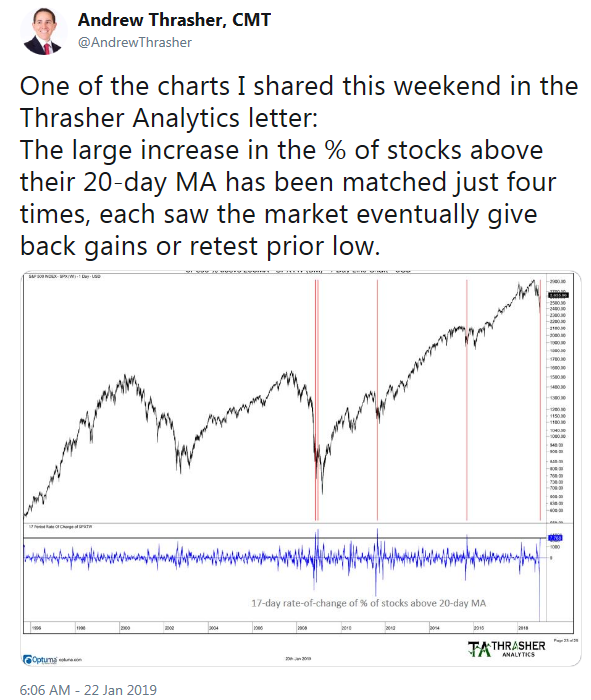
Andrew Thrasher also made the case for a re-test of the December lows, based on the extreme overbought condition flashed by the % of stocks above their 20 dma.
A “good overbought” condition?
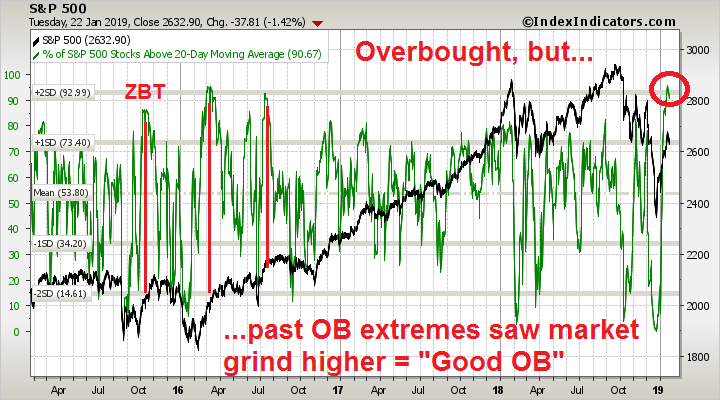
On the other hand, a market doesn’t go down just because it is overbought. The stock market has historically experienced “good overbought” conditions when it continued to grind upwards.
This chart of stocks above their net 20-day highs-lows shows the market recently reached an off-the-charts overbought extreme. Further examination of the historical experience shows that similar past episodes has seen prices rise further before topping out. The ZBT signal of 2015 was one such example.
Market internals unhelpful
If the market were to blast off to new highs or weaken to re-test the old lows, we should see some evidence from market internals. However, many of the internals are flashing ambiguous signals.
As an example, this chart of market cap and group relative performance is unhelpful to determining leadership. Mid and small cap stocks remain in relative downtrends and cannot be considered market leaders. NASDAQ stocks, which had been the high beta leaders, remain mired in a relative trading range.

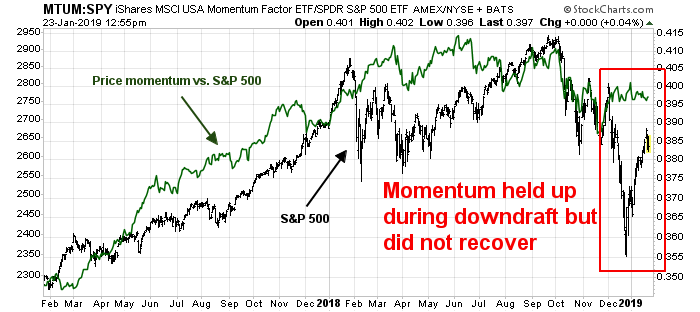
The behavior of price momentum is equally puzzling. While it is constructive that price momentum did not break down during December downdraft, but they did not recover and lead the market as prices rebounded.
Mixed sentiment
Sentiment models are also flashing mixed signals. On one hand, Callum Thomas has been conducting a weekly (unscientific) Twitter poll, and sentiment remains bearish despite the powerful stock market rebound since the December 24 bottom, These readings should be seen as contrarian bullish, and as a sign that the market is climbing the proverbial wall of worry.

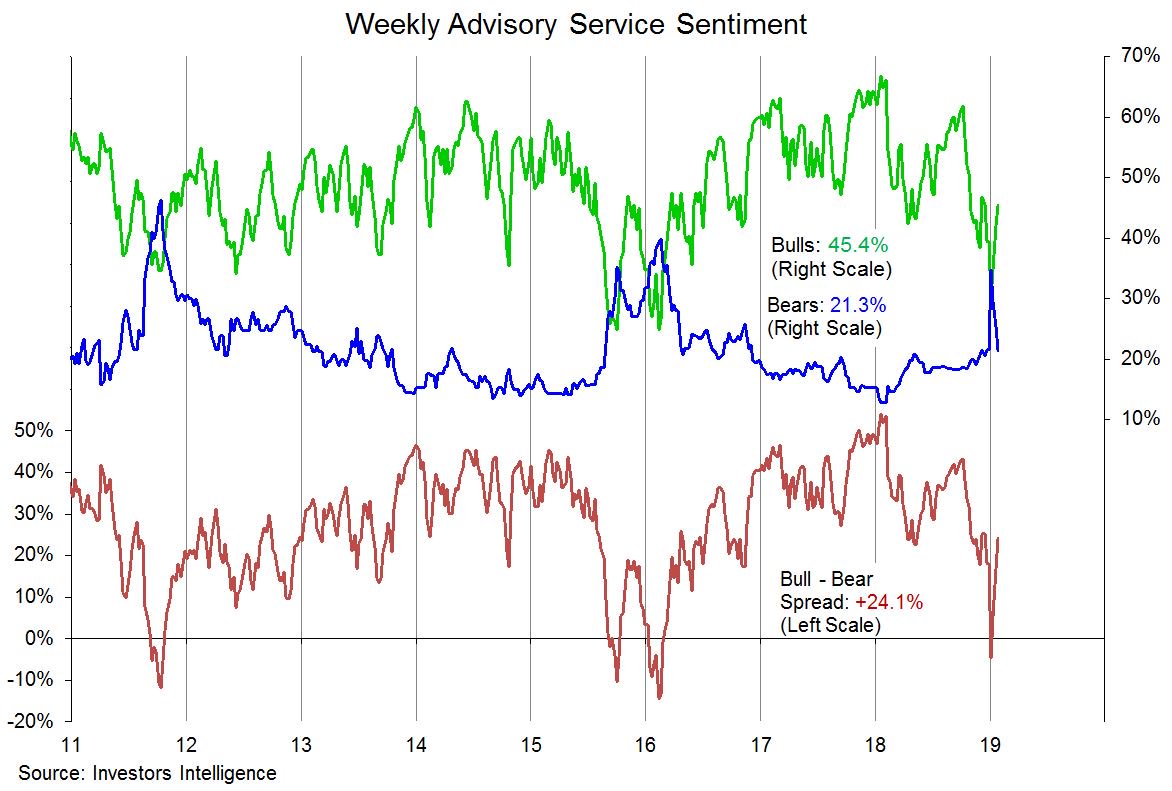
On the other hand, the latest Investors Intelligence poll shows that the spike in bearish sentiment has normalized after the December panic. I would interpret this as long-term complacency and contrarian bearish.
A re-test, but not yet
Trading the market with these cross-currents can be treacherous. Moreover, the market has been moving on fundamental and macro news, which are inherently unpredictable. Under these circumstances, technical analysis is likely to have diminished importance.
However, sentiment analysis does give us some clues, and my working hypothesis is the market is likely to see a re-test of its December lows, but not yet. Short-term sentiment such as the Callum Thomas Twitter poll is too bearish and likely a signal that the market is climbing a wall of worry. As well, the strong price momentum displayed by the ZBT suggests that the market is likely to see further near-term upside. On the other hand, long-term sentiment from the II survey indicates complacency, and points to a re-test of the December lows in the next few months.
Tactically, the SPX is pulling back after a two-week rally, and initial support is at the current levels coinciding with the 50 dma and 61.8% Fibonacci retracement. Further support can be found at the 50% retracement of about 2580.
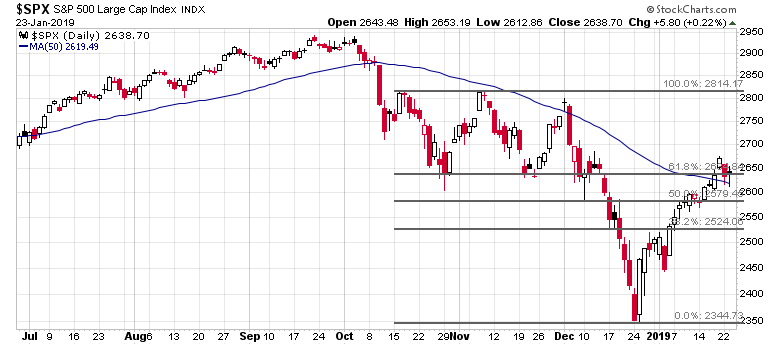
My inner trader is still bullish. He is opportunistically adding to his long positions at current levels, He plans to add more should the index decline to 2580, with a tight stop set just below that level.
Disclosure: Long SPXL
Let us separate the table from “odd stats” into three.
First is a cluster around year 2000-03 bear market, second in 2008 (another major bear) and third is 2015-18.
The numbers in the 2015-18 cluster show a 1 month draw down of 5% and a maximum draw down of 10% give or take.
Let us use 2600 as the start of a 5-10 % draw down (in the next 250 days). That gives us a range, that takes us to a retest of December lows.
I am ignoring the other two clusters as the 2015-18 cluster is the most proximate cluster.
Impossible to trade at this juncture. TA produces no true signal because there is no conviction. So maybe we can have some items to speculate on market direction :
1. No leadership: no advance.
2. Central Banks balance sheet reduction: market retreat.
3. Global composite PMI decline: market retreat.
4. VIX at high readings: market retreat.
There are a lot more negatives than positives. The only positive thing we have now is fast money doing extrapolation. Since there is no conviction, things can sputter at any moment.
Agree with you. Add one more to the list:
US Fed raises (or does not lower) rates: Negative.
QE 4: Back up the truck and buy.