Preface: Explaining our market timing models
We maintain several market timing models, each with differing time horizons. The “Ultimate Market Timing Model” is a long-term market timing model based on the research outlined in our post, Building the ultimate market timing model. This model tends to generate only a handful of signals each decade.
The Trend Model is an asset allocation model which applies trend following principles based on the inputs of global stock and commodity price. This model has a shorter time horizon and tends to turn over about 4-6 times a year. In essence, it seeks to answer the question, “Is the trend in the global economy expansion (bullish) or contraction (bearish)?”
My inner trader uses a trading model, which is a blend of price momentum (is the Trend Model becoming more bullish, or bearish?) and overbought/oversold extremes (don’t buy if the trend is overbought, and vice versa). Subscribers receive real-time alerts of model changes, and a hypothetical trading record of the those email alerts are updated weekly here. The hypothetical trading record of the trading model of the real-time alerts that began in March 2016 is shown below.

The latest signals of each model are as follows:
- Ultimate market timing model: Sell equities
- Trend Model signal: Bearish
- Trading model: Bullish
Update schedule: I generally update model readings on my site on weekends and tweet mid-week observations at @humblestudent. Subscribers receive real-time alerts of trading model changes, and a hypothetical trading record of the those email alerts is shown here.
What is the market discounting?
The velocity and ferociousness of the recent US equity market weakness caught even bears like me by surprise. My social media feed has been filled with extreme bearishness. Opinions are now becoming bifurcated. Either the decline is the signal of something big, or the fall in stock prices represent a buying opportunity for fundamentally oriented investors.
It is impossible to make a buy, hold, or sell decision without some understanding of what the market is discounting. In other words, what bet are you making if you decide to buy or sell stocks here?
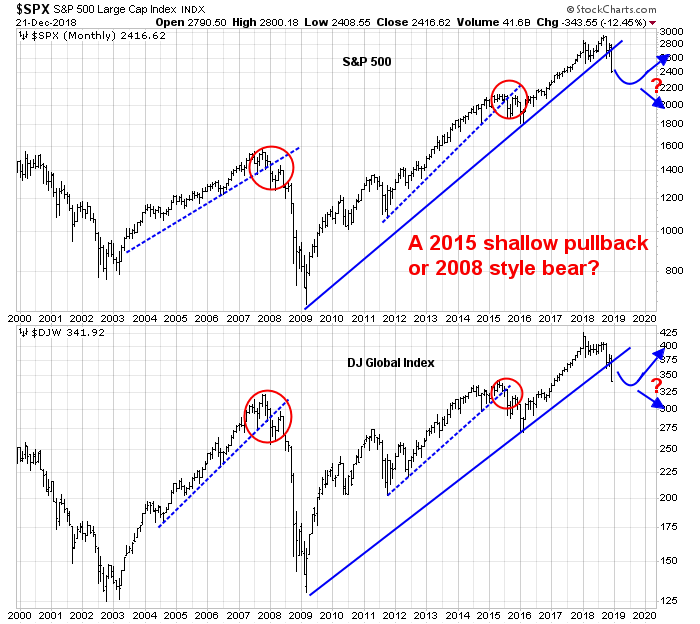
Further analysis reveals that investors are discounting only a mild US slowdown in 1H 2019, but no recession. From a technical perspective, both the US and global markets have violated well-defined uptrend lines, just as they did in 2015 and 2007. It remains an open question as to whether the trend line breakdowns will result in just a mild pullback, or a deeper bear market. (Please note that the curves and arrows drawn on the charts are only stylized, and do not represent technical projections or targets).
A slowdown ahead
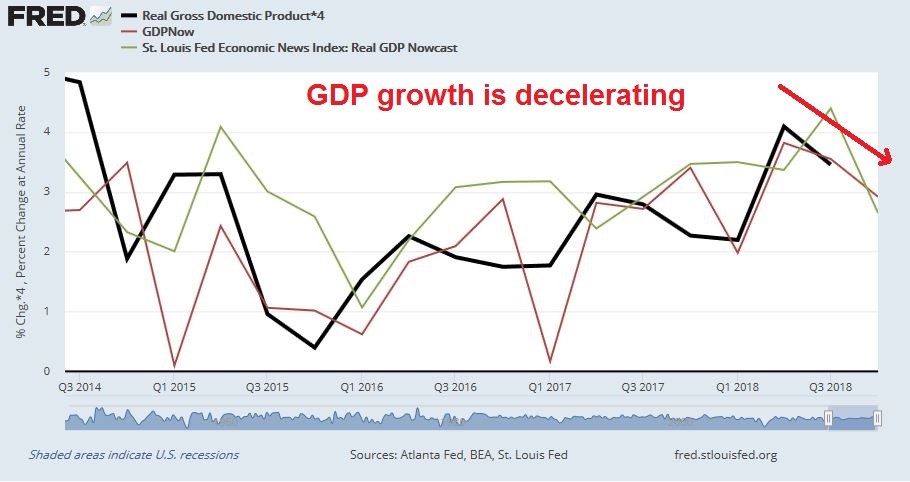
There are plenty of signs that growth is decelerating, which both Ed Yardeni and Urban Carmel were prescient enough to warn about. My set of long leading indicators, which are designed to spot recessions a year in advance, began to deteriorate last summer and now stands at a near-recession reading. The deteriorating is becoming evident in growth expectations, as GDP growth is expected to slow from the torrid 3-4% annualized rate to about a 2% pace in 2019.
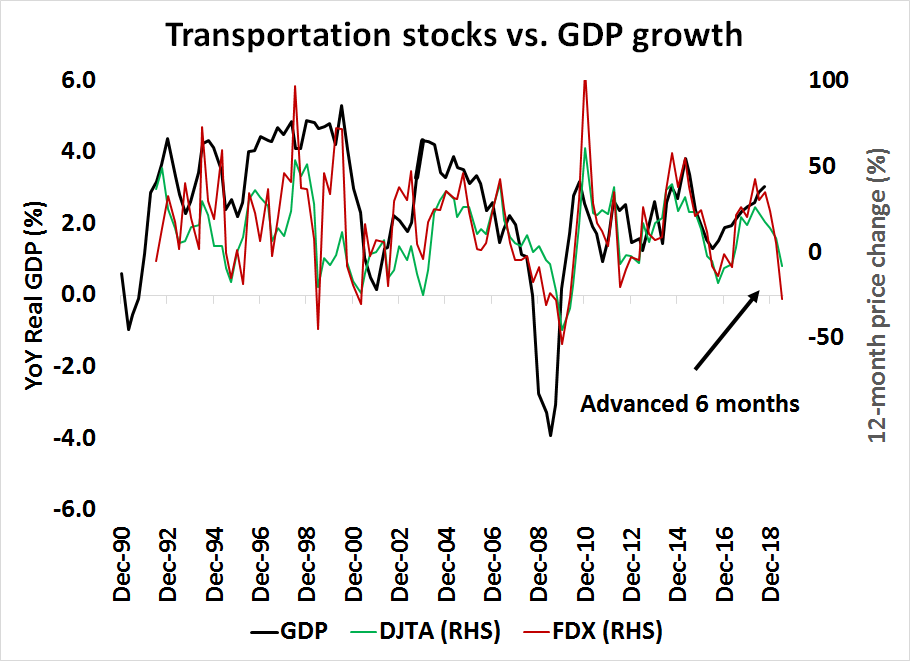
The transportation sector is a highly cyclical sector and represents a short leading indicator of economic growth. The recent FedEx (FDX) earnings report was disturbing, as the company stated “global growth has slowed but we are very surprised by the magnitude of the headwind, which is what might be seen in a severe recession”. The price performance of FDX and the DJ Transports has historically led GDP growth by roughly six months, and they are pointing to a sharp deceleration in economic growth. However, I would not characterize the decline to be severe enough to declare a recession (yet).
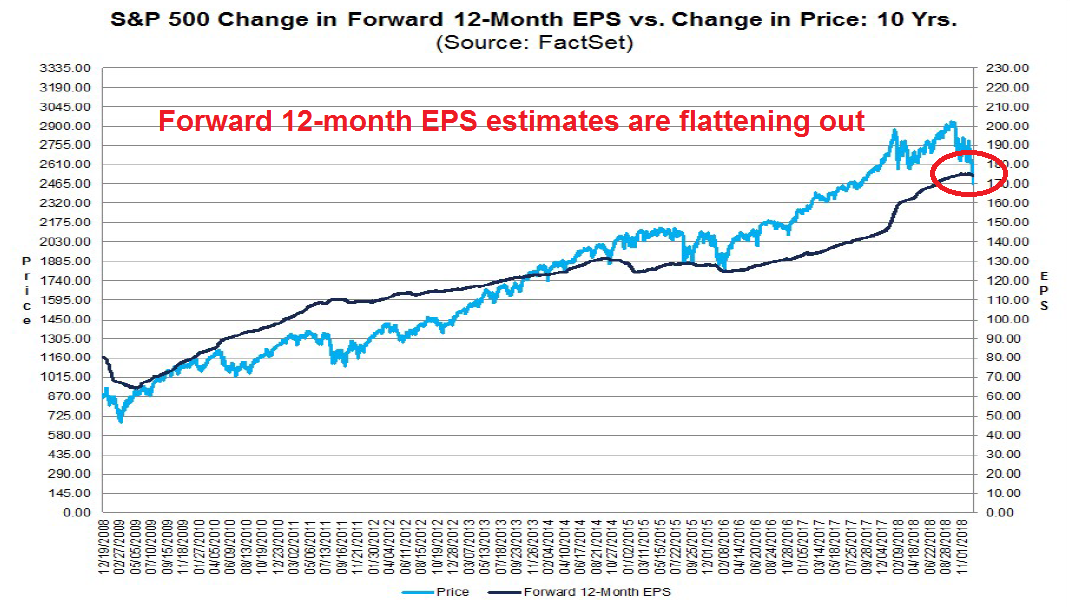
In addition, the latest update from FactSet shows forward EPS estimate revisions have been flattening, which is another indication of diminished growth expectations from Wall Street.
No recession expected
How has the market responded to these signals? The latest BAML Fund Manager Survey was highly revealing. Institutional managers overwhelming rejected the idea of a global recession in 2019 (top panel), but expected growth to decelerate (bottom panel). In other words, they only expect a slowdown.

What are they doing with their equity allocation? Last week, I highlighted analysis from Kevin Muir of The Macro Tourist, who believed that managers were in a crowded long in USD assets, including equities. As US growth slows in early 2019, managers will begin to normalize their overweight position in US equities. That is precisely what is the Fund Manager Survey is telling us. Instead, managers are re-allocating their weights to the high beta EM equities, which is consistent with the view that the world would avoid a 2019 recession.
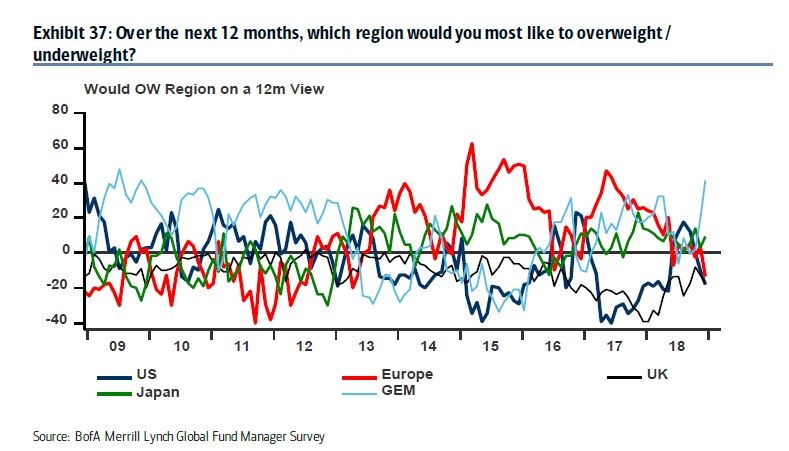
The relative performance of US, EAFE, or developed non-US markets, and EM equities relative to the MSCI All-Country World Index (ACWI) tells the same story. US stocks have been range bound on a relative basis since August and they have begun to break down only recently. Instead, EM equities are gaining relative strength.
In other words, both the survey data and real-time performance data reflect the view that the market expects a US growth deceleration, but no global recession. Otherwise investors would not be buying the high-beta and high risk EM sectors, no matter how beaten up and cheap they seem.

The financial cycle vs. business cycle
One key risk to the outlook comes from a deteriorating financial cycle. A recent BIS paper, “The Financial Cycle and Recession Risk”, made a distinction between the business cycle, whose analysis is well captured using my long leading indicators, and the financial cycle.
Financial cycle booms can end in crises and, even if they do not, they tend to weaken growth. Given their slow build-up, do they convey information about recession risk? We compare the predictive performance of different financial cycle proxies with that of the term spread – a popular recession indicator. In contrast to much of the literature, our analysis covers a large sample of advanced and emerging market economies. We find that, in general, financial cycle measures provide valuable information and tend to outperform the term spread.
One of the best real-time indicators of the financial cycle is the relative market performance of bank stocks. Past technical breakdowns of bank stocks have signaled periods of financial stress, and the relative performance of regional banks (bottom panel) have shown to be an even more sensitive barometer. Bank stocks recently violated a key relative support line, which is an indication that the financial cycle is turning down.
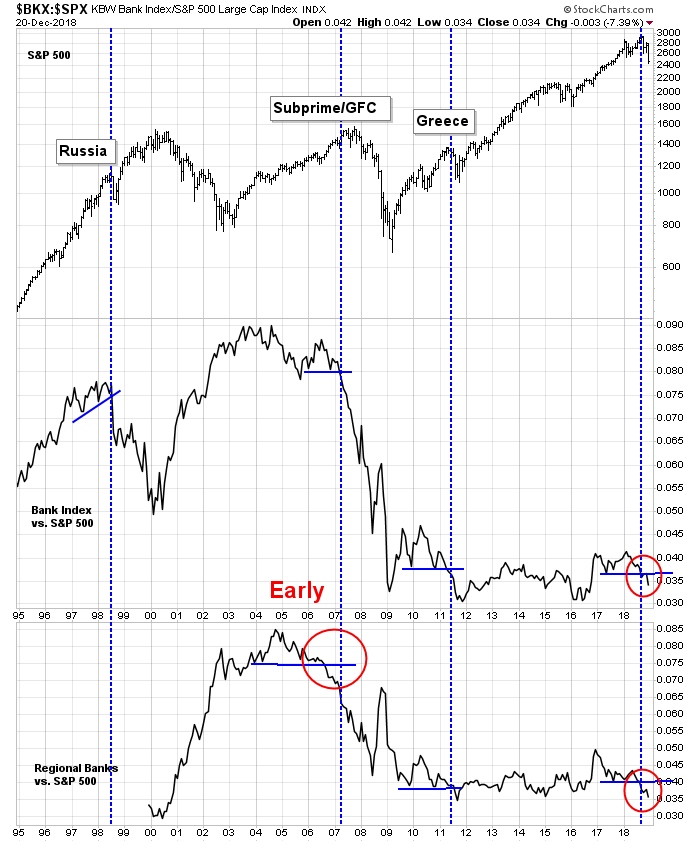
As an aside, consistent with the analysis from the BIS paper, the bear market and recession that began in 2000 was not the result of financial stress, but a Tech Bubble that was not largely financed with debt. If punters had bought NASDAQ stocks on margin, the resulting downturn would have been far worse.
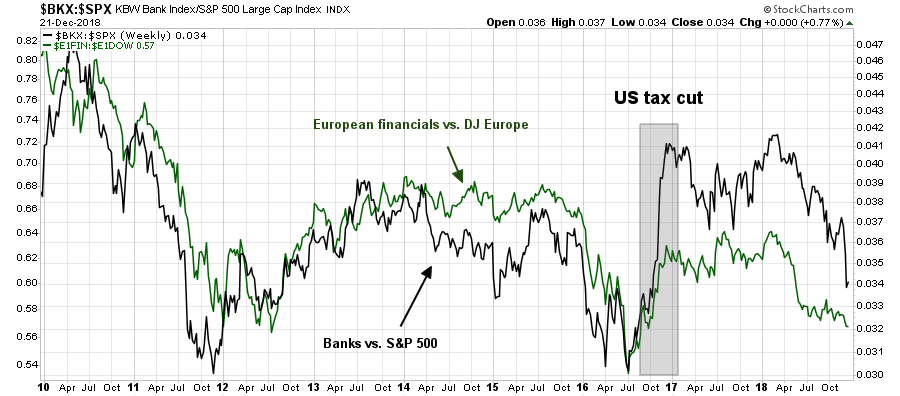
The usefulness of the relative performance of US bank stocks is their correlation of the relative performance of European banks. The relative performance effect appears to be global, with the exception of selected localized events such as the recent US tax cut effect on financials. This is an indication that bank stocks are capturing the global financial cycle.
Where are the stresses in the financial system? They don’t seem to be emanating from the US. Financial conditions have deteriorated, but they don’t appear to be out of control.
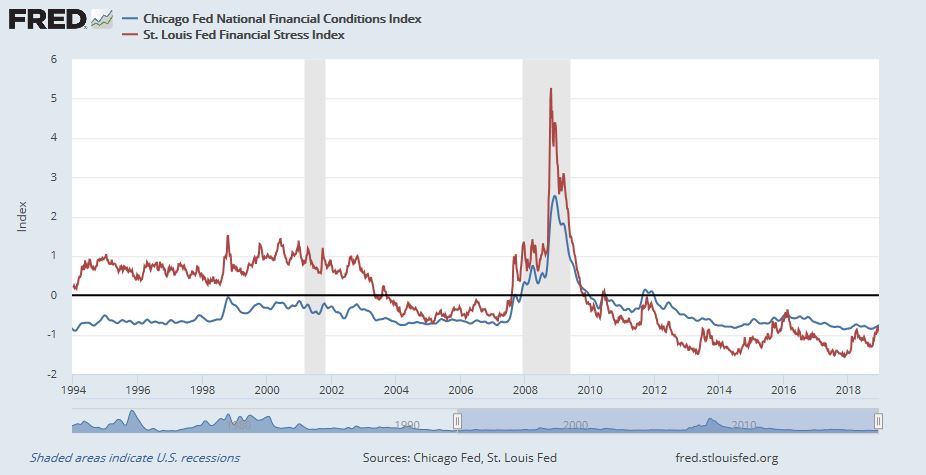
Yield spreads have widened, but readings are not levels seen before the last recessions.

In this cycle, the financial risk originate outside the US. For one, Europe never fixed its banking leverage problems from its last cycle.

John Authers at Bloomberg recently cited USD liquidity as a possible problem for eurozone banks:
Meanwhile, the agonies for banks in the euro zone grow ever worse. The new reason for their problems, which have happened even though the European Central Bank, unlike the Fed, is still engaged in QE, seems to be a shortage of dollars. This is partly because of the Fed, but also possibly in part because of another signature U.S. policy. The tax reform package passed a year ago provided for the repatriation of foreign U.S. corporate subsidiaries’ earnings. Previously, those earnings sat in the accounts of foreign banks, providing a supply of dollars. Now that the big and successful U.S. tech groups are no longer leaving large piles of cash in Europe, the problems for Europe’s over-bloated and inefficient banking system have grown much more acute
Indeed, offshore USD liquidity is tightening, and has the potential to put downward pressure on equity prices.

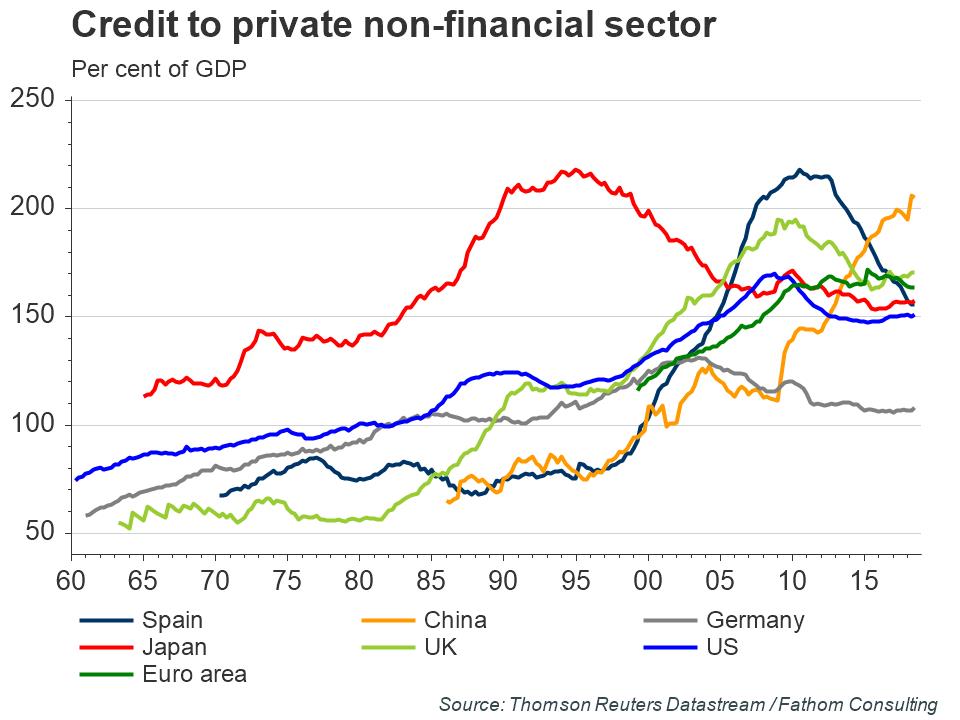
And who can forget the debt building in China.
The Chinese economy is already slowing. The SCMP reported that unemployment is rising as the trade war is starting to bite. This will handcuff China’s maneuvering room in its trade negotiations with the US as Beijing has historically put a heavy policy weight on employment and social stability.
Beijing is now officially worried about unemployment, as the US-China trade war continues to weigh on the world’s second largest economy.
On Wednesday, the State Council unveiled policies ranging from refunding unemployment insurance payments to companies that do not lay off staff to giving subsidies to jobless young people aged 16 to 24 rather than only to college graduates without jobs, according to a document on the government’s website.
The cabinet’s policy paper, which was drafted on November 16 but only made public this week, had already been passed down to local governments last month. The local governments were told to draft their own versions, taking account of local conditions, within 30 days.
Beijing has prioritised employment stability over other economic targets in various meetings, but the document offers the first sign of unease within the central government leadership over whether it can fight off unemployment pressure, as the trade war continues to reduce corporate hiring demand, particularly from export manufacturers.
Reuters report that China plans a stimulus package to support growth:
China will ratchet up support for the economy in 2019 by cutting taxes and keeping liquidity ample, the official Xinhua news agency said following an annual meeting of top leaders amid a trade dispute with the United States.
The government has launched a raft of measures, including reductions in reserve requirements for banks, tax cuts and more infrastructure spending, to ward off a sharp deceleration in the world’s second-largest economy. Further policy steps are expected.
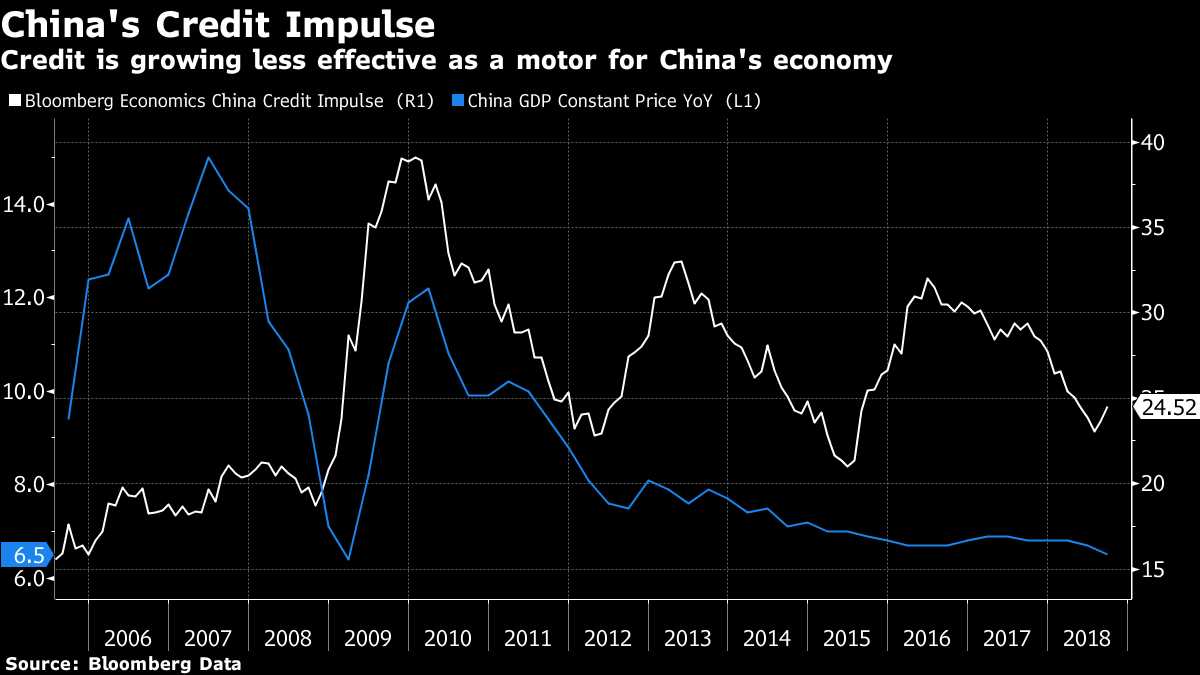
Another round of stimulus is unlikely to have similar effects as past packages. If the stimulus is purely fiscal in nature, investors are likely to be disappointed with the magnitude of the effect. If the stimulus is credit driven, John Authers pointed out that credit impulses are growing less and less effective as a way to boost growth.
Then there is the trade war. The most benign outcome would see Trump extract minor concessions from Beijing and declare victory. Another possible bullish scenario would involve Trump, under pressure from declining stock prices, continue to negotiate but delay the implementation of the next round of tariffs.
Regardless of how the trade dispute will be resolved in the near-term, trade frictions are unlikely to go away. Leland Miller of China Beige Book recently made the point on CNBC that there is a bipartisan consensus in Washington that trade with China is a big problem. Miller expects trade tensions to ramp up in the runup to the 2020 election, as both sides will try to position themselves as being “tough on China”.
Assessing the bull and bear cases
How will these risks resolve themselves? Unfortunately, my time machine is in the shop getting fixed and I don’t have a definitive answer.
Conventional macro business cycle models indicate that while recession risks are rising, but readings are not high enough to make a recession call for late 2019 or early 2020. I can therefore make the case that the American economy slows in 2019, but avoids a recession. In that case, the current market carnage represents a buying opportunity. New Deal democrat‘s long leading indicators have been bouncing around but readings are neutral, indicating no recession ahead. He warned against projecting the deterioration of model readings into the future to make a recession call:
The long leading indicators remained neutral again this week. The nowcast remained positive. The short-term forecast a weaker positive, Although there were no rating changes, stocks, commodities, the regional Fed new orders indexes, and the US dollar all turned less positive or more negative.
I want to add a note this week that I think people are getting ahead of themselves, projecting weak trends to weaken even further, and assuming that means recession. It has struck me this week how in many ways the current situation reminds me of year-end 1994. Alan Greenspan was aggressively raising rates in the face of non-existent inflation. Sentiment turned awful, and portions of the yield curve briefly inverted. And then … it didn’t happen. There was a big slowdown in 1995 followed by a big rebound. I’m not on recession watch now, and I won’t go on recession watch unless and until the broad range of data justifies it.
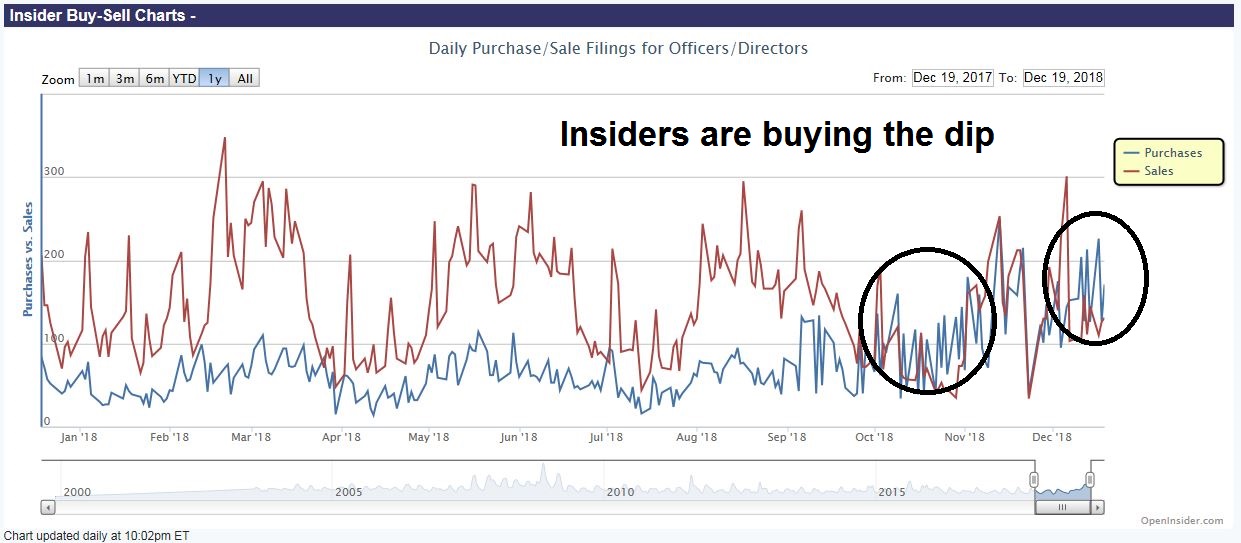
Indeed, the latest update from Open Insider shows that this group of “smart investors” are buying the dip.
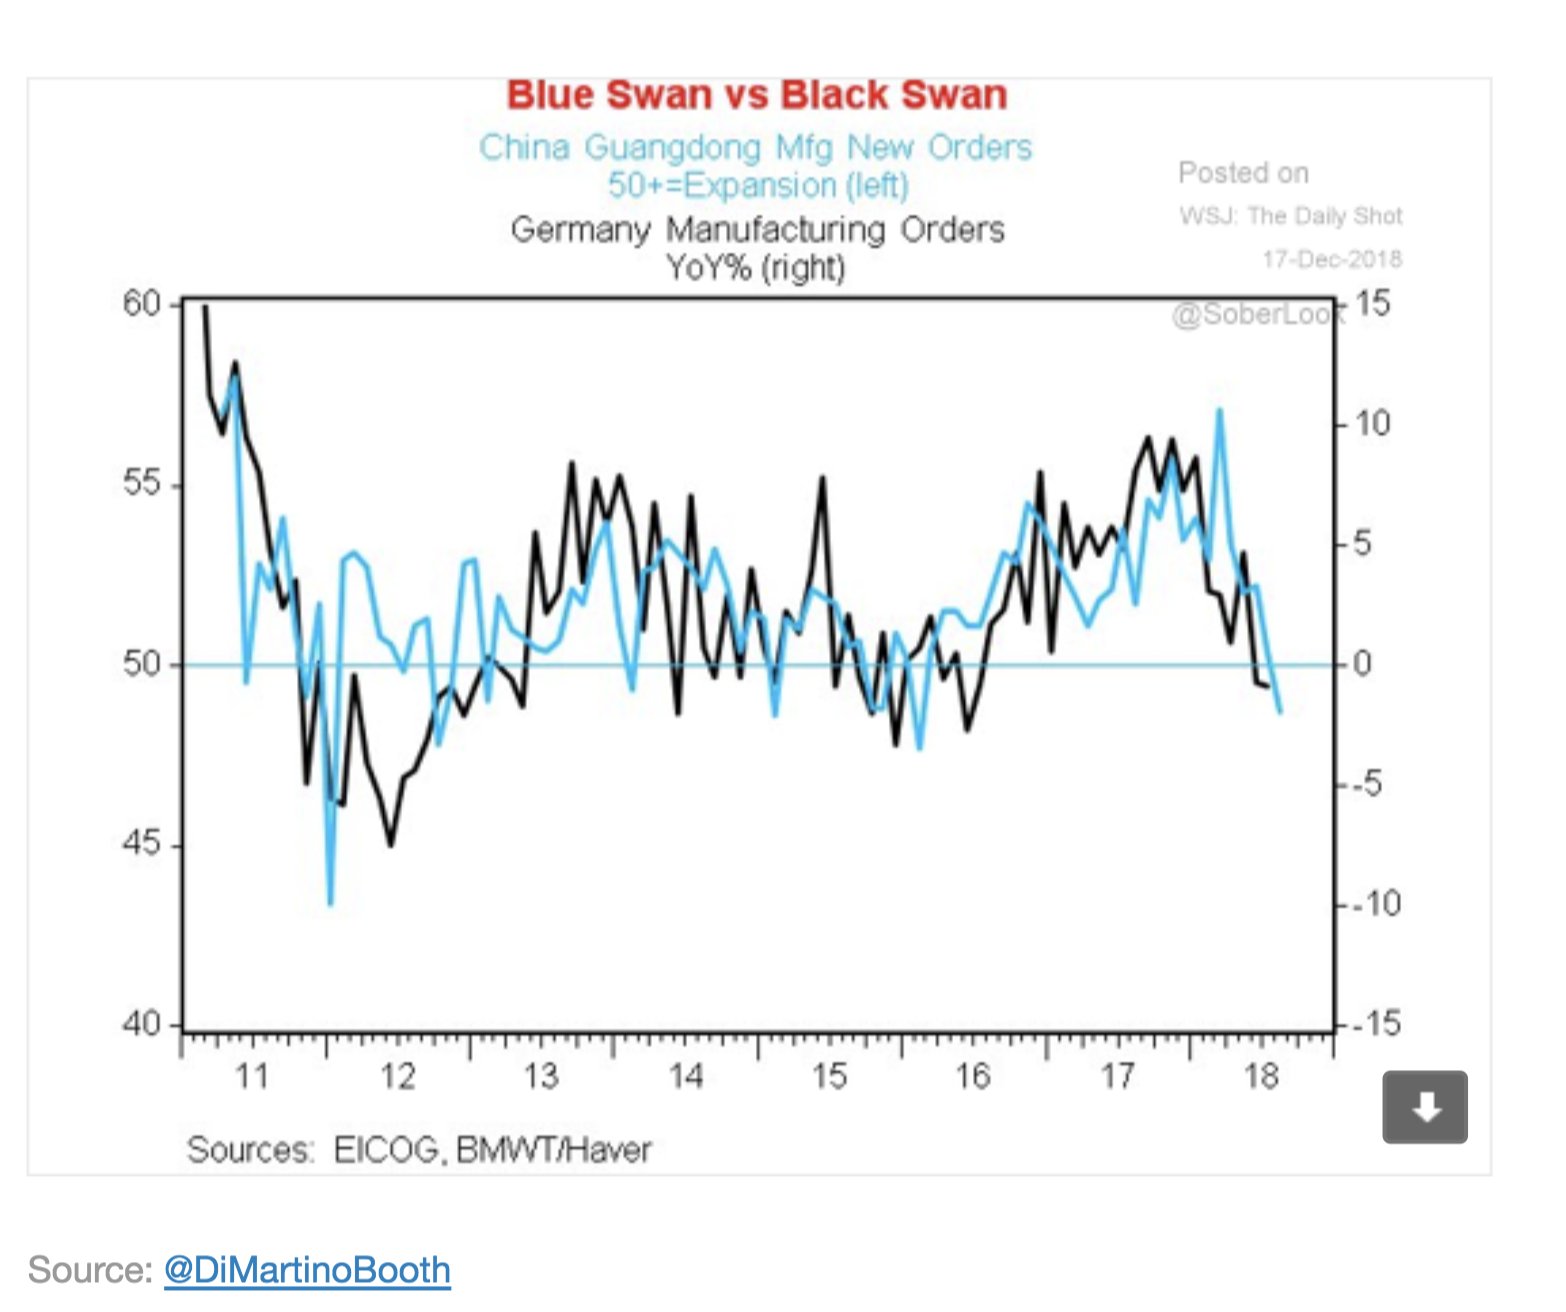
On the other hand, global recession risks are rising. While correlation is not causation, but German manufacturing and Chinese industrial activity. Further Chinese weakness could see financial contagion effects leak into the European banking system.
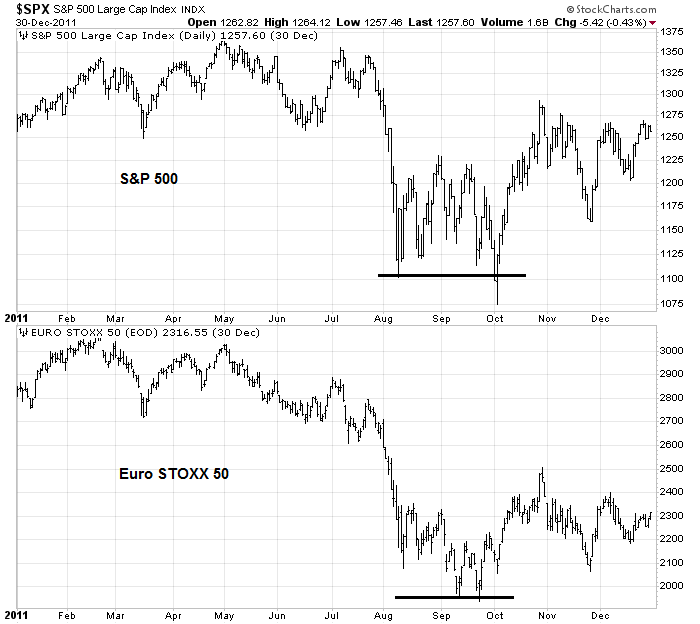
From a technical perspective, I would look for conditions when the market stops responding to bad news. One example can be found during the eurozone and Greek Crisis of 2011. During the summer of 2011, the eurozone was at risk of breaking apart, and European leaders were having almost weekly summits on how to solve the problem. At times, it seemed that Europe was leaderless, and no one was in charge. The crisis lifted after the ECB unveiled its LTRO program to backstop the banking system in order to buy time for member states to engage in structural reform. Some time during that process, the market stopped falling on bad news.
We have not arrived at that point yet. The market response to the FOMC decision shows that the market had unrealistically high expectations for Fed policy.
In addition, % Bears from the Investors Intelligence survey (blue line) edged up last week but remains stubbornly low. The latest survey was done early in the week, when the market was already tanking. Ideally, I would like to see % Bears exceed % Bulls as the sign of capitulation. The lack of a spike in II Bears is an indication that long-term sentiment is insufficiently washed-out for a long-term bottom.

My recommendation is to monitor the evolution of financial risk, as well as the evolution of investor psychology in order to determine the timing of a market bottom. My inner fundamental and macro analyst is keeping an open mind as to the possible outcomes. My inner technician believes that this is the first leg down of a deeper bear market.
The short-term outlook
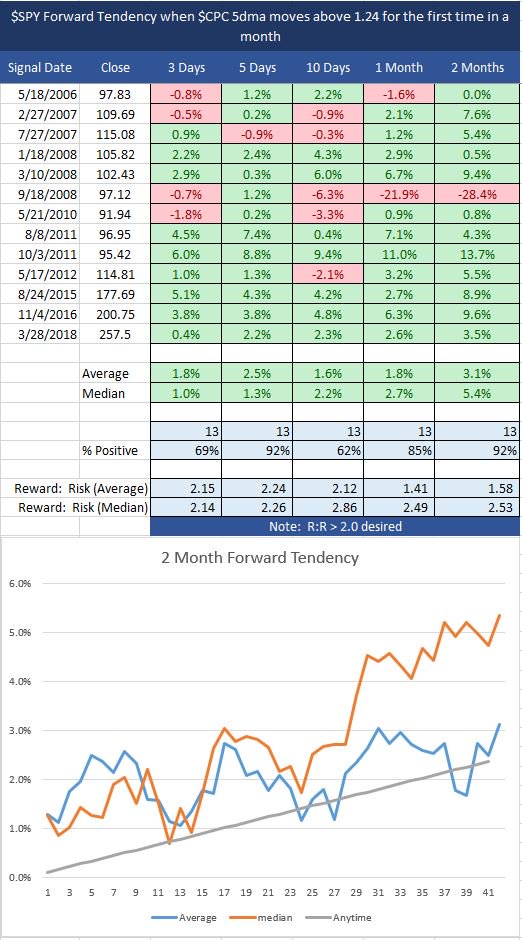
Looking ahead to the next few week, to say that the market is oversold is an understatement as readings are now at off-the-charts levels. The CBOE put/call ratio (CPC) reached 1.82 last Thursday, which is the highest level in its history since 1995. A historical study shows past SPY returns when CPC 5 dma crosses above 1.24 for 1st time in a month, n=13 since 1995. 92% closed higher within 5 days with average return of 2.5%.
The Zweig Breadth Thrust Indicator is also oversold, and readings are comparable to levels seen at the panic selloffs in 2008 and 2011.

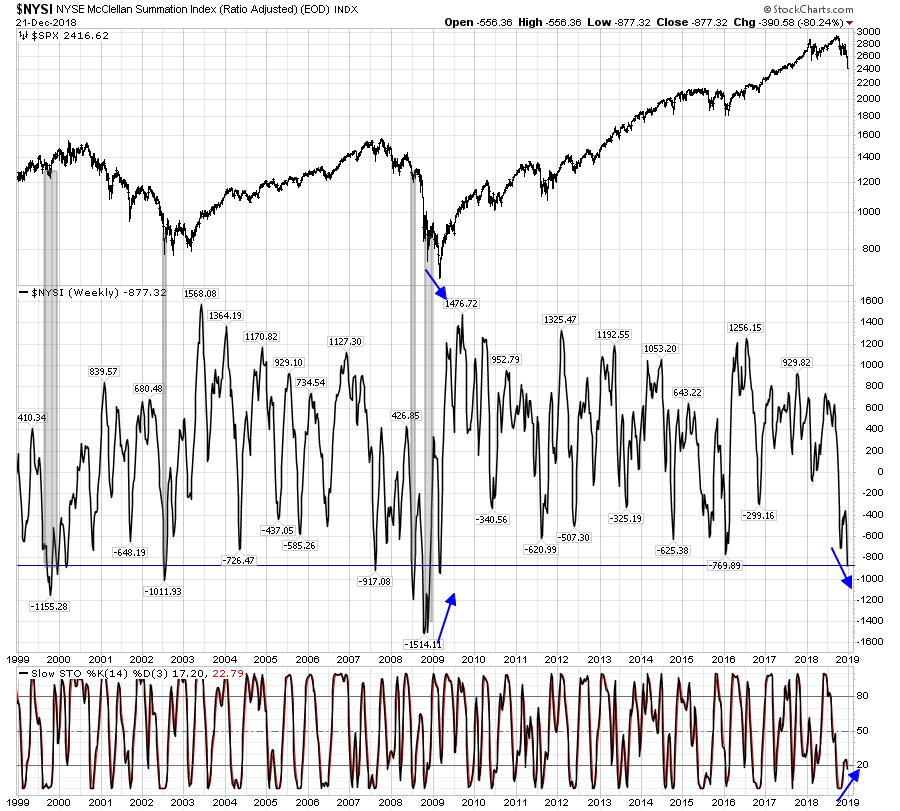
The NYSE McClellan Summation Index (NYSI) has reached the oversold levels seen at previous major bear markets. The good news is the positive divergence on stochastics (bottom panel).
The % Bullish indicator is also in blind panic territory.

One reader likened the panic as “hanging on a horse running in a burning barn”. The following observation from SentimenTrader is just one of many examples of this panic.
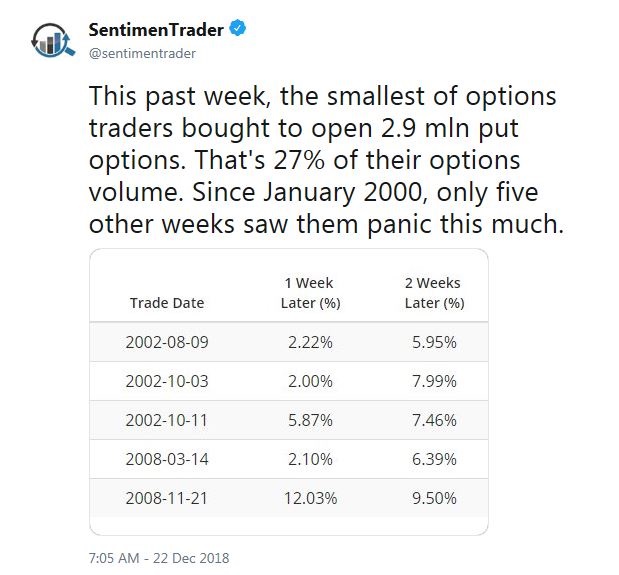
Conditions are more than ripe for a relief rally. That said, some caution is warranted. Urban Carmel pointed out that while the market has historically seen a bounce under similar conditions, but the market has re-tested the lows soon afterwards (see red arrows).

My inner investor interprets these conditions as the signs of an intermediate term bear market. He de-risked his portfolio in September and he is glad he missed the carnage.
My inner trader was caught long, and he is hanging on to play the bounce. When the rally comes, he is watching short-term breadth for an overbought condition to short into for the likely re-test of the previous lows. Volatility will be treacherous. Adjust your position sizes in accordance to your risk tolerance.

I have received a number of words of encouragement on the record of the trading model this year. The latest drawdown is a shock and disappointment. I will write a full analysis of the trading model in the near future.
Seasons Greetings and happy holidays to all.
Disclosure: Long SPXL
Where was the euphoria?
For quite a while there has been talk of a crash, and bubbles. Maybe this is because of increase connectivity via the internet, perhaps it is different this time.
But!
In the early 80s when gold was over 800$ an ounce, in Montreal people lined up outside the bank of Nova Scotia to buy gold.
In the Dotcom people were quitting good jobs to day trade
In 2005 I lived in Palm Desert and we would chat on the street corners about how our house prices were going up.
My son’s workmates were gong ho on Bitcoin in 2017, especially in December.
That’s euphoria.
The % bullish chart shows levels that were seen when the declines were more than 50% done. Maybe it will get worse.
I am mostly in cash, but my guess is that the market will bounce back, and that when it does and is forming the head of a H&S we will see the euphoria. “the unstoppable bull”…”Nothing can stop this market” kind of comments.
The flash crash, 1987 were very sharp significant drops but not the end of gains in the market. While 1987 was more than 20% it barely shows on a long term chart, and people say it was caused by portfolio insurance , they may say what is happening now is the robots….maybe we go lower before we go up, but even though I am waiting for the bear to do it’s work, I’m not convinced that this is it.
That is my sentiment FWIW.
Morgan Stanley says this market is not going to be as satisfying for the bears as well. Maybe the lack of euphoria gives hope that we will be able to avoid a 2008 like panic.
My observation is that with data available to everyone and with many algos incorporating historical tendencies in the tactics, it would not be easy to make big bets in the future. The outperformances of the old days, like those of Lynch and Buffet, are gone forever. Yet most of the investment pros are still fighting the last wars. There are no more inefficiencies and dislocations to exploit. Moreover our younger generation grows up in video game and smart phone era. They are jumpy, overly sensitive, and fragile. With boomers slowly out of the investing scene we will see more strange events occur in the market. But one thing is always true: Sentiment always leading fundamentals, because it is self-fulfilling. It is especially acute in today’s warp-speed hyper-connected world. Who said globalization is all good?
Where is the lineup on stocks like outside the 1980 gold stores? Here it is.
https://www.advisorperspectives.com/dshort/updates/2018/11/30/margin-debt-and-the-market-down-6-25-mom
Low interest rates and the Fed Put saving every correction from becoming a bear market has led to huge confidence that shows up in totally unprecedented volumes of margin loans. The chart show a Mount Everest compared to previous small hills. If gold lineups were down the block, this margin lineup is down the inter-state.
One thing about margin debt that I noticed…sample size is only 2 so it could be noise, but in 2000 and 2007 the margin debt spiked up through the channel of debt. So far it has not. If the evil twins of BTFD and FOMO rear their ugly heads we might see a spike up in margin debt…just gotta wait and see
Cam,
Looking forward to you write up on the trading model. One question I have that maybe you will address in your write up is the success rate of trading model signals when they are aligned with the trend model and inner investors versus when they are counter to those models. It would seem to me that short-term trades taken against the longer term fundamentals and trend backdrop would tend to perform much worse than those taken in concert with those. One way to account for this would be to have the trading model only go long or flat when the investor and trader models are bullish and vice versus when they are bearish. Otherwise you can end up with picking up pennies in front of a steamroller type trades like they one the inner traders is trapped in now. Would be interested in your thoughts on this.
An effective and simple approach is to check the VIX level and trend when engaging in short term trades. Use it as a confirmation signal to enhance the odds.
Trading is just that, trying to guess when things reverse or end. There is a lot of noise. Often the counter-trend moves can be very sharp. So now what makes sense is a rally back at least to prior support resistance, only will it happen?
Since people are focused on tariffs and shutdowns there is a lot of negative sentiment. Will this prove to be a bear trap or the first leg down of a bear? My hunch is a trap, only I don’t have a solid guess how much more it will drop.
Let me make some suggestions and observations. What I say is practical and it works. My specialty is identifying major market turning points. I have missed the 1987 bear market and every one since. In my book on momentum investing, you’ll find links to national newspaper articles from 2001, 2008 and January 2016 report on my clients celebrating this accomplishment at the bottom of each bear market. Readers of this newsletter will have read my blog posts warning since early this year of exactly what’s been happening lately. A couple of months ago I said, I will have the best performance of any portfolio manager after we hit this financial hurricane sooner than people expect. I just checked my performance so far in December. Growth and Balanced Model portfolios were flat for the month in a month that was the worst December since 1931. The portfolios were were up (yes up) just under one percent last week during that extreme collapse.
My prediction has been that we are in a bear market since the beginning of 2018. Portfolio managers talk about taking risk off the table but they never actually do it. It was an easy prediction that my performance would be the best since I’m virtually the only one that reduces equities to a very low level, buys long/short alternative ETFs with cash on the sidelines, and when a bear is here, I start using moving averages to buy and sell.
I say the above to establish some credibility about what I will be posting today.
Onward. I have good news and bad news.
The good news is there’s an excellent chance a bull market has started already on October 29. That bull market is in China. I look at three Big Picture factors in predicting risk, investor sentiment, market valuation and leading economic indicators. All three are in place now in China. Stock are very cheap, investors are very panicky and recently they made great policy changes to get their economy going. Portfolio managers are U.S.-centric and don’t follow events in China other than reading scary articles that fit their confirmation bias that China will crash.
Lately, the Chinese Central Bank eased reserve requirements of banks. They have a huge amount of room to do this because reserve requirements are very high around 15% of deposits. If memory serves me, it’s about 5% in America. By the way, that’s a good reason to downplay scare stories about Chinese Banks. They dropped personal tax rates to give consumers more to spend. And I think most importantly, they set up an LTRO-type program to solidify banks from problems loans for three years. When LTRO programs were set up in Japan, America and most recently in Europe, those stock markets soared since worries about bad loans sinking their banking systems went away. So, these three measures, form a positive leading indicator. My expectations are that China will be a market leader for the next couple of years.
So, I’m looking at Chinese ETFs of various kinds and planning to use a moving average line to buy. Hopefully the bull market starts to run. If let’s say the trade war or global financial problems overwhelm things, I will sell if they fall below the moving average. This by the way is not a recommendation because I know nothing of your circumstances.
Recently, I listened to Charles Gave, a respected and very aged market guru who believes the world is splitting into three, Americas, Europe and China/Asia. With anti-globalism rising, these may not be in sync like historically. He favors China/Asia and hates Europe. In fact he thinks Europe is imploding with its banking system in turmoil.
Now the bad news, the U.S. market has two of the three ‘Big Picture’ items in place, sentiment is panicky, value is now decent although not cheap but leading economic indicators are not good. There is a faint hope for the bullish economic camp that the futures market for Fed Funds dropping so much is a way to say rates are falling. But, in my mind the blow out of junk bond spreads has to reverse like it did in early 2016 when that bull market low was marked. There is a huge amount of uncertainty about how markets will fund huge Treasury budget deficits, Fed QT bond sales and massive corporate debt roll-overs in 2019. In 2008, we saw a big drop in Treasury bond yields at the same time junk bond spreads soared to 20%. So, only focusing on ten year treasury yields could be a mistake. The current run up in junk yields has been large and shows there are financial stressers starting. Remember the S&P 500 has very few companies that are junk rated. The Russell 2000, which is down over 20% is where the junk issuers reside.
The reason why the stock market is falling this year when there was no recession on the horizon is because we’re having and Anti-Beta crash. I do a lot of original research in Tactical Factor Allocation. One factor is usually overlooked, Anti-Beta. This is long low beta shares and short high beta. In the long run, low beta beats high beta because high beta is overvalued. But high beta often has a big run before it crashes. There is ample research showing when to expect a ‘Beta Crash’. It’s simply when popular stocks have a long uptrend and get overpriced. In other words, at the end of 2017. High Beta stocks were way too high. Since September, the Anti-Beta ETF (BTAL) has outperformed the market by 25% (up 15% versus down 10%).
Also unweighted sector indexes outperformed weighted by a large amount. This tells me that big cap ETF popular leaders were falling faster than the rest of the market.
A beta crash is a sentiment thing not an economic. That’s why everybody missed it. But then you might ask, if high beta gets washed out with extremes in pessimistic sentiment like we are seeing now, can that make the bottom? My thinking is possibly. But not if the beta crashing stock market influences consumer spending negatively. Stock markets going up produce a ‘Wealth Effect’, going down a ‘Poverty Effect’. That’s producing an ironic effect. Everyone stayed in the stock market as it was falling because there was no recession on the horizon given normal long term indicator readings. But the beta-crashing market might create the consumer recession very soon that wasn’t evident without the crash.
A change of topic. Let’s take a look a the power of a moving average strategy in a bear market. Here is a chart of the Oil & Gas Producers ETF. It was my largest holding. Oil prices were virtually guaranteed to go up when the Iran sanction would go into effect. I felt foolish putting in a stop loss sell order at the moving average line and doubted whether selling it at $41 was wise. Well, Trump pulled the rug out from under OPEC by allowing the 8 largest importers of Iranian crude to keep on buying. The ETF is now around $25 after an amazingly steep plunge.. You might say that I could have sold when I saw the bad news rather than use a mechanical stop loss method. But. I’m a student of behavioral economics and I know I might be trapped by my biases into holding on and hoping for a rally. I’m sure you and most investors are struggling with loss positions currently that you’ve decided to hold on wishfully hoping rather than admit defeat and selling.
https://product.datastream.com/dscharting/gateway.aspx?guid=ab7451f3-9b26-49ee-a066-37711d85c002&action=REFRESH
Portfolio managers don’t like to use moving averages to buy and sell. They want to use their vast knowledge. They hate say, “I don’t know.” I pride myself in being a very knowledgeable student of the markets but I’ve also come to realize that sometimes it’s impossible to know what will happen. Cam’s post today is a perfect case. We are either at the bottom of a mild bear or midway down to a big bear low much deeper. Guess what? Nobody knows. A great quote was, “If you aren’t confused, you simply don’t know what’s going on.” That is where we are today. I said in a blog post a while ago that investors should stop buying dips ( a profitable strategy for two years) now that we were in a bear and start using moving average lines because you could get trapped if markets plunged more than expected. We are still in the bear so my suggestion is to use them or some other objective stop-loss method.
Hello Ken, Your market views have been spot on. Congratulations. What is the title of your book on Momentum Investing? Do you have a website?
Thanks for asking. Title is ‘Momentum Investing in the Internet Age.’ It is only an eBook because there are so many linked charts in it that update every night. You can buy it on Amazon.com or better still on kenmacneal.ca
I email out a weekly ETF performance ranking of 56 key ETF sectors (country, industry, style) to book buyers who identify themselves. I take the time-consuming chart work out of momentum investing with web links that update automatically.
Are you by chance familiar with the work of Scott Judds who received the Wagner Award by the NAAIM in 2016 for his paper titled Automated Polymorphic Momentum? Here’s a copy of the paper:
https://sumgrowth.com/downloads/Automated%20Polymorphic%20Momentum.pdf
Scott is a Stanford educated electrical engineer who has applied his knowledge of communications theory to the field of investing. You wouldn’t think there was much in common, but creative minds often see points of intersection that others miss. After you’ve read the paper, you can get loads more details on his website http://www.sumgrowth.com.
Thanks for sharing. Aubrey
Ken, when looking at China, your thesis is intriguing to say the least. If you do make the bet, when looking at ETFs that best fit the bill for China exposure, do you use an ETF that is hedged against currency fluctuations or unhedged? And could you give examples of each?
Thank you for your input on Cam’s site!
As stocks loose value, margin clerks are liquidating positions, creating a vicious cycle of forced selling, pushing prices further down.
Tax related selling, is also likely in the background here causing a selloff (should have happened in January 2019).
Here is something more scary; Treasury secretary Mnuchin has assured American investors of “ample liquidity” with banks!!! I would like to label this “Lehman moment”.
Here is a link; https://www.marketwatch.com/story/treasury-departments-odd-attempt-to-reassure-investors-may-have-just-backfired-2018-12-23
Margin debt is down, as expected. This is a cause of the sell off, likely, not causing the sell off, but both feed on each other.
https://www.advisorperspectives.com/dshort/updates/2018/11/30/margin-debt-and-the-market-down-6-25-mom
Secretary Mnuchin is in Cabo San Lucas, as this news breaks out. The link above, shows the letter from the Treasury and twitter comments that are very scary. I have nothing more to add here, except that on the face of this it sounds really scary!!!!!
I was hoping to get some insight on the precipitous drop in the indices since mid-Oct. All the usual stuff (deterioration in LLEI, weak housing, rising interest rates, QT, slowdown in global growth, trade war with Chine, etc.) have been known for a while now. What triggered the fall since mid-Oct? Anyone? Thank you.
I think it is where big money flows. That’s why imho sometimes bad news is good. There is also sentiment, but that can work both ways. Also if the trade is crowded then there is imbalance in the market. So now, are we looking at a bear trap that is closing, or a rebound rally in a bear market? All this talk about markets crashing , trade wars etc makes me lean toward a bear trap…but……we shall see….if they start shouting about a bear trap, get out of longs?
Thank you. Appreciate your response.