Preface: Explaining our market timing models
We maintain several market timing models, each with differing time horizons. The “Ultimate Market Timing Model” is a long-term market timing model based on the research outlined in our post, Building the ultimate market timing model. This model tends to generate only a handful of signals each decade.
The Trend Model is an asset allocation model which applies trend following principles based on the inputs of global stock and commodity price. This model has a shorter time horizon and tends to turn over about 4-6 times a year. In essence, it seeks to answer the question, “Is the trend in the global economy expansion (bullish) or contraction (bearish)?”
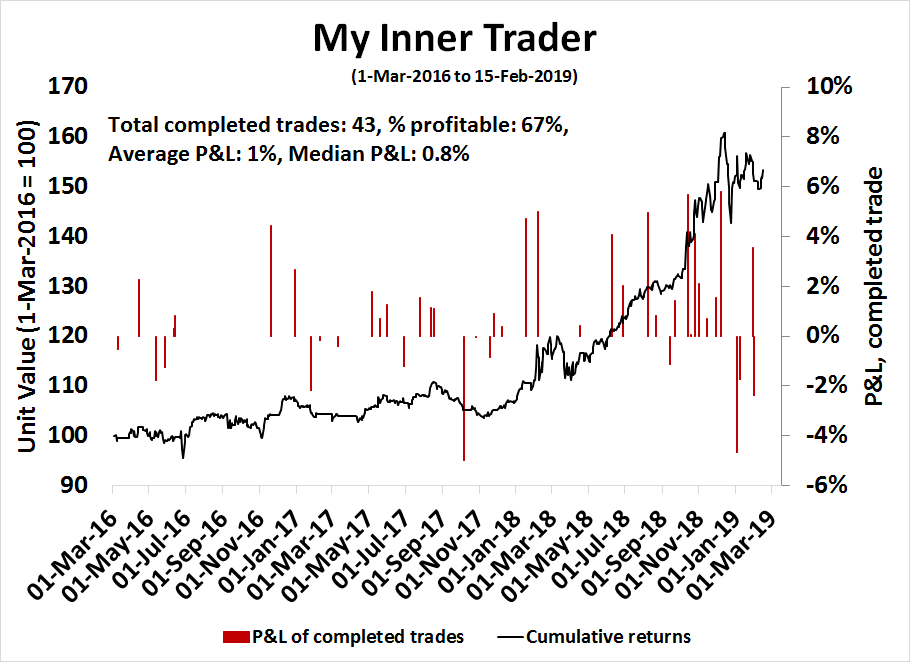
My inner trader uses a trading model, which is a blend of price momentum (is the Trend Model becoming more bullish, or bearish?) and overbought/oversold extremes (don’t buy if the trend is overbought, and vice versa). Subscribers receive real-time alerts of model changes, and a hypothetical trading record of the those email alerts are updated weekly here. The hypothetical trading record of the trading model of the real-time alerts that began in March 2016 is shown below.
The latest signals of each model are as follows:
- Ultimate market timing model: Sell equities
- Trend Model signal: Neutral
- Trading model: Bullish
Update schedule: I generally update model readings on my site on weekends and tweet mid-week observations at @humblestudent. Subscribers receive real-time alerts of trading model changes, and a hypothetical trading record of the those email alerts is shown here.
Gazing into the crystal ball
In the past year, I have been fortunate to be right on the major turning points in the US equity market. I was steadfastly bullish in early 2018 after the correction (see Five reasons not to worry, plus two concerns). I turned cautious in early August because of the early technical warning, which was accompanied by deterioration in top-down data (see Market top ahead? My inner investor turns cautious). Finally, I turned bullish on stocks in mid-January 2019 (see Ursus Interruptus).

What’s next, as I gaze into the crystal ball for 2020 and beyond?
Short and long-term outlook
I pointed out last week that I am both bullish and bearish, but on different time frames (see Here comes the growth scare). Here is my base case scenario:
- Short-term growth scare (next 1-4 months)
- Recovery (remainder of 2019)
- Two themes for 2020:
- Resumption of Sino-American Cold War 2.0
- Prepare for the Modern Monetary Theory (MMT) experiment
Near term growth scare
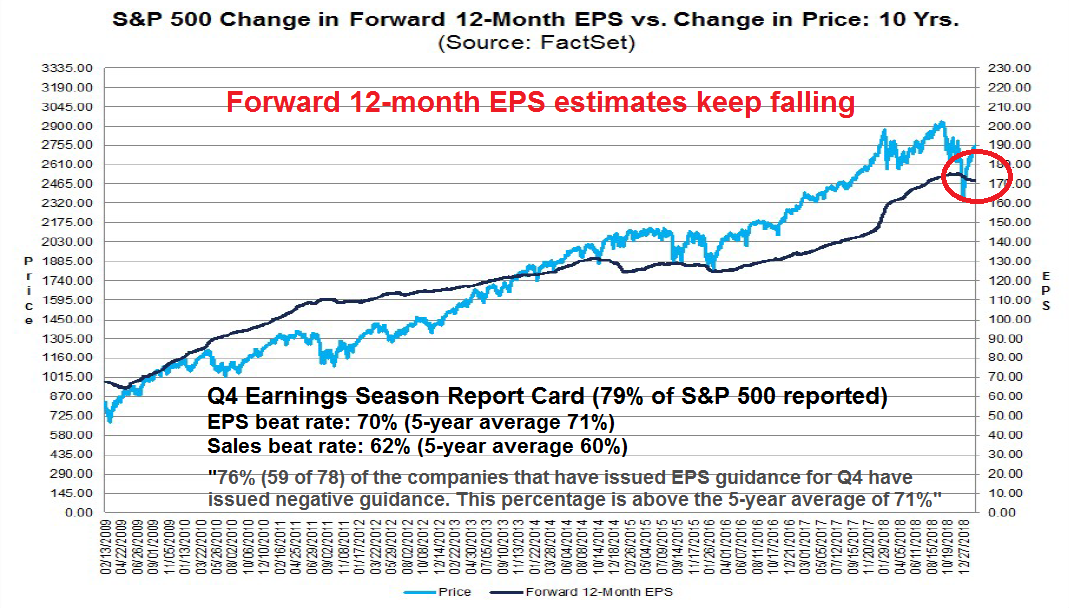
I have been writing about a possible near-term growth scare, and there is no point repeating myself (see Here comes the growth scare). The most visible sign of a growth slowdown is the continual downward revisions of forward 12-month EPS, indicating a loss of fundamental momentum, and the above average rate of negative guidance for Q1 earnings.
In addition, the deterioration in initial claims is concerning, as initial claims have historically been inversely correlated with stock prices. However, there may be an anomaly in the data because of a possible spike that attributable to the federal government shutdown.

Another worrisome sign of weakness is the diving NFIB small business confidence.

Globally, bond yields are also plunging, which is a real-time market signal of slowing growth.

New Deal democrat, who monitors high frequency economic figures and categories them into coincident, short leading, and long leading indicators, indicated this week that the short-term outlook is deteriorating, though with an important caveat:
The big news this week is that the short-term forecast has turned sharply negative, while the coincident nowcast also turned negative. The long-term forecast remains essentially neutral.
A special note of caution this week: In the past several weeks a whole variety of both weekly and monthly indicators in several time frames have abruptly cratered. Part of that may be due to the “polar vortex” giving rise to 30-year low temperatures in part of the country, but I suspect that the effects of the government shutdown have been more pronounced than almost everybody thought. A similar pattern happened during the 2011 “debt ceiling debacle.” If so, the coincident indicators in particular should begin to bounce in the next several weeks.
No 2019 recessionary bear
Should stock prices retreat and test the December lows on a growth scare, I believe such an event would represent a gift from the market gods. I had pointed out that the equity valuations in December 2018 were discounting a mild recession (see Ursus Interruptus), which represents a contrarian buying opportunity, unless you believed that a catastrophic global meltdown was about to happen.
Today, the Fed has become much more accommodative, and it has signaled that rate hikes are on hold until mid-year. A recent CNBC interview with Fed governor Lael Brainard revealed a even more dovish tilt. The Fed is now more attuned to downside risk from abroad [emphasis added]:
STEVE LIESMAN: How does it fit in with your general view of the economy? Did you believe the economy is decelerating? Is that part of that framework that you have?
LAEL BRAINARD: So I think going into this year we would have expected a solid growth figure, but a slower growth figure than the very strong growth we were getting last year. But downside risks have definitely increased relative to that modal outlook of continued solid growth.
STEVE LIESMAN: Let’s talk about some of those risks that are out there. First overall question: do you see an elevated risk of recession this year or next?
LAEL BRAINARD: I would certainly say there are a variety of downside risks. And, of course, I’m very attend I have to all the recession indicators that people look at, including the slope of the yield curve. But in terms of the other kinds of downside risks, foreign growth has slowed. It was first very apparent in China, but now we’re seeing those numbers coming in below expectations in Europe. Policy uncertainty still high whether, you know, we look at trade conflict with China or whether we look at Brexit, and financial conditions have tightened, so I want to take those on board as I think about the year ahead.
In addition, the market had been concerned about the Fed’s program of steadily shrinking its balance sheet, which represents a form of monetary tightening. Brainard stated that she is in favor of ending the program of balance sheet normalization later this year:
So I think on the balance sheet, it’s really important to distinguish between the overall technical factors and monetary policy. With regard to just the general size of our balance sheet, ultimately, you know, we said last time that we’re going to stay in an ample reserve system. My own view is that balance sheet normalization process should probably come to an end later this year. We know that liquidity demand on the part of financial institutions is much higher than it was pre-crisis so we want to make sure that there’s an ample supply of reserves to guard against volatility.
The Powell Put is firmly in place.
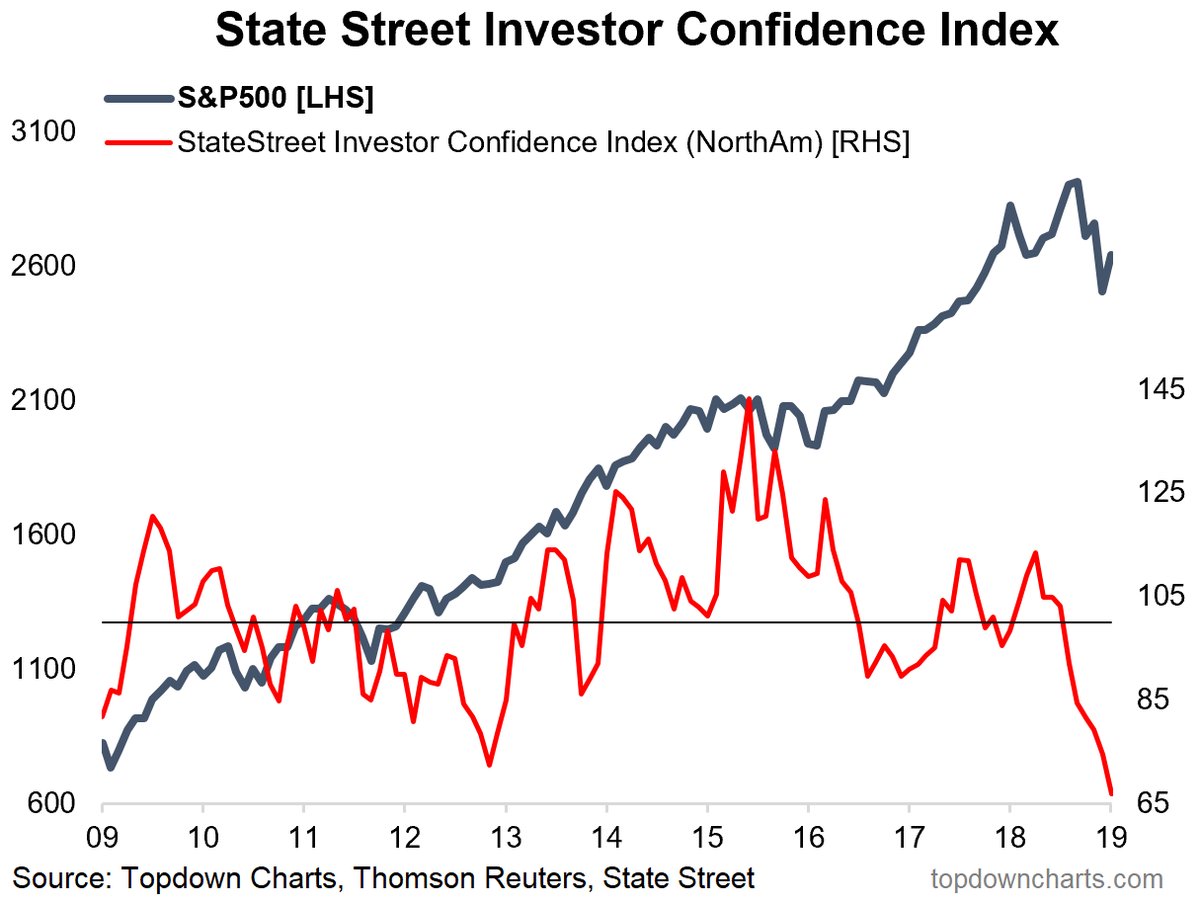
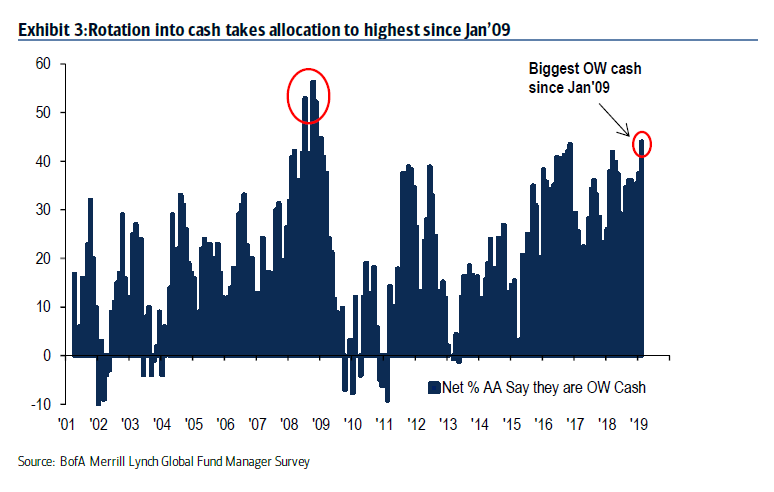
In addition, there is sentiment support in place that will put a floor on stock prices. Simply put, the slow moving institutions are bearish, which is contrarian bullish. Callum Thomas reported that the State Street Confidence Index, which measures the equity allocation of fund managers by the State Street custodian bank, is at an extreme indicating high levels of defensiveness.
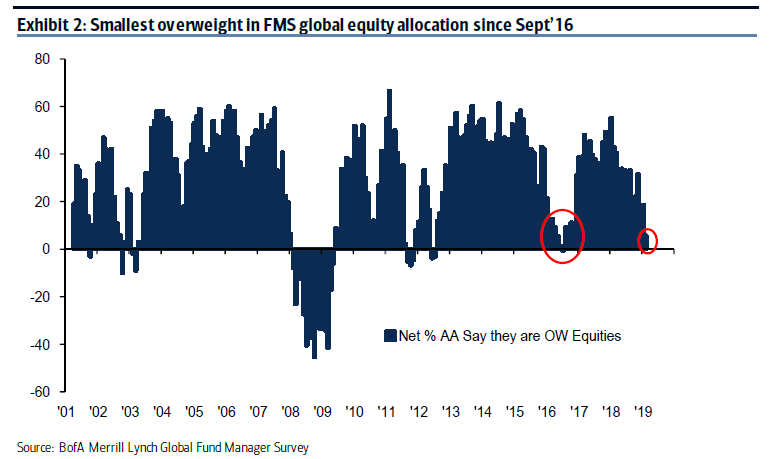
The latest BAML Global Fund Manager Survey confirms these observations. Equity allocations are at the lowest level since September 2016, despite rising stock prices. This indicates that managers are increasingly defensive and they are actively selling their equity positions.
The defensive posture can also be seen in cash allocations, which have risen to levels not seen since 2009.
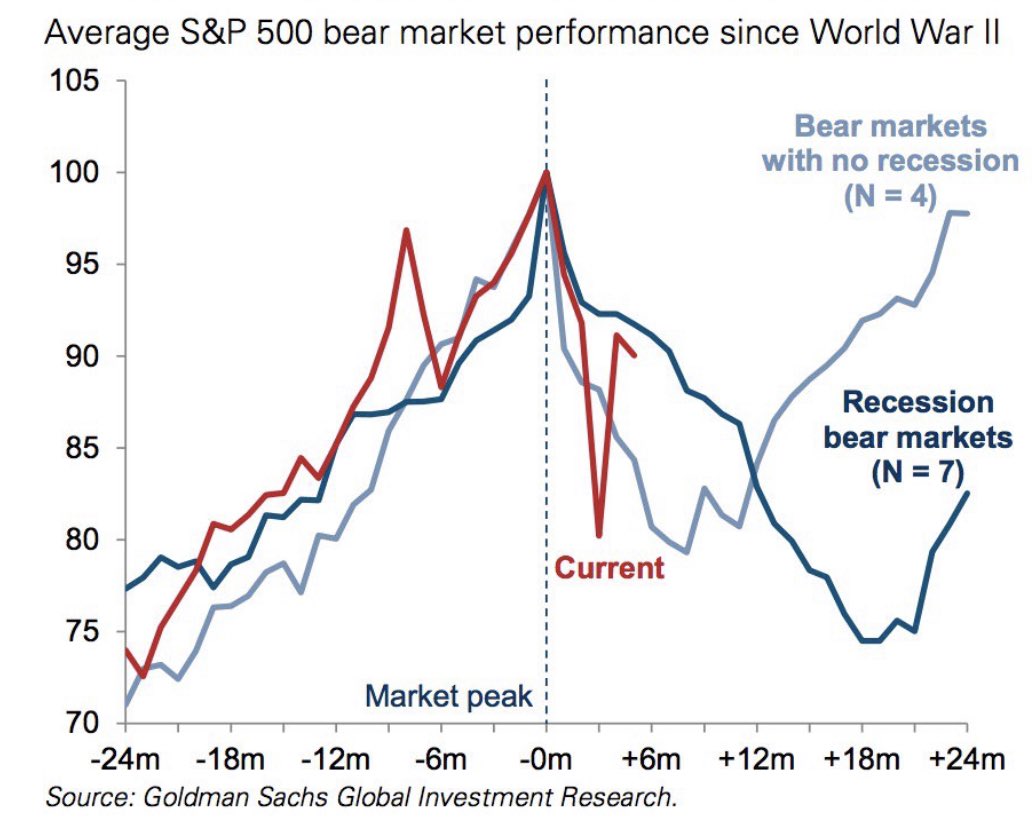
Analysis from Goldman Sachs shows that past equity bears with recessions tend to continue to fall, while bear markets without recessions tend to recover quickly. I believe the current episode falls into the latter category, and if history is any guide, expect a pullback over the next few months, followed by a recovery.
Once the market moves past any growth scare and realizes that recession risk is only a mirage, the market should stage a relief rally, which I believe should last until year-end.
Cold War 2.0
The year 2020 is another story altogether. While my crystal ball starts to get cloudy beyond six months, there are two themes that investors should consider in 2020. The first is the resumption of the Sino-American Cold War 2.0.
The friction between America and China is not just restricted to trade. I wrote in early 2018 that the US had branded China a strategic competitor in its National Security Strategy 2017 (see Sleepwalking towards a possible trade war). Regardless of what understanding both sides may come to before the March 1 deadline, those tensions are not going away.
Leland Miller of China Beige Book summarized the most likely scenario in a recent CNBC appearance.
- The short time frame of 90 days between the G20 summit and March 1 prevents meaningful negotiation between the parties on comprehensive structural reform.
- The only way a deal that can be done if a Trump-Xi meeting can be finalized.
- Both sides want a deal, so there will be a deal, but it will be a superficial one at best.
- The provisions of a deal will include commitment to reduce the trade deficit, and shallow efforts on IP protection, but those provisions can be reversed easily if relations deteriorate.
- Robert Lightizer recognizes that Trump wants a deal, and his mandate is to strike the best deal he can. Therefore his primary focus has turned to enforcement. The intent of the latest round of negotiations is set up a process to document possible non-compliance by China so that they can retaliate with higher tariffs in the future.
In a separate CNBC appearance, Miller stated that there is a growing consensus on both sides of the aisle in Washington that China is becoming a problem for America. As the US approaches the 2020 election, he expects that both Trump and the Democratic nominee to posture and demonstrate how tough he or she is on China. This outcome will not be bullish for US-China relations, the global trade outlook, or equity prices.
Look for a resumption of Cold War 2.0 in 2020, not just in trade, but in other dimensions as well.
The Great MMT experiment
The dominant event of 2020 for the stock market will be the election. While there will be a huge gulf between Trump and the Democratic nominee, there will be some commonalities. Donald Trump is a self-professed “debt guy”. The ambitious provisions of the Democrats’ Green New Deal (GND) suggests that Modern Monetary Theory (MMT) will become a major topic of conversation in 2020. Whoever wins, MMT is likely gain greater traction and become a serious theory for government finance in the post-electoral landscape.
What is MMT?
Kevin Muir at The Macro Tourist had a terrific layman’s explanation:
MMT’ers believe that government’s red ink is someone else’s black ink. Sure, the government owes dollars, but they have a monopoly of creating those dollars, and not only that, the creation of more and more dollars is essential to the functioning of the economy.
Here are the policy implications of accepting MMT:
- governments cannot go bankrupt as long as it doesn’t borrow in another currency
- it can issue more dollars through a simple keystroke in the ledger (much like the Fed did in the Great Financial Crisis)
- it can always make all payments
- the government can always afford to buy anything for sale
- the government can always afford to get people jobs and pay wages
- government only faces two different kinds of limitations; political restraint and full employment (which causes inflation)
The government can keep spending until they begin to crowd out the private sector and compete for resources.
And in fact, Stephanie Kelton [a leading academic proponent of MMT] argues it is immoral to not utilize this power to fix problems in our society. From an interview she gave,
“if you think you can’t repair crumbling infrastructure or feed hungry kids, unless and until you find some money somewhere, it’s actually pretty cruel because you leave people who are struggling in a position where there are still struggling and they are hurting, and they are not properly taken care of…”
This may sound like sacrilege to Austrian economists, but MMT adherents believe the government can keep on spending, and printing money with inflation being the only constraint on its actions. Before descending down the rabbit hole of whether the MMT effects are benign, like Japan, or hyper-inflationary, like Zimbabwe, here is some perspective. FT Alphaville published an insightful article detailing how the US financed its deficit during the Second World War. Ultimately, how an initiative is financed is a political question [emphasis added]:
In a resolution this week, in interviews and even in an oped for The Financial Times, Democrats have either hinted or said outright that they would pay to fight climate change by borrowing — the same way the country paid to fight fascists. It’s not an absurd comparison. During the war, the US borrowed more than 100 per cent of its gross domestic product and did not subsequently collapse.
Also, though: finance in the US was different in the 1940s.
- The Federal Reserve explicitly supported the goals of the war, and expanded its balance sheet to keep Treasury yields down.
- Domestic institutional investors were trapped in the US, with few options for assets other than Treasuries. There weren’t really any foreign investors.
- Within a decade after the war, two runs of inflation — the first of which reached 20 per cent — got the US debt to GDP ratio down to 50 per cent.
We have always been underwhelmed by the argument “you can’t do x, because x is politically infeasible.” You argue a policy on its merits, then you convince the people you need to convince. And shocks can redefine “feasible,” the way hurricanes and wildfires have in the US.
But: to borrow at the scale of the second world war is not just a political question for Congress. It’s a political question for the Fed, which during the war provided quantitative warfighting to keep yields down on Treasuries. It’s a political question for US capital at home, which has spent the last 40 years getting used to buying assets wherever it wants in the world. And it’s a question for foreign capital in US markets, which didn’t exist during the war, and may not feel compliant now.
Twenty per cent inflation in 2030 wouldn’t hurt, either. But it’d be, you know, a political adjustment.
The US raised taxes on capital from 44 to 60 per cent during the second world war. Labour taxes doubled, from 9 to 18 per cent. The numbers come from a 1997 paper by Lee Ohanian for the American Economic Review. The US financed just over 40 per cent of the war through direct taxes, comparable to what the Union did during the Civil War. It was a far greater percentage than during the Revolutionary War, the War of 1812 or the first world war:

The Fed cooperated to keep rates down, with a technique otherwise known as financial repression:
We don’t have a historical record of what happens to Treasury yields as debt climbs above 100 per cent of GDP, because the Fed was part of the war effort. In 1942, the Fed began intervening in Treasury auctions, keeping 90-day bills at 3/8 of a per cent, with a ceiling for all debt on 2.5 per cent.
After the war, inflation eroded the debt away:
In a paper for the National Bureau of Economic Research in 2009, Joshua Aizenman of the University of California, Santa Cruz and Nancy Marion of Dartmouth College point out that within 10 years of the end of the war, two bouts of inflation dropped US debt by 40 per cent. (They also note that the US, unlike other countries, tends to extend the maturity of its debt when it borrows more. Maturity peaked at 113 months in 1947. It reached a low of 31 months in 1976, and is now back at 69 months.)
But developed-economy central banks can’t create inflation now even when they’re desperate to. So a 29-year nonmarketable bond at 2 3/4 per cent, like the one Treasury offered as a swap in 1951, might not be the same good deal for Treasury anymore. Maybe it can’t be inflated away. Again: we just don’t know.
Here is the key conclusion [emphasis added]:
Democrats have proposed to finance a new program the way the US financed the second world war. They are correct that when Americans really want something, they find a way to pay for it. But a lot of things — including the entire structure and movement of US and global capital —were very, very different during the war. There’s consequently no guarantee what worked in the past will work again today.
Today, the US has a dovish and compliant Federal Reserve. The President is a self-professed “debt guy” who is not afraid to stimulate the economy by running deficits. His likely opponent in 2020 will likely come from the left wing of the party who is sympathetic to similar ideas about government finance. What they differ on are the government’s priorities.
This is a perfect political environment to experiment with MMT. At best, MMT represents a new theory that turns macro-economics and government finance upside down. At worst, Stephanie Kelton, who is the academic face of MMT, is the Left’s version of Arthur Laffer.
Whoever wins, expect a round of reflationary fiscal stimulus in 2021. The result will be bullish for growth, and equity prices.
I leave the theorists to argue how the piper will be paid. The answer to that question is well beyond my pay grade.
The outlook for 2020″sl
In conclusion, as we peer into 2020, I expect the competition between the US and China to heat up again into a new Cold War 2.0. This development will be bearish for equity prices.
On the other hand, we are likely to see an experiment with MMT in the post-electoral landscape in 2021. Should such a scenario unfold, it would provide a fiscal boost to the economy, and equity prices.
I suggest that investors prepare for these themes to become more dominant in the future. It is impossible to forecast the magnitude of these effects, as my crystal ball gets very cloudy when I look that far ahead, but my best advice is to be aware of these themes, and stay data dependent.
The week ahead: A market stall ahead
Looking to the week ahead, the US equity market is nearing an inflection point. Risk/reward is starting to tilt towards the downside, though there may be some minor upside potential left.
Mark Hulbert observed that his NASDAQ Newsletter Sentiment Index (HNNSI) is highly elevated and he described sentiment as climbing a “slope of hope”, which is contrarian bearish.

Hulbert qualified his remarks that sentiment models are inexact in their market timing. In the past, he has stated that these signals tend to work best on a one-month time horizon. I would also point out that overbought markets can become more overbought, and HNNSI readings are not at the extreme levels seen at past market tops.
The usual qualifications apply, of course. Contrarian analysis doesn’t always work. And, even when it does, the market doesn’t always immediately respond to the contrarian signals. This past summer, for example, as you can see from the chart, the HNNSI hit its high about six weeks prior to the market’s. That’s a longer lead time than usual, but not unprecedented. But when the market finally did succumb to the extreme optimism, the Nasdaq fell by more than 20%.
Another qualification about the HNNSI as a contrarian indicator: It works only as a very short-term timing indicator, providing insight about the market’s trend over perhaps the next few months at most. So it’s not inconsistent with the contrarian analysis of current market sentiment that the stock market could be headed to major new all-time market highs later this year.
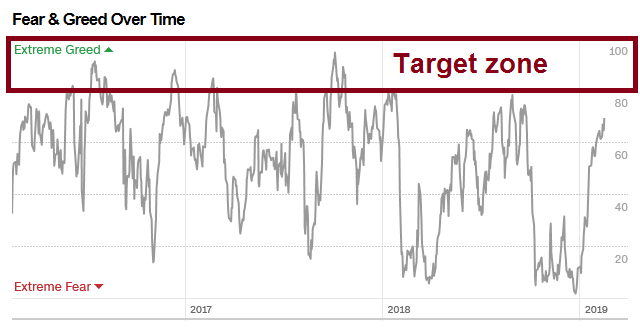
The Fear and Greed Index is also flashing a warning, though the indicator has not reached levels seen at past tops either.
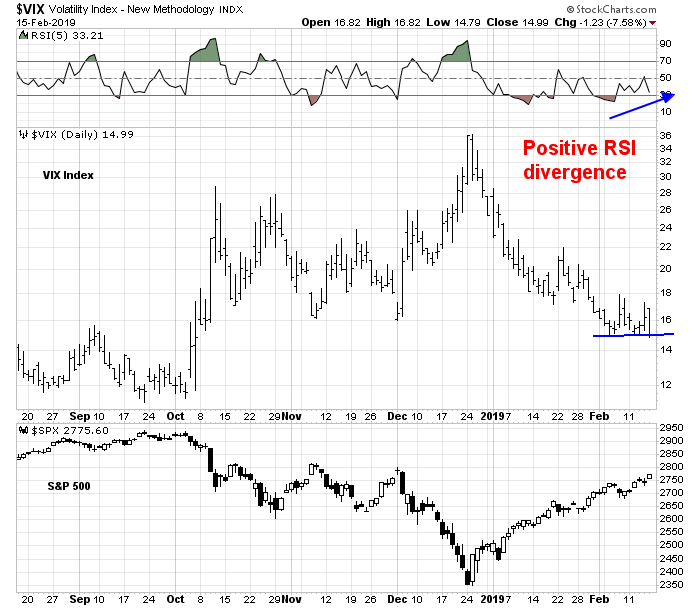
The market action of the VIX Index, which is inversely correlated with stock prices, is also flashing another warning. RSI-5 momentum flashed a bullish divergence for the VIX, indicating that volatility is about to spike, which conversely means a decline in stock prices.
However, positive momentum still holds the short-term upper hand, and there may be more upside potential over the next few days. Small cap stocks, as measured by the Russell 2000, have broken up through its channel, and they have also rallied through a relative downtrend (bottom panel).

We can also see a similar pattern in midcap stocks, both on an absolute and market relative basis.

These signs of positive momentum still have to be respected. For the time being, the market continues to flash a series of “good overbought” RSI-5 conditions indicating strong momentum. The market has not triggered any of my bearish tripwires, such as the Fear and Greed Index above 80, the VIX Index falling below its lower Bollinger Band, or RSI-14 rising to an overbought reading of 70.

On the other hand, short-term breadth indicators are sufficiently overbought that the market could pull back at any time.

My inner investor is neutrally positioned at his target asset allocation levels. Equity returns should be positive over the next year from current, though he does not expect them to be spectacular.
My inner trader remains long equities, but he has been taking partial profits as the market rallied last week. He is waiting for either an overbought extreme reading or a downside break as a signal to reverse to the short side.
Disclosure: Long SPXL
I was shocked when doing my momentum charts this weekend to see the S&P 500 was up 18% from the December 24 sentiment low. It hit me that this is a BIG upleg and it begs the question, ‘Can an investor rationally buy in at this point?’.
My deep studies of momentum says that momentum works because of investor biases. Generally, when some new event happens that should send an investment much higher (or lower), people react too slowly. It’s easy to sell when something is up and hard to buy. This means a trend is established to that point in the future when the full benefit of the new event is built into prices. Then there is usually a thrust to an overshoot at the end of the cycle as herding bias kicks in.
So what is the new event that happened after December and how far can it take markets higher? My guess is the new Fed Powell Put. Going into the December Fed Rate Hike, Powell was considered a monetary hawk unlike his two predecessors. He was thought to be tough to stay on point watching economic data and not cave into market turmoil. This from his prior speeches and testimony. After the December crash, he changed 180 degrees. That is HUGE. No, actually it’s bigger than huge.
Fed Funds futures were plunging before the December rate hike. The markets were saying a hike would be a mistake but Powell needed to follow through especially since Trump was tweeting pressure on the Fed’s independence and Fed Futures had an almost 100% prediction of a hike. The crash of stocks confirmed that markets smelled a big mistake had occurred.
Fed Chair Powell changed his stance. So now the Fed is not data dependent, they are stock market dependent.
Momentum theory is likely right and the S&P 500 target from this new Powell Put is much higher from here and we are making a mistake by not putting new money into stocks even after this 18% rise. What thought process could help us rationalize doing the right thing.
Here goes:
Look at the chart of the S&P 500 and you see major congestion in October to early December. Many strategists thought this was a basing formation. But the December Fed mistake of hiking when they should have paused, pulled the rug out from under the support. The 18% gain from the Fed Mistake low just takes us back to the October basing price.
What’s different now from October? On the negative side, we have a short term economic dip (helped by the government shutdown) due to the Fed Mistake. On the plus side, we get years of a Powell Put on rates plus a tame QT. If we were asked, would we buy stocks at October prices if we knew Powell would be changing his stance and future Dot Plot hikes leading to a sure recession would be avoided. We would heartily buy. That’s even if we knew there would be a short term earnings pullback because of the Hike Mistake. A tame Fed that has my back will pay back over and over for years.
The only reason we wouldn’t heartily buy now at these same October prices is called ‘Anchoring Bias’. That says that we lock into recent prices as a measure of value not true value. So we only hesitate to buy because prices went much lower and we are anchoring on December 24th prices. As Cam says, if the market pulls back to those prices, it would be a gift from the gods and an easy buy from our anchoring bias human perception. Forget it. All the best investment decisions are tough ones. The gift from the gods is years of a Fed Chair with a new market friendly attitude. Don’t miss that by anchoring on an impossible dream.
In a MMT world, would you want to own stocks or bonds? In a MMT world, would you want a stock market dependent Fed or a data dependent one?
Ken, I find your application of human biases (anchoring on old prices, behavior economics) to stock market fascinating. Would you please suggest some books or other resources to dig deeper? Always appreciate your contributions here. Thank you.
Sanjay, here you go…from Mr Charlie Munger himself…The Psychology of Human Misjudgment | 25 Cognitive Biases | Charlie Munger x Harvard University
https://www.youtube.com/watch?v=e7KN9fkmVbw
Or here: https://www.allencheng.com/25-cognitive-biases-charlie-munger/
Thanks, Donald. I have seen Charlie Munger’s video before. Allen Cheng’s site seems very useful. Will check it out.
Appreciate very much for sharing you thought!
Thanks Ken, Really appreciate your excellent insight. I too have been of a mind that a retest is too easy. From the srart of the year I have steadily been raising allocations to my favorite businesses skewed toward the domestic economy and away from from China. I am mostly in with at least a year-end horizon.
Happy Hunting, Bert
Round number-itis at 2800?
US-China trade gap is widening!!
https://www.schwab.com/resource-center/insights/sites/g/files/eyrktu156/files/styles/embedded_700/public/US%20Imports%20and%20Export%20to%20and%20from%20China.png?itok=ptHv6KlT
President Trump may impose auto tariffs against European and Japanese autos (deadline for the report from Commerce department is 17th February).
Trade wars with Japan and Europe will be starting as I write this. Europe is not in a position to negotiate anything until the Brexit issue is decided (deadline 31st March).
Chinese trade talks may be extended, as the US-China talks stall over question of forced IP transfers to Chinese companies. What would be important is whether President Trump caves in and postpones 25% tariffs on Chinese imports (deadline 1 March).
No one is talking about USMCA (old NAFTA). Congress may not approve the deal. I do not know if there is a deadline on this.
All in all, next six weeks are critical. I would not be surprised if volatility explodes, soon.
India-Pakistan tensions are rising. The Indian election is coming up and Modi is under pressure to “do something”. Two nuclear armed powers staring at each other face-to-face is not a good thing for risk appetite.
https://www.aljazeera.com/news/2019/02/india-options-pakistan-kashmir-attack-190216164936295.html
https://globalnews.ca/news/4969420/pakistan-terrorism-india-iran-attacks/
Spot on, Cam. Yes, this development is fast becoming a powder keg.
One other thing. Since Christmas 2018 stock market bottom, stocks and bonds have both rallied. Generally, a bond market rally is seen as a risk off/aversion type move. Something has to give here. Between, the bond and stock investors, the bond market is usually right. it is a curious development for now, and perhaps a technical move in the bond market, as the Fed has backed off its hawkish stance. Time will tell, if the bond or stock market is right here.
Gold has rallied here as well, again, not exactly a development that inspires confidence in the stock market. VIX index is finding support at 15, It has bounced off this level multiple times between October to early December.
The backdrop of this rally does not meet the smell test IMHO, unless there is a retest/partial retest of the December lows.
Cam, you wrote that institutions are still bearish and still hoarding a large pile of cash. The economic data should improve as the worst of the cold weather and the government shutdown are behind us. The US markets continue to climb the wall of worry on the back of a recently benign Fed and some sort of US-China detente. Of course, with China and Europe slowing, there is hardly any place outside the US to invest. Given that, is there any data to suggest that the institutions will capitulate and come back to equities over the coming weeks and months?
http://fat-pitch.blogspot.com/2019/02/fund-managers-current-asset-allocation.html#more
Check this and his previous post.
Great. Thank you.
Hi Cam, Could you please point me to an article or other source where you explain the current specific asset allocation guidelines/levels you mean in the statement, “My inner investor is neutrally positioned at his target asset allocation levels.” If this is undefined or proprietary, no worries. Just trying to learn your system.
Thanks, Bert
This blog is taking an increasingly pro-inflation stand. Inflation is a really bad thing.
I disagree with that stand. Strongly.
This site is dedicated to forecasting the future. It is not dedicating to what you would like policy to be, but to profit from future policy.
If the economy becomes inflationary, then buy inflation hedges.