Preface: Explaining our market timing models
We maintain several market timing models, each with differing time horizons. The “
Ultimate Market Timing Model” is a long-term market timing model based on the research outlined in our post,
Building the ultimate market timing model. This model tends to generate only a handful of signals each decade.
The
Trend Asset Allocation Model is an asset allocation model that applies trend following principles based on the inputs of global stock and commodity prices. This model has a shorter time horizon and tends to turn over about 4-6 times a year. The performance and full details of a model portfolio based on the out-of-sample signals of the Trend Model can be found
here.
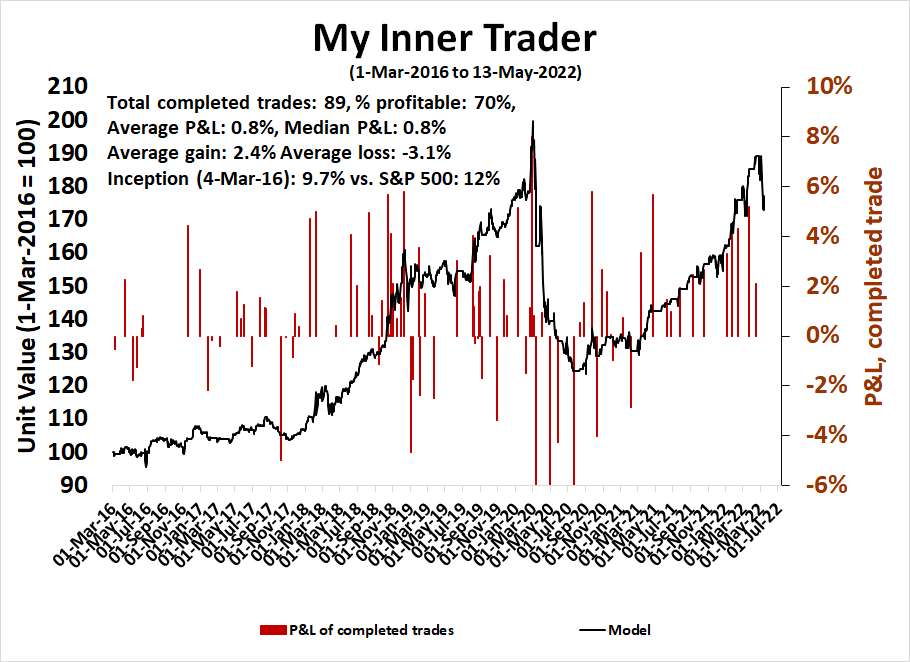
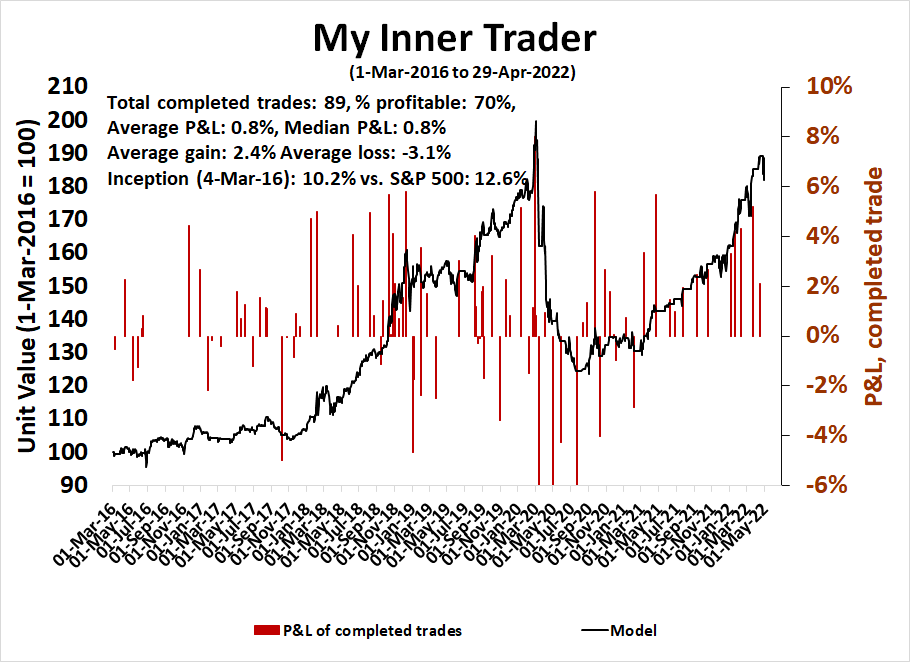
My inner trader uses a
trading model, which is a blend of price momentum (is the Trend Model becoming more bullish, or bearish?) and overbought/oversold extremes (don’t buy if the trend is overbought, and vice versa). Subscribers receive real-time alerts of model changes, and a hypothetical trading record of the email alerts is updated weekly
here. The hypothetical trading record of the trading model of the real-time alerts that began in March 2016 is shown below.
The latest signals of each model are as follows:
- Ultimate market timing model: Sell equities
- Trend Model signal: Bearish
- Trading model: Bullish
Update schedule: I generally update model readings on my site on weekends and tweet mid-week observations at @humblestudent. Subscribers receive real-time alerts of trading model changes, and a hypothetical trading record of those email alerts is shown here.
Subscribers can access the latest signal in real-time here.
A crypto bank run
I had voiced my reservations about the cryptocurrency ecosystem in the past (see
The brewing Lehman Crisis in Crypto-Land) and the risks manifested themselves in the last week. To briefly recap the problem, cryptocurrencies are mainly traded in the offshore market. A crypto trader can exchange USD for crypto, but banks do not allow direct access to crypto exchanges, with some exceptions. The crypto trader can exchange his USD for a stablecoin, which is a token that is theoretically backed 1 for 1 to the USD. He then exchanges his stablecoin to buy cryptocurrencies and back when he sells. When he wants USD in his account, he instructs the stablecoin provider to convert his stablecoin into USD, which is deposited to his onshore USD account.
The important piece of the crypto ecosystem plumbing is confidence in the stablecoin system. Stablecoins are supposed to be like money market funds, they shouldn’t be trading below par. Last week, the TerraUSD stablecoin, also known as UST, broke its USD peg and sparked a crisis of confidence. Within the space of a few days, the value of LUNA had evaporated to zero. Crypto traders began a virtual bank run on stablecoins. Tether, the largest stablecoin, broke its peg last week, While prices have partly recovered and stabilized, Tether is still trading slightly below 1.
The crypto bank run set off a stampede of selling in cryptocurrencies and other speculative risk assets.
The big question for investors is whether the crypto meltdown will have a long-lasting effect on global risk appetite and risk aversion leak into the equity market. Was the Crypto meltdown last week the new LTCM moment for asset markets?
Tightening until something breaks?
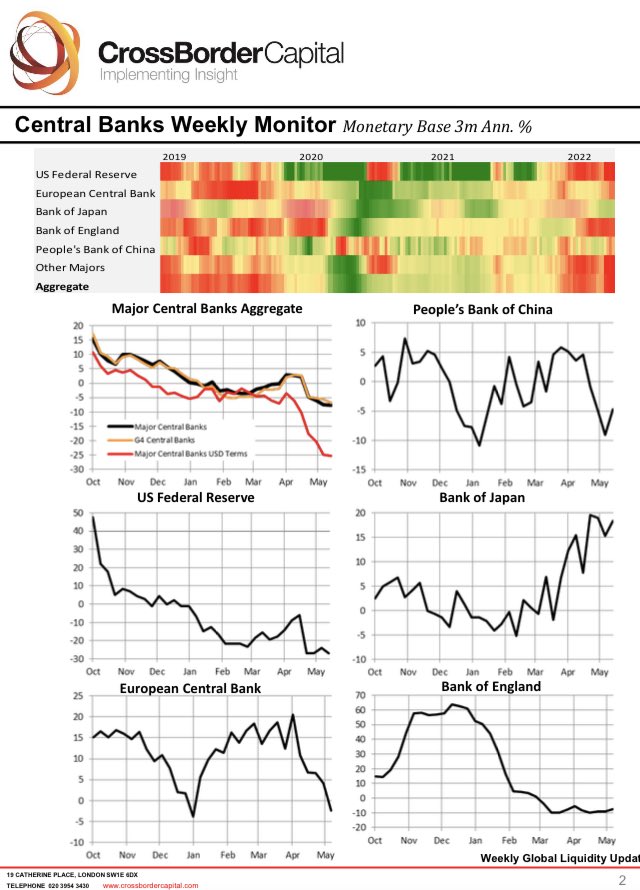
One way to explain the crypto crash is the tightening of financial conditions because of central bank monetary policy.
Cross Border Capital has documented the collapse in global liquidity, which would have been even worse without the BoJ.
The retreat in crypto values can be attributable to the financial system wringing out some of the speculative excesses from the last boom. Simply put, crypto assets went up a lot and they’re now retracing their gains.
In the past, the Fed has halted its tightening policy when something breaks, such as the Russia Crisis which sank LTCM. Does this mean that the Fed will come to the rescue of crypto investors? Probably not. Remember the underlying reasoning behind cryptocurrencies is they exist outside the fiat currency system. If you crash, you’re on your own, unless the crash threatens the fiat banking system. The Fed won’t act unless credit spreads blow out, which hasn’t happened. Financial conditions have tightened, though not a lot by historical standards.
Nevertheless, the high level of correlation between cryptocurrencies and the relative performance of speculative growth stocks, as exemplified by ARKK, is a measure of risk appetite. Last week’s stabilization of ARKK on high volume is a constructive sign for short-term risk appetite. The worst of the crash may be behind us.
Waiting for capitulation
Still, market analysts have voiced concerns about a lack of capitulation in the market. While technical internals are oversold, the signs of panic and capitulation that mark tradable bottoms have not been present.
The term structure of the VIX at the 1-month and 3-month level hasn’t inverted, indicating fear.
As well, some analysts observed that ARKK was seeing substantial inflows even as the ETF tanked. However,
Jason Goepfert pointed out that ARKK experienced a surge in short sales and the inflows could be explained by unit creation to accommodate short sellers.
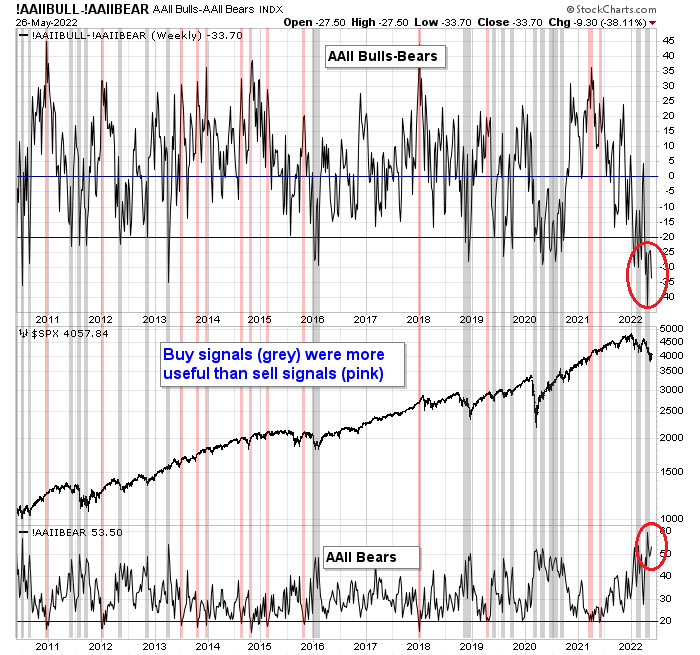
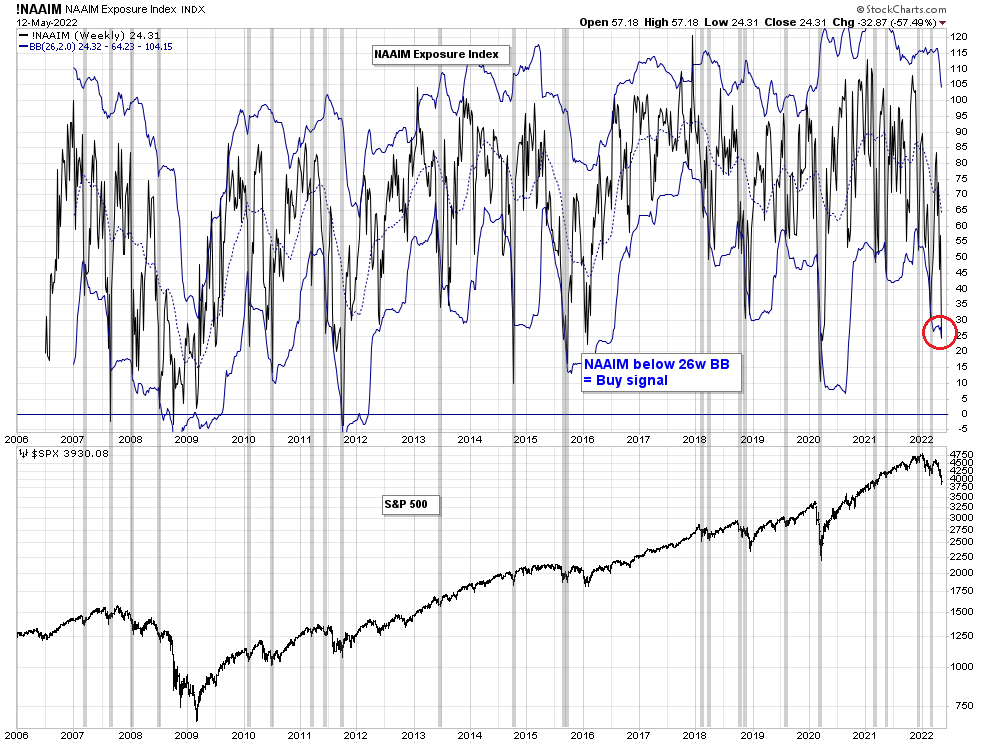
Here’s a sign of capitulation. The NAAIM Exposure Index, which measures the sentiment of RIAs managing individual investor funds, fell below its 26-week Bollinger Band last week. Historically, this has been a buy signal with an excellent track record with strongly bullish risk/reward implications.
SentimenTrader also pointed out that Lipper also reported that investors redeemed $44 billion from equity funds and $39 billion from bond funds in the last six weeks. This is a very unusual condition that only happened four times in the last 20 years, usually at stock market panic bottoms.
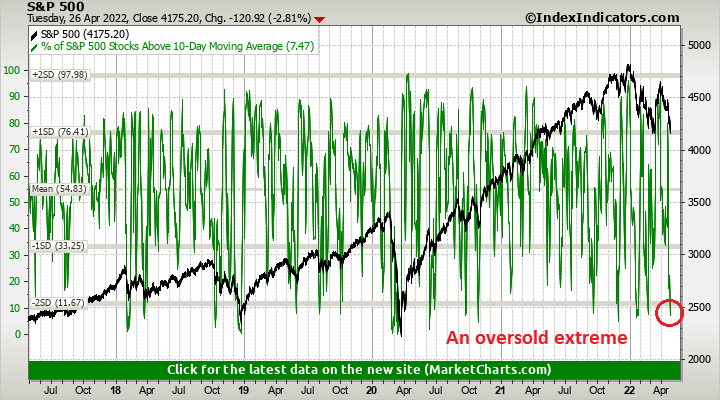
An oversold market
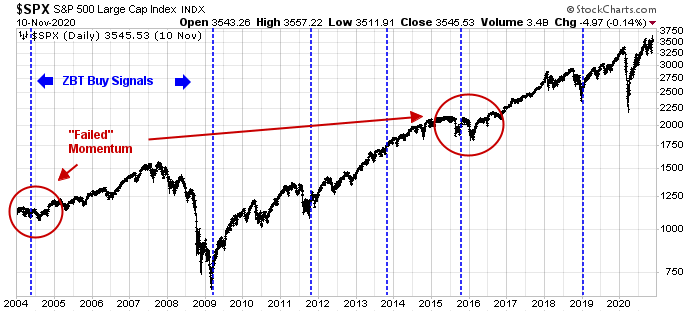
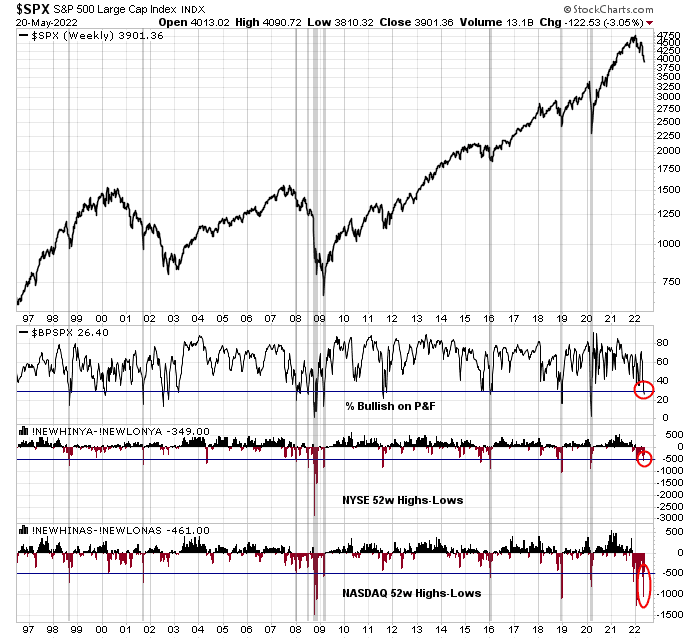
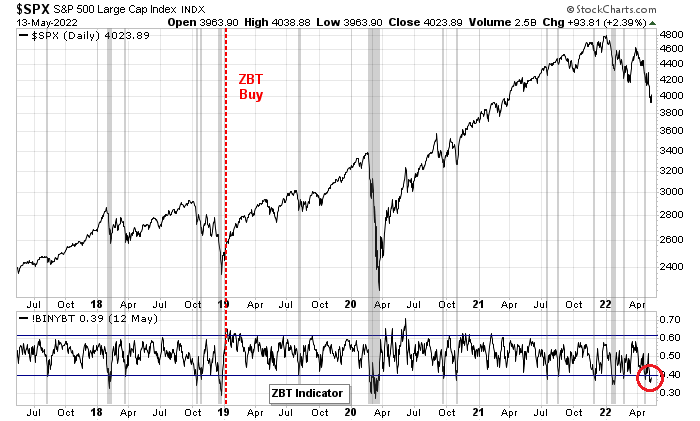
The stock market is oversold by a variety of indicators. One of the most effective trading signals is the Zweig Breadth Thrust Indicator, which has a strong record of marking short-term bottoms in the last five years. Friday’s rebound starts the clock at day 1. The market has 10 trading days to reach an overbought condition for a ZBT buy signal, but don’t hold your breath.
Jonathan Harrier observed that the S&P 500 was down six weeks in a row. There have only been 20 such events since 1950 and the market made it to a seventh consecutive decline on only five occasions. These instances of bearish market action appear exhaustive and they have historically resolved bullishly.
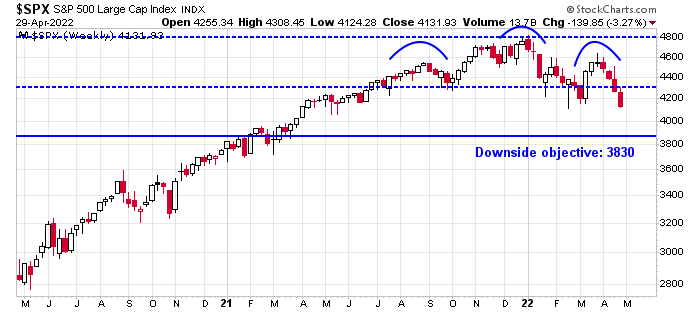
I highlighted the S&P 500 head and shoulders breakdown last week. The pattern showed a measured downside target of about 3830, which is roughly the same region as the Fibonacci retracement level of about 3800. As the 3800-3830 zone is well known to chart watchers, in all likelihood the index will either never reach there or blow past those levels in a downdraft.
Friday’s strong market rebound represents a hopeful sign for the bulls. The NYSE McClellan Oscillator flashed a buy signal by recycling from an oversold condition, with past buy signals of the last two years shown as vertical lines on the chart.
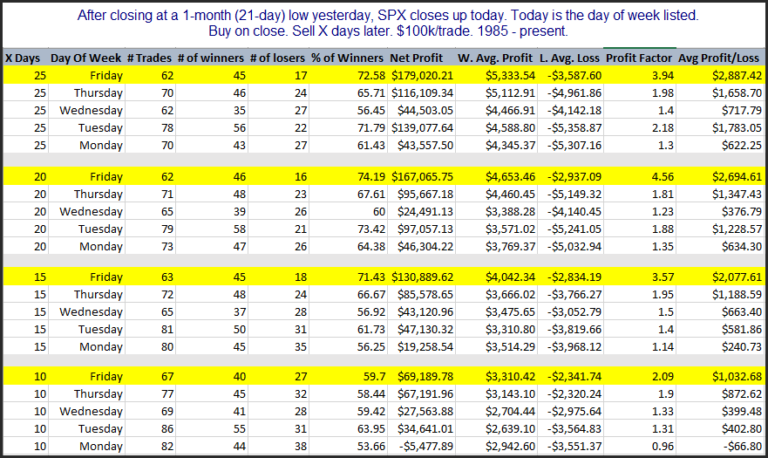
As well, Rob Hanna at
Quantfiable Edges found that Friday rebounds after a 21-day low tend to be far more sustainable over multiple timeframes compared to turnarounds on other weekdays.
In the short run, the VIX Index will have to violate the rising trend line for the bulls to prevail.
Keep an eye on cryptocurrencies, which are experiencing some volatility this weekend. Despite Friday’s strong recovery, cryptos may be the tail that wags the stock market dog.
Portfolio positioning changes
Even though I believe the market is poised for a multi-week relief rally, the combination of deteriorating global equity and commodity prices is a cause for long-term concern.
One disturbing development is the continual decline in bottom-up aggregated EPS estimates. The latest update of S&P 500 consensus EPS estimates from FactSet shows that the Street has reduced EPS estimates for the next three quarters of 2022 for a second week in a row.
New Deal democrat, who maintains a set of coincident, short leading, and long leading indicators, is still on the fence about a recesion call, though “a recession may be in the offing beginning in Q2 of 2023”. There is sufficient evidence for a global slowdown for a sell signal on the Ultimate Market Timing Model. As a reminder, this model issues a sell signal whenever both the Trend Asset Allocation Model is risk-off and a recession is at hand. Investors should sell into the anticipated rally to raise cash and wait for the all-clear to re-enter the market.
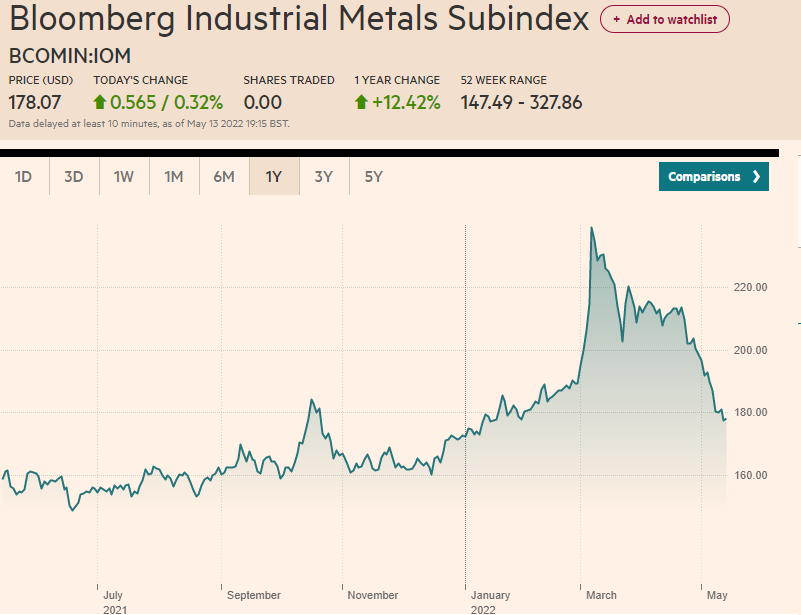
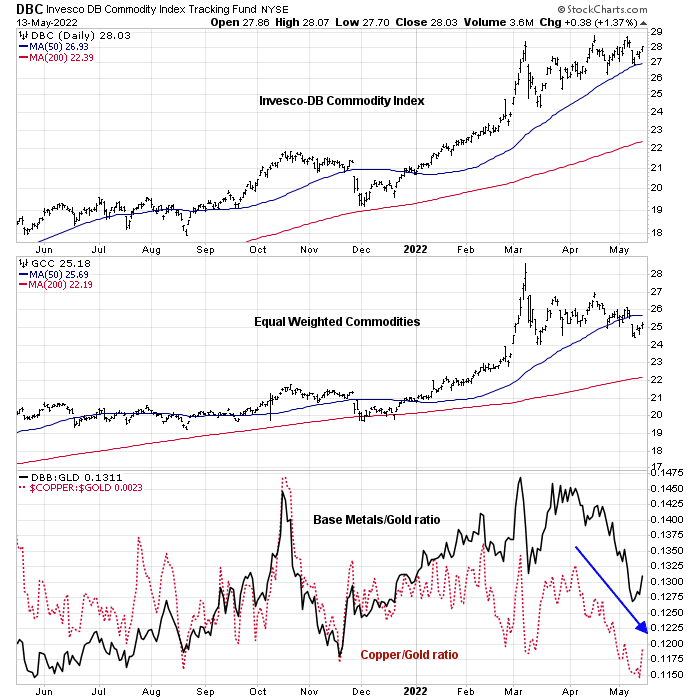
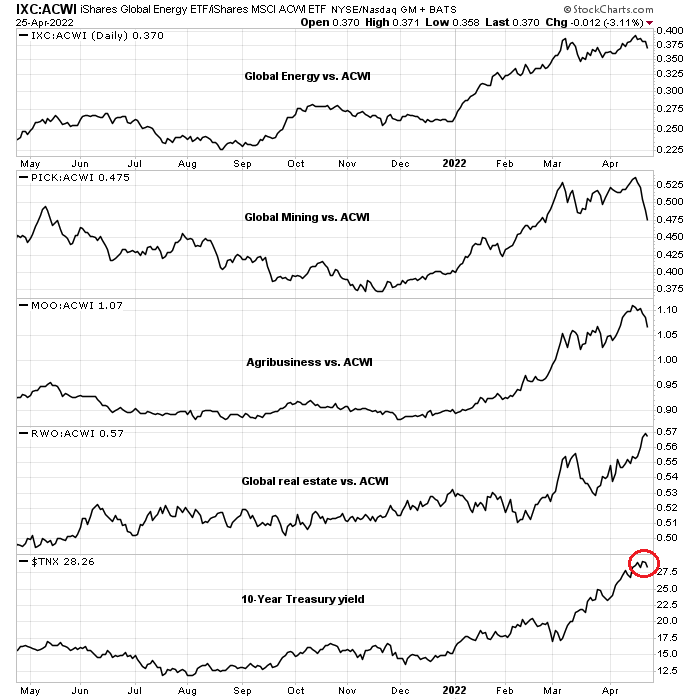
The weakness in commodity prices is also a signal to unwind many of the long commodity and short cyclical pair trades I suggested in the past.
Of the four regional long producer-short importer country pairs and only the long Indonesia and short Vietnam pair has performed well. The other three have faltered and it’s time to close this factor exposure.
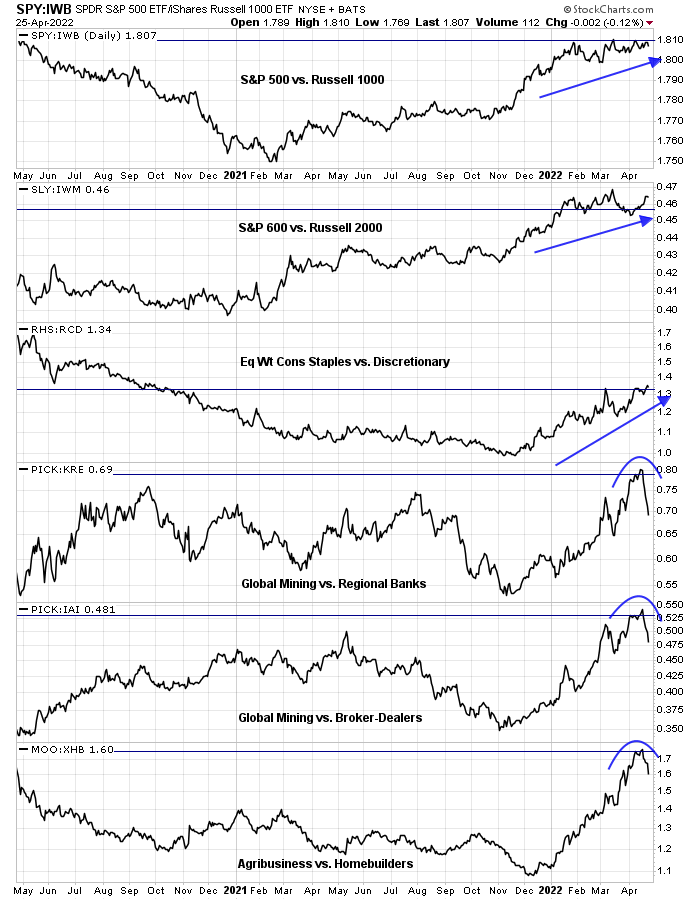
From a US perspective, only the quality pairs of long S&P and short Russell indices and the defensive pair of long consumer staples and short discretionary are performing well. The rest, which are long commodity and short cyclical pairs, are rolling over and should be unwound.
The performance of these pairs underscores the underlying factors that are driving the market. Even the commodity and inflation hedge plays have lost their leadership status. Only high quality and defensive factors remain dominant. I interpret these conditions to mean that while the market may be poised for a relief rally, the bears are still in control of the tape.
Investors should also unwind the long gold and short gold miners pair. The relationship is nearing a short-term resistance level in a very short time that it’s time to take some profits.
In conclusion, signs of possible stabilization in crypto assets and speculative growth stocks are pointing to an imminent equity relief rally. Factor analysis shows that the bears are still in control. Investment-oriented accounts should be cautiously positioned and sell into market strength. Traders can try to position for a relief rally, but don’t overstay the party.
Maintaining risk control
Finally, I would like to add a word about the trading model and positioning. My inner trader was too early in entering his long position and he held his position even as the market fell, and some readers raised the question of a sufficient risk control discipline.
Not every trade works. While the current drawdown may be painful, it leads to a useful lesson about the formulation of a risk control discipline.
Portfolio construction consists two decisions. Deciding on what to buy and sell and how much to buy and sell. A strategy of going all-in on a trade signal and all-out on an exit signal will yield different result than a discipline of scaling in and out of positions. I publish long and short positions to disclose possible conflicts. I don’t publish how I scale in and out of positions because it assumes that we have a similar risk profile.
I know nothing about you. I don’t know your risk preferences. Your pain threshold isn’t my pain threshold. I don’t know your tax situation, or even what jurisdiction you live in. If you try to mirror incremental changes in long and short positions is mirroring my risk profile, which is probably not the same as yours.
That’s why this isn’t investment advice. Otherwise, I would be offering a fund, with all the appropriate risk disclosures so that you can decide on whether it’s appropriate for you.
Disclosure: Long SPXL