Preface: Explaining our market timing models
- Ultimate market timing model: Buy equities
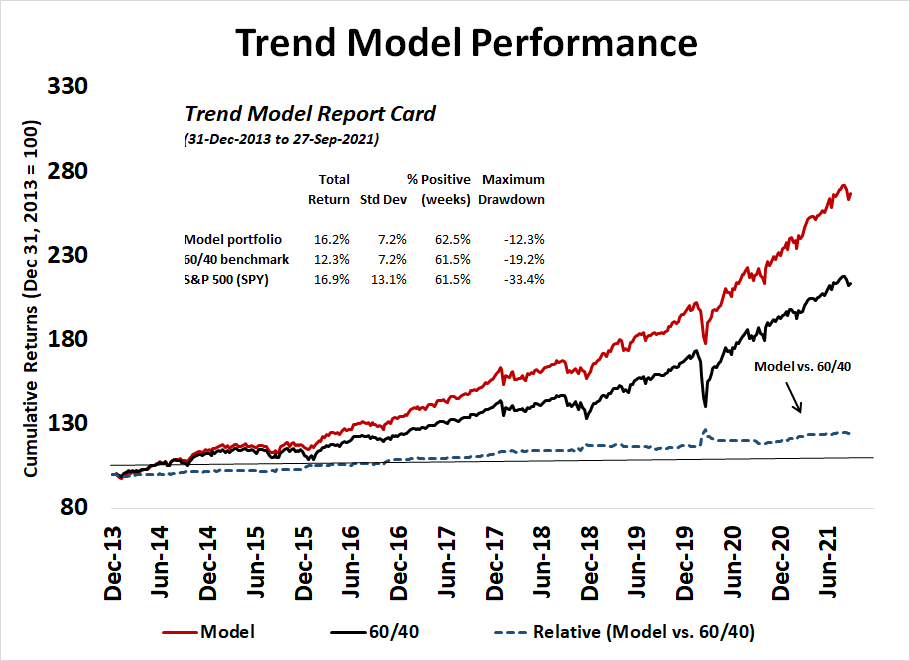
- Trend Model signal: Bullish
- Trading model: Neutral
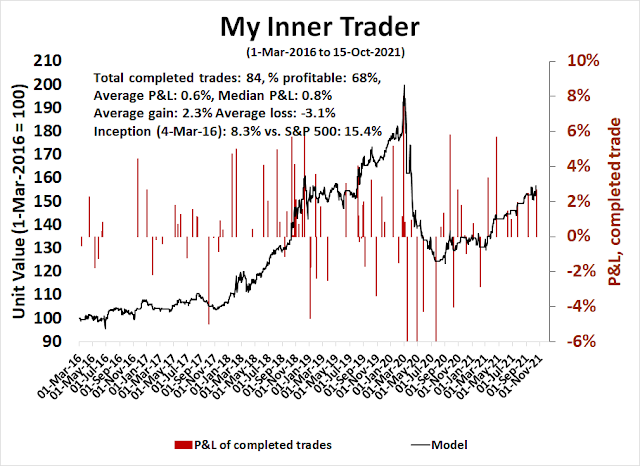
Update schedule: I generally update model readings on my site on weekends and tweet mid-week observations at @humblestudent. Subscribers receive real-time alerts of trading model changes, and a hypothetical trading record of those email alerts is shown here.
Subscribers can access the latest signal in real-time here.
To boldly go?
Revisiting 2011
Then, the macro backdrop was characterized by a debt ceiling impasse in Washington and a Greek Crisis in Europe that threatened the very existence of the eurozone. I can remember endless European summits and plans to make plans for Greece. The news flow worsened and it seemed like no one was in charge in Europe, but the S&P 500 tested support multiple times while exhibiting a series of positive RSI divergences. The logjam was finally broken when the ECB stepped in and announced its LTRO program. Stocks bottomed and never looked back.
History doesn’t repeat itself, but rhymes. Today, the market has been beset by a debt ceiling impasse in Washington and concerns over inflationary pressures which may or may not be transitory from supply chain bottlenecks. The logjam appears to have been temporarily broken when the Democrats and Republicans agreed to kick the can down the road and revisit the debt ceiling question in December. Stock prices duly staged a relief rally.
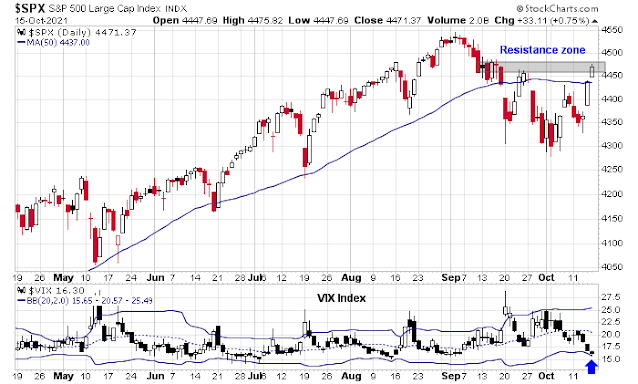
Here is how the 2011 rally played out. After the market bottomed after exhibiting a series of positive RSI divergences, advances were temporarily interrupted when the VIX Index fell below its lower BB. These were short-term cautionary signs whose bearish impulses lasted no more than a few days. Nevertheless, they can be useful tactical signals that the advance had run too far too fast and the market was in need of a breather.

Bullish tripwires
I also outlined two other bullish tripwires last week which have not been triggered. I was looking for bullish confirmation from high-beta small-cap stocks. Small-cap indices had been range-bound for most of this year. While they are outperforming their large-cap counterparts, just as they did in 2011, small-cap stocks have not broken out of their trading range yet.

A market rally sparked by a reflationary narrative should see an upside relative breakout by the growth cyclical semiconductor stocks (bottom panel). For now, semiconductors remain in a narrow range relative to the S&P 500.

It’s too early to sound the all-clear bullish signal just yet.
A bullish setup
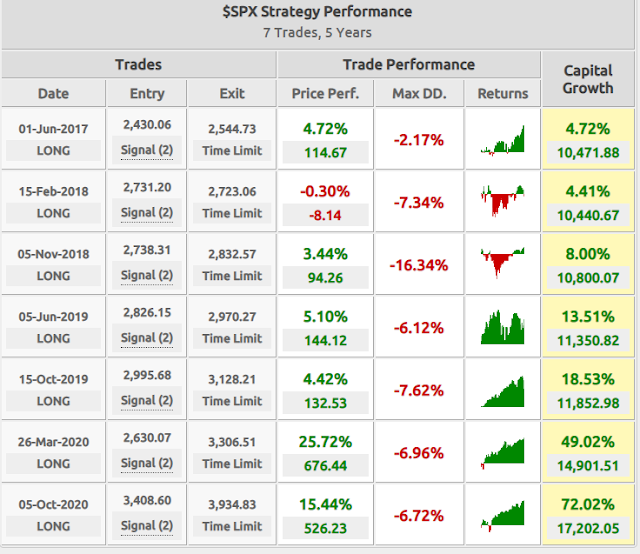
Despite the lack of bullish confirmation, we are moving into a seasonally positive period. In addition, positive price momentum is supportive of further gains. A backtest of instances when the percentage of S&P 500 stocks above their 10 dma rose from below 20% to above 80% within 20 days in the last five years shows an average gain of 9.81% and a success rate of 86% after 90 days (warning: n=7). The 90-day window roughly coincides with the period of positive seasonality that the market is entering.
Sentiment appears to be turning up from a depressed level. IHS Markit conducts a monthly survey of about 100 institutional investors and found that risk appetite bottomed out in September and began to turn up, albeit from very depressed levels. The combination of a turnaround from excessively bearish sentiment and positive price momentum creates the conditions ripe for a FOMO risk-on stampede into year-end.

Bullish and bearish catalysts
There are two catalysts that could decide the near-term direction of the stock market and general risk appetite. Q3 earnings could be a pivotal moment for the market. Earnings growth expectations are still very high by historical standards. Fortunately, for the bulls, estimate revisions are still rising. While this bullish fundamental momentum indicator is positive, readings could change quickly if forward guidance turns sour in the coming weeks.

Street expectations for the S&P 500 are still relatively upbeat. The bottom-up derived 12-month target for the S&P 500 is 5051.70, though the accuracy of this forecast is highly variable. If history is any guide, the S&P 500 will close at between 4567 and 5137 a year from now, which represents a price gain of 2.1% to 14.9%, depending on the choice of lookback period.

As well, keep an eye on the fate of Biden’s legislative agenda, which is mired by infighting between the progressive and centrist wings of the Democratic Party. There are unconfirmed reports that the White House is aiming for some resolution by the end of October. Any positive outcome would be a signal of another fiscal impulse and could spark a risk-on rally. Keep an eye on the infrastructure stocks, which have tested a double bottom relative to the S&P 500 by remain in a downtrend. A failure by Pelosi, Schumer, and Biden to push through their bill would be disappointing for a market that has partially discounted additional fiscal stimulus.

In conclusion, my risk-on scenario remains intact but I am not ready to sound the bullish all-clear just yet. The market is poised for a FOMO stampede into year-end. While I am in the bull camp, investors should nevertheless monitor the evolution of earnings estimates as we move through earnings season and the progress of Biden’s legislative agenda for bullish and bearish catalysts.
Subscribers received an email alert on Friday indicating that my trading account had taken profits in his long positions and moved to cash. The market is a little extended in the short-term and don’t be surprised if the advance consolidates or pulls back next week.
The intermediate-term outlook is still bullish. The market is also started its rally in accordance to its seasonal pattern. If history is any guide, my inner trader expects to buy back in next week if stock prices weaken.

The American (political gridlock), European (fuel prices) and Far East (China real estate) stock markets all have their individual problems that might derail any of their stock markets. One market that is clean of these is Canada.
The last employment report showed they had recovered ALL jobs lost from the pandemic while other regions are still far short. Their recent election reinstalls a left wing plus far left wing coalition that will spend without constraint. Their Central Bank is very dovish. Their balance of trade surplus is a all-time highs (good for their currency) as commodity export prices surge and they are neighbors with the Americans who are spending like drunken sailors.
So they have all the economic positives with none of the speed bumps. It is also a Value weighted index especially of commodity producers. If their market falls, it’s a clear sign of global economic problems (commodity collapse?) especially those caused by higher interest rates since Canadian consumers have extremely high personal debt levels that will be hard hit by rising rates.
Here is my momentum chart of the Canadian market ETF EWC. Keep the link. It updates nightly. I will stay intermediate bullish as long as it keeps doing well.
https://refini.tv/3BdiQtT
The other chart I look at every business day is the CCC Junk bond spread. These are companies that have terrible credit rating and will be the first to be economically stressed. The spreads currently remain very tame. They shoot up before a bear markets or a significant (10% +) intermediate dips.
https://fred.stlouisfed.org/graph/?graph_id=582384&rn=562
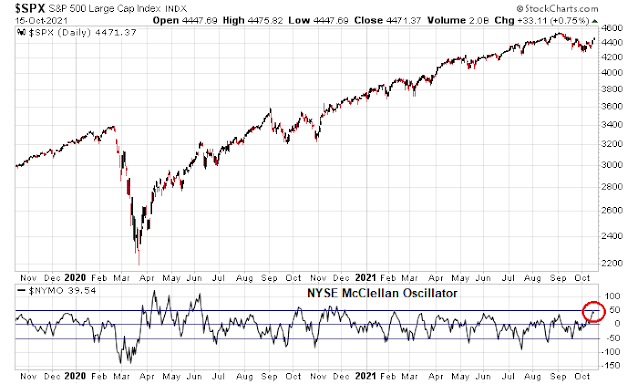
If I am not mistaken, another instance of the backtest signal just got triggered on Friday (Oct 15).
The Jan 2022 Call 470 Strike (SPY) is looking tempting…
Reopening a position in NIO ~39.3x.
Reopening a position in BABA ~167.2x.