Preface: Explaining our market timing models
We maintain several market timing models, each with differing time horizons. The “
Ultimate Market Timing Model” is a long-term market timing model based on the research outlined in our post,
Building the ultimate market timing model. This model tends to generate only a handful of signals each decade.
The
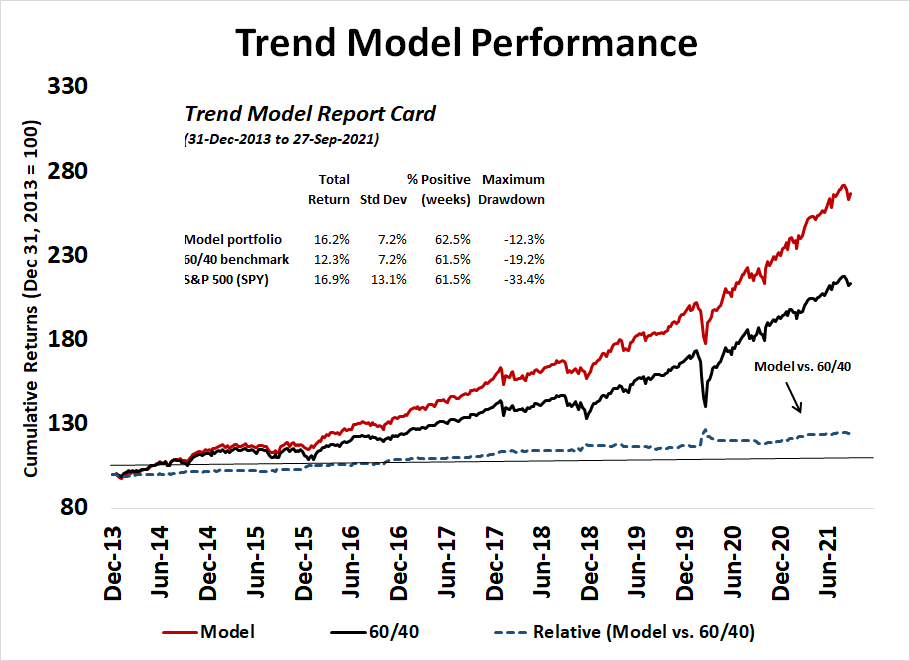
Trend Asset Allocation Model is an asset allocation model that applies trend following principles based on the inputs of global stock and commodity price. This model has a shorter time horizon and tends to turn over about 4-6 times a year. The performance and full details of a model portfolio based on the out-of-sample signals of the Trend Model can be found
here.
My inner trader uses a
trading model, which is a blend of price momentum (is the Trend Model becoming more bullish, or bearish?) and overbought/oversold extremes (don’t buy if the trend is overbought, and vice versa). Subscribers receive real-time alerts of model changes, and a hypothetical trading record of the email alerts is updated weekly
here. The hypothetical trading record of the trading model of the real-time alerts that began in March 2016 is shown below.
The latest signals of each model are as follows:
- Ultimate market timing model: Buy equities
- Trend Model signal: Bullish
- Trading model: Neutral
Update schedule: I generally update model readings on my site on weekends and tweet mid-week observations at @humblestudent. Subscribers receive real-time alerts of trading model changes, and a hypothetical trading record of those email alerts is shown here.
Subscribers can access the latest signal in real-time here.
An asset rotation review
A review of the asset returns on an RRG chart and found a possible inflection point for both equity market leadership and bond prices. As a reminder, I use the Relative Rotation Graphs, or RRG charts, as the primary tool for the analysis of sector and style leadership. As an explanation, RRG charts are a way of depicting the changes in leadership in different groups, such as sectors, countries or regions, or market factors. The charts are organized into four quadrants. The typical group rotation pattern occurs in a clockwise fashion. Leading groups (top right) deteriorate to weakening groups (bottom right), which then rotates to lagging groups (bottom left), which change to improving groups (top left), and finally completes the cycle by improving to leading groups (top right) again.

Here are the main takeaways from the analysis of daily asset returns using a 60/40 US stock/bond mix as a benchmark for USD investors.
- The S&P 500 is in the leading quadrant and shows no signs of weakness. The market is on track for a rally into year-end. The open question is whether value or growth stocks will lead the charge.
- EAFE, or developed market international stocks, is in the improving quadrant, but price momentum is weakish.
- MSCI China is also in the leading quadrant, but it is showing some signs of weakness. Investors are returning to Chinese equities but face considerable risks.
- EM xChina has fallen into the lagging quadrant.
- Bond prices are in the lagging quadrant but showing signs of improvement. In particular, long Treasuries (TLT) is on the verge on rising into the improving quadrant. Much depends on the language from the FOMC meeting in the coming week.
Global equity market review
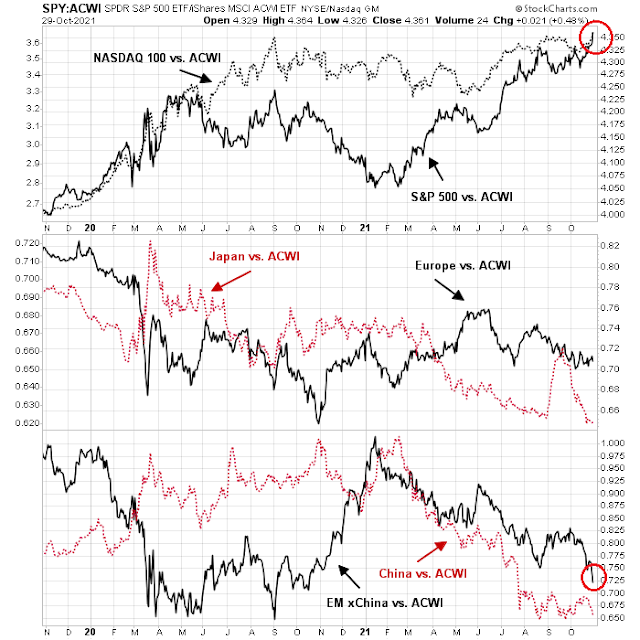
The accompanying chart of the relative returns of different regions compared to the MSCI All-Country World Index (ACWI) is a snapshot of global market leadership. The S&P 500 is strong and staged a relative upside breakout to all-time highs. The two main regions in the EAFE markets are Europe and Japan. European stocks are going nowhere. Japanese stocks surged in anticipation of a change in political leadership but gave all the gains back afterward. China is the heavyweight in EM and it appears to be trying to make a relative bottom. By contrast, EM xChina is weak.
U-S-A! U-S-A!
In the US, strong momentum is supportive of further gains and so are sentiment model conditions.
All Star Charts found an unusual agreement between AAII and Investors Intelligence sentiment readings have led to further price gains.
Both surveys now show bulls in the 40’s and bears in the 20’s. Our sentiment chart of the week shows that when we’ve seen this degree of agreement between these surveys in the past, stocks have tended to do pretty well.
Similarly,
SentimenTrader observed that the NAAIM Exposure Index, which measures the sentiment of RIA advisors, has moved to a levered long condition. Similar past episodes have resolved in a bullish manner.
In addition, Q3 earnings season has been strong. Both EPS and sales beat rates are above average and EPS estimate revisions are rising. This is evidence of fundamental momentum that is supportive of more gains.
In the short-term, the S&P 500 is in a holding pattern after ending an upper Bollinger Band ride which has resolved with either a sideways consolidation or pullback. More ominously, it is exhibiting a negative 5-day RSI divergence. Nevertheless, I remain intermediate-term bullish on US equities.
Emerging markets are weak
While the outlook for international developed market equities is unexciting, the emerging markets outlook much depends on China. China is the heavyweight in EM indices and foreign investor sentiment has changed from an un-investable to a constructive view.
Bloomberg summarized the issues well in an article, “Bulls Return to China’s Markets Just as Risks Start to Multiply”.
On one hand, valuations are becoming more attractive.
On the other hand, investors face considerable risks.
Unlike the rest of the world, China is sticking with plans to eliminate local transmission of Covid-19, even as it battles with sporadic outbreaks. The economy is showing signs of a further slowdown with car and housing sales dropping this month, and a number of economists have lowered their growth forecasts for this year and next.
China is reluctant to stimulate the economy because of a determination to deleverage the housing market and reduce financial risk. The policy has exacerbated the crisis at Evergrande and other indebted developers, with at least four missing dollar debt payments this month. Distressed property firms, which make up about one-third of China’s record dollar bond defaults this year, face a bigger test in January — when maturities more than double from October, according to Citigroup Inc.
The other emerging market countries offer few exciting opportunities from a technical perspective. Of the top three weights in EM xChina that make up about 60% of the index, Taiwan and South Korea are not showing any leadership qualities. The third, India, is exhibiting a choppy and uncertain uptrend relative to ACWI.
Waiting for the FOMC
The RRG chart highlighted a possible bullish setup for bond prices. First, sentiment is at a bearish extreme. The BoA Global Fund Manager Survey revealed that respondents were at a record underweight position in bonds.
Moreover, the high duration 30-year Treasury yield is reversing its recent surge.
Further declines in yields would be bullish for bond prices, but much depends on the language coming from the Fed in the wake of its November FOMC meeting and subsequent press conference. In the wake of a hawkish surprise from the Bank of Canada last week, the market began to price in an aggressive tightening cycle by global central banks as yield curves around the world flattened.
The flattening yield curve has two components. On one hand, rising 2-year yields is a signal that the market expects hawkish pivots from central bankers. On the other hand, falling long bond yields reflect an expectation of slower growth. The market is in effect saying that any early tightening represents a policy mistake and central bankers will have to reverse course and ease policy in the near future.
That’s where the Fed comes in. It has signaled in the past that a QE taper at the November meeting is baked-in and it expects the taper to end in mid-June. The CME’s
Fedwatch Tool shows that the market is discounting rate liftoff at the June FOMC meeting, right when the QE taper is expected to be terminated. If that is indeed the scenario, expect language that accelerates the taper schedule so that it ends before June.
Will policy makers turn hawkish in reaction to market expectations and rising inflation pressures to pull the tightening schedule forward, or will it stay the course, which would be a dovish outcome?
A dovish tone is likely to lead to a steepening yield curve as 2-year yields ease and 10 and 30-year yields rise. In that case, kiss the prospect of a bond market rally goodbye. A hawkish tone would result in a further flattening of the yield curve and a bond market rally.
What will the Fed do? History shows market expectations have been overly hawkish.
The Fed’s tone will also matter to equity market leadership. The value/growth relationship has been correlated to shape of the yield curve. A dovish Fed would be value bullish and a hawkish tone would be growth bullish.
What say you, Jerome Powell?


1st rate analysis Cam cheers.
I am a bit confused by your last statement. If the fed is hawkish & rates rise wouldn’t that be bearish high P/E growth stocks.
rates rise leads to higher discount rates for growth stocks.
good question, I’m also confused, but I’m guessing that hawkish tone couse reduction of rates on the long end – reflecting an expectation of slower growth, which contribute to higher todays value of DCF, isn’t it, Cam? Or not?
A hawkish Fed would raise rates to slow down the economy. A reduced growth would be bullish for High PE (tech) stocks.
I’m guessing that many of the readers here have business degrees, and most have put the education to far better use than I have.
When I returned to Michigan in the late Eighties, it was with the intention of landing on Wall Street. I ended up instead reverting to Main Street, although there are times when I chat with classmates who became wildly successful. A few were even able to semi-retire within 10-15 years with 8- to 9-figure fortunes – CFOs of dot.com companies or among the first American investment bankers in China. Despite the wealth, they’re all generally down-to-earth guys and gals who understand that life is first and foremost about family, loyalty, and treating others right. If you’ve read Cam’s story, they’re all pretty much like him.
There were times in the Nineties when I had serious regrets about not having leveraged the education – in some ways, the ultimate FOMO. When I look back, however, I realize there is one takeaway from those two years that have benefited me in ways I did not expect. The case study approach to learning was big back then (and may still be the case). I spent the winter before my first year reading a book by a Harvard graduate who detailed her two years in the business program. Like her, I had no business background – no prior classes in accounting/ economics/ finance/ IT. Which made no difference to any of her profs. She detailed going home every afternoon to devour entire chapters in introductory textbooks just to get up to speed on topics that she needed to understand in order to prepare her responses to case studies due the following day. It’s a brutal way to learn – yet one that prepares students well for what they will encounter in the real world. To this day, whether it’s dealing with setbacks in the market or even the usual family/ healthcare crisis – I use the skills I learned back then to always have a plan (imperfect as it may be) for the following day. If anyone asks whether I wasted a Michigan MBA, I always tell them it’s one of the most valuable experiences I’ve ever had, and absolutely responsible for many of my successes in life.
Another lesson I’ve learned in conjunction with the above is to refrain from jumping the gun. ‘Waiting for the FOMC’ (even if you’re 80% certain what will happen) is a better move than front-running the outcome. Just wait. There will be plenty of time to game the outcome either the day of or the night after. Cam has done a great job of providing a framework for making our decisions.
Is Michigan ever going back to Rose Bowl under Jim Harbaugh?
That’s a good question!
My youngest brother, now a radiologist in San Diego, was a classmate of Harbaugh’s at Tappan Junior High. For several years, he also resided on the same block in San Mateo as Tom Brady’s parents where they barricaded the street for a party after every win. Funny things is neither one of us ever gave a hoot about football. He’s always been into skateboarding and surfing, and I’m a soccer guy.
A powerful story rxchen2. Thanks for sharing it.
A common successful trait of all of Cam’s subscribers is we all kept learning and searching after we left school. He has subscribers from all over the world that found him somehow and recognized the deep quality of his thinking.
Ken, to what degree is the hawkish Canadian Centralbank a threat to the further development of Canada-ETFs?
Certainly the Canadian dollar is going up because of the relative moves higher in Canadian rates versus US. This helps the return for US investors. The higher rates are not high enough to offset the better economy that is the reason for the BOC hawkishness. When the rates get too high, our housing bubble could pop. That is a future story. Momentum is now on the side of Canada. It’s my top ranked country.
Are you planning any day to set up you Factor and Momentum Strategy in Europe? Maybe a SICAV in Luxemburg?
Thank you very much Ken