Preface: Explaining our market timing models
We maintain several market timing models, each with differing time horizons. The “Ultimate Market Timing Model” is a long-term market timing model based on the research outlined in our post, Building the ultimate market timing model. This model tends to generate only a handful of signals each decade.
The Trend Asset Allocation Model is an asset allocation model that applies trend following principles based on the inputs of global stock and commodity price. This model has a shorter time horizon and tends to turn over about 4-6 times a year. The performance and full details of a model portfolio based on the out-of-sample signals of the Trend Model can be found here.
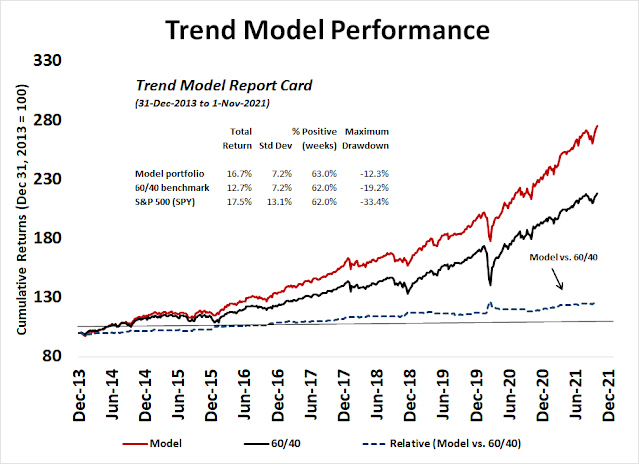
My inner trader uses a trading model, which is a blend of price momentum (is the Trend Model becoming more bullish, or bearish?) and overbought/oversold extremes (don’t buy if the trend is overbought, and vice versa). Subscribers receive real-time alerts of model changes, and a hypothetical trading record of the email alerts is updated weekly here. The hypothetical trading record of the trading model of the real-time alerts that began in March 2016 is shown below.

The latest signals of each model are as follows:
- Ultimate market timing model: Buy equities
- Trend Model signal: Bullish
- Trading model: Bullish
Update schedule: I generally update model readings on my site on weekends and tweet mid-week observations at @humblestudent. Subscribers receive real-time alerts of trading model changes, and a hypothetical trading record of those email alerts is shown here.
Subscribers can access the latest signal in real-time here.
The most wonderful time of the year?
Jurrien Timmer at Fidelity observed that the S&P 500 is roughly following the pattern of a seasonal rally into year-end and beyond. In light of last week’s market weakness, what’s the health of the seasonal rally in 2021?

However, traders who rely on seasonality should be cautious as Ryan Detrick pointed out the middle of November can be choppy.

Bull trend still intact
Let’s start with the big picture. The bull trend remains intact. The market staged upside breakouts through resistance to all-time highs across all market cap bands. All indices are holding above their breakout levels, which is bullish.

Both the Dow and the Transports broke out to new highs. Those breakouts are also holding.

Market internals, such as indicators of equity risk appetite, are confirming the stock market’s newfound strength.

As well, defensive sectors are all in relative downtrends.

A brief setback
The market did flash a brief warning last week when the S&P 500’s 5-day correlation with the VIX and VVIX, which is the volatility of the VIX, spiked. Past instances has seen stock prices either weaken or consolidate.
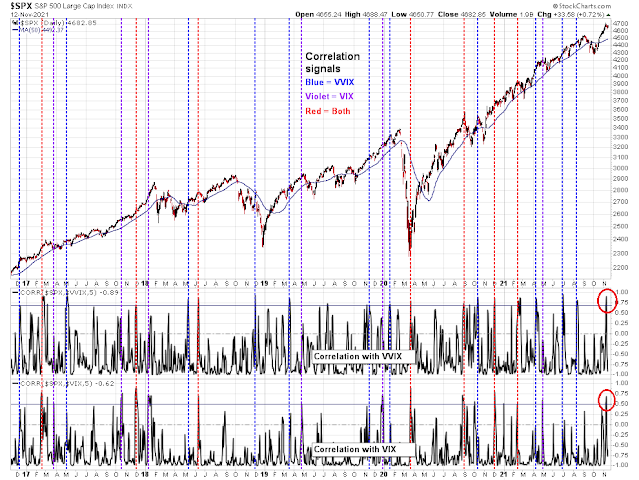
On the other hand, the VIX Index rose above its upper Bollinger Band as the S&P 500 weakened. Such episodes have been signs of an oversold market indicating positive risk/reward for long positions.

The pullback appears to be over, or on its last legs. However, this doesn`t preclude the possibility of the market weakening to re-test the old lows if seasonality calls for some choppiness.
Supportive sentiment
Sentiment models are supportive of further gains in light of the backdrop of strong price momentum. The latest update of AAII weekly sentiment shows rising bullish sentiment and retreating bearish sentiment. However, the bull-bear spread is not extreme enough to warrant caution. In the past, bearish sentiment of 20% or less has been a useful but inconsistent warning sign, but bearish readings have not reached those levels yet.

The TD-Ameritrade IMX, which measures the positioning of that firm’s clients, fell even as the S&P 500 rose to fresh highs. This is a classic sign of the market climbing the proverbial Wall of Worry.

Sentiment is by no means frothy. The combination of positive seasonality, strong price momentum, and skeptical sentiment indicates that there is more upside potential.
All systems go
In conclusion, the upside breakouts of the major market indices are holding. The measured upside objective of the S&P 500 on a point and figure chart varies between 5220 and 5450, depending on how the box size and reversal parameters are set.

All systems are go for the seasonal rally.
Disclosure: Long SPXL
Yesterday’s newsletter mentioned the negative situation in the Chinese High Yield Bond market and how that was a huge worry. Well Friday saw it jump up from 274 to 292 a 7% move in price. The previous two day saw it go sideways for the first time in months. The CSI 300 Chinese Index went up 3% and the Chinese Internet went up 6%.
There has been a couple of significant but not clear TWISTs in my factor monitoring of the Chinese market.
I see that PICK the Global Miners ETF also went up 6% on Thursday/Friday to confirm the Chinese bond and stock leap.
Has the Chinese bear market ended? A bear market ends when the high yield bond market bottoms and keeps on going up showing economic stress receding. In the 2008 GFC bear, the high yield did rally occasionally but kept failing to new lows and that signaled the bear was still ongoing.
I see that last week, 11/11, Single Day at Alibaba (Chinese Black Friday) was up 8% YOY, not good but not bad as a sign of Chinese consumer demand still firm.
As incredible as it seems, the Chinese bear might have ended late last week. That has already given a boost to global markets and commodities and the gift may keep on giving.
If I see the Chinese High Yield Index weakening and especially if it breaks to new lows, I will alert everyone.
Goldman sent out a note to their clients recommending to buy China now, I think that helped spark the rally, but we will be getting retail sales data tonight. Goldman are also saying buy EM as a catch up trade.
An ode to Lael Brainard from Stiglitz:
https://www.project-syndicate.org/commentary/fed-chair-jerome-powell-must-go-by-joseph-e-stiglitz-2021-11
From a timing perspective it may be important to note that analysts are publishing their 2022 outlook notes this week and at least Goldman and Morgan Stanley prefer European and Japanese stocks over US stocks due to valuation concerns. Retail sales plus bond auction this week holds some event risk for US investors and the Nasdaq may be vulnerable to a move in yields. At least I don’t think it is set in stone that TSLA pops back above 1000 and investors may simply have become too complacement with TSLA-like valuations.