Preface: Explaining our market timing models
We maintain several market timing models, each with differing time horizons. The “Ultimate Market Timing Model” is a long-term market timing model based on the research outlined in our post, Building the ultimate market timing model. This model tends to generate only a handful of signals each decade.
The Trend Asset Allocation Model is an asset allocation model that applies trend following principles based on the inputs of global stock and commodity price. This model has a shorter time horizon and tends to turn over about 4-6 times a year. The performance and full details of a model portfolio based on the out-of-sample signals of the Trend Model can be found here.
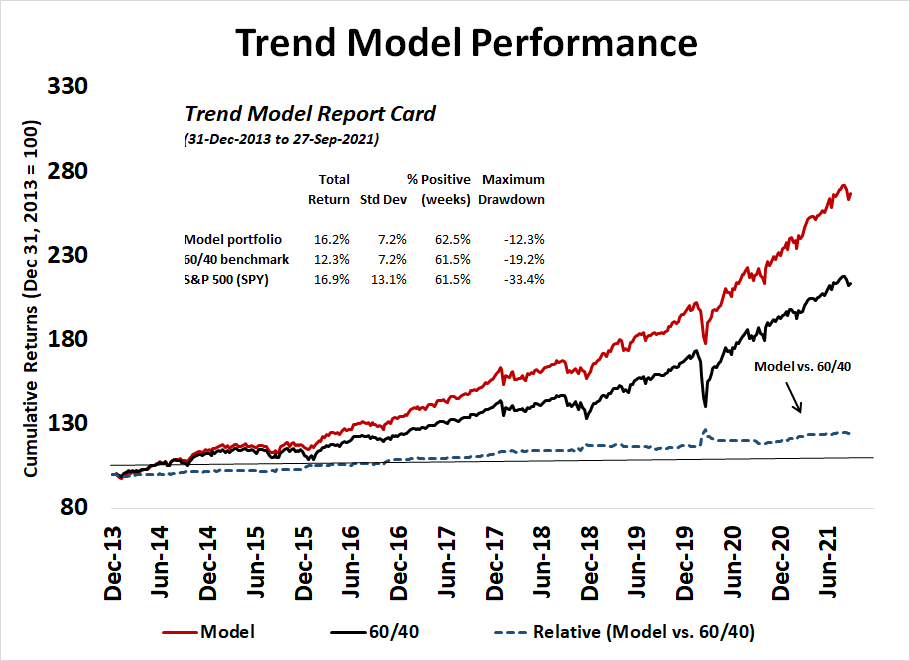
My inner trader uses a trading model, which is a blend of price momentum (is the Trend Model becoming more bullish, or bearish?) and overbought/oversold extremes (don’t buy if the trend is overbought, and vice versa). Subscribers receive real-time alerts of model changes, and a hypothetical trading record of the email alerts is updated weekly here. The hypothetical trading record of the trading model of the real-time alerts that began in March 2016 is shown below.

The latest signals of each model are as follows:
- Ultimate market timing model: Buy equities
- Trend Model signal: Bullish
- Trading model: Neutral
Update schedule: I generally update model readings on my site on weekends and tweet mid-week observations at @humblestudent. Subscribers receive real-time alerts of trading model changes, and a hypothetical trading record of those email alerts is shown here.
Subscribers can access the latest signal in real-time here.
An all-time high
It is said that there is nothing more bullish that an all-time high. The S&P 500 did just that on Thursday. Neither of my warning signals have sounded warnings just yet. The 14-day RSI is not overbought. As well, the VIX Index has not fallen below its lower Bollinger Band.
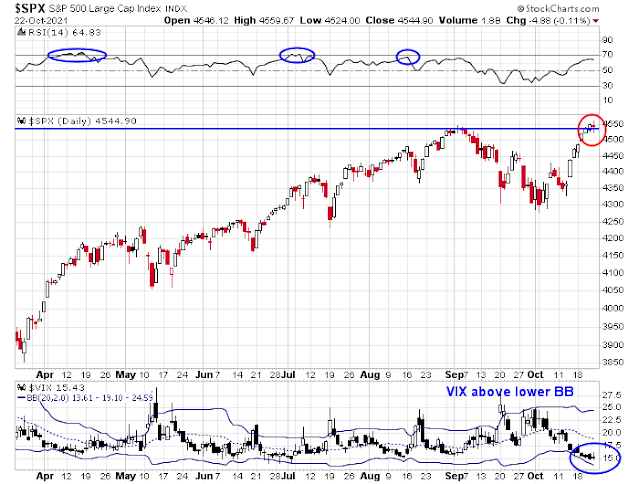
What more could the bulls ask for?
Other bullish signs
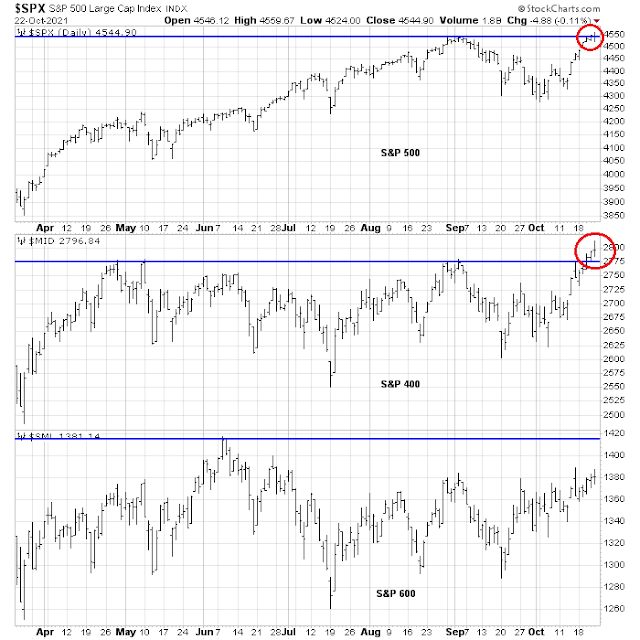
There were other bullish signals confirming the fresh high. A comparison of the S&P 500, mid cap S&P 400, and small cap S&P 600 shows that only the S&P 600 hasn’t achieved a fresh high.
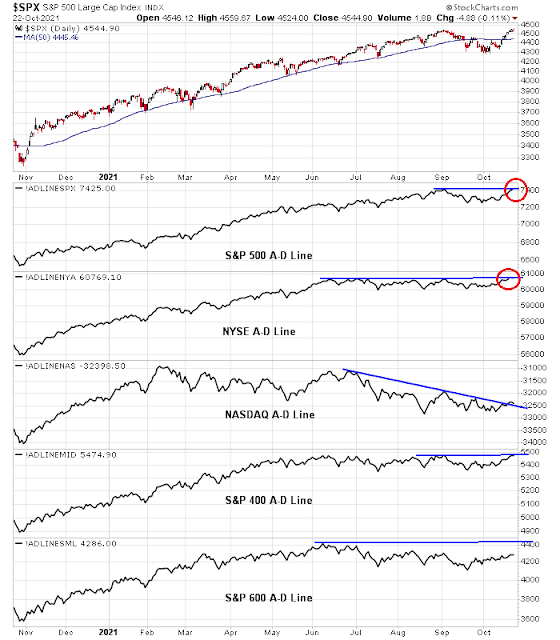
Different versions of the advance-decline lines were also supportive of the bull move. The S&P 500 and NYSE A-D Lines broke out to new highs while the S&P 400 A-D Line is close. Only the NASDAQ and S&P 600 A-D Lines are laggards.
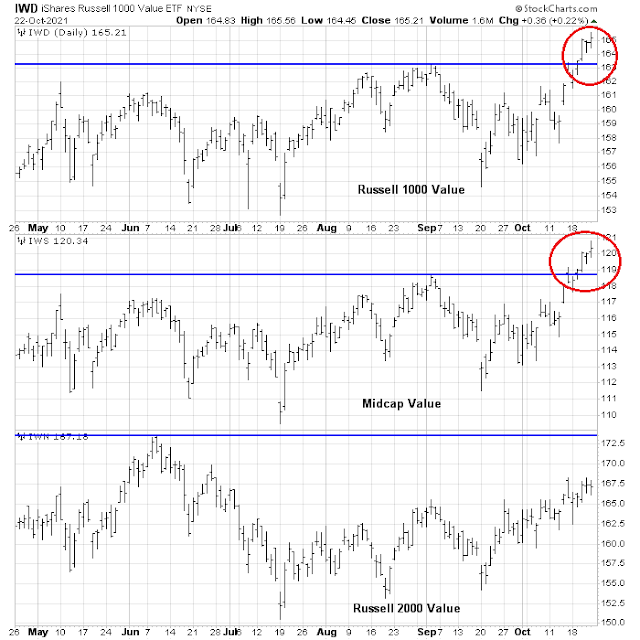
The latest rally is characterized by value stock leadership. Both the large cap Russell 1000 Value Index and Mid-cap Value have broken out to new highs. Small-cap value is lagging.
The bulls couldn’t ask for much more than this.
Uneven legislative progress
On the legislative front, the Democrats continue to squabble over Biden’s Build Back Better legislation. A piece of good news for equity investors is the planned corporate tax increases appears to be off the table.
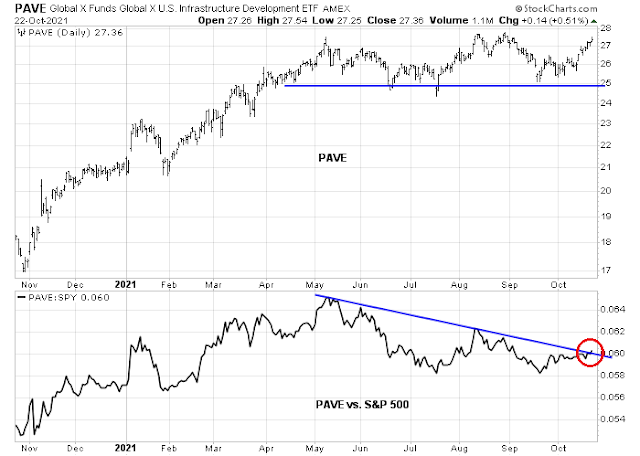
I am monitoring the infrastructure stocks (PAVE), which have staged an upside relative breakout from a falling trend line. Is that a ray of hope that a more pronounced capex cycle is on the way?
Sentiment not extreme = More room to rally
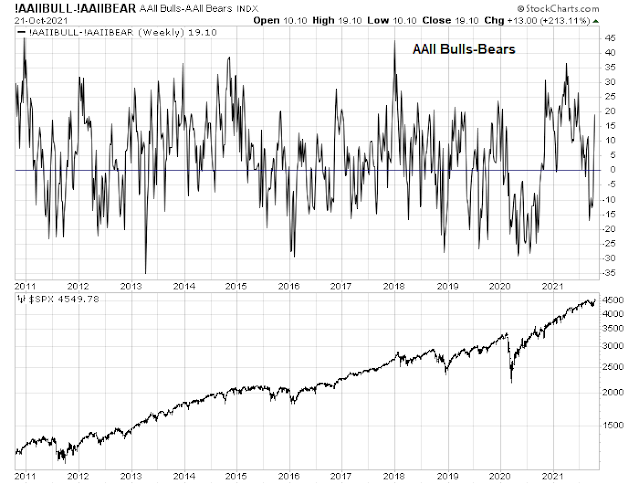
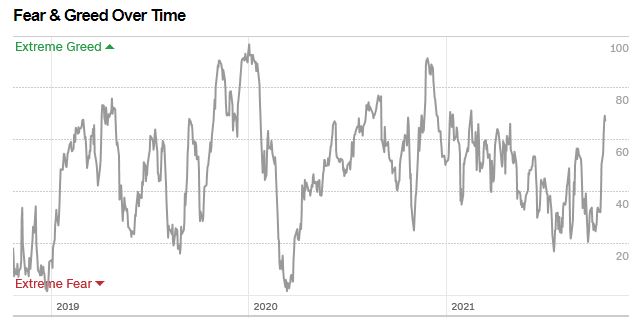
Sentiment is turning bullish, but levels are not extreme enough to flash contrarian bearish warnings. The combination of strong positive momentum and mild sentiment readings are supportive of further gains.
The AAII bull-bear spread is one of many examples of improving sentiment, though conditions don’t indicate a crowded long.
The Fear & Greed Index is another example.
I could go on, but you get the idea.
A pause ahead?
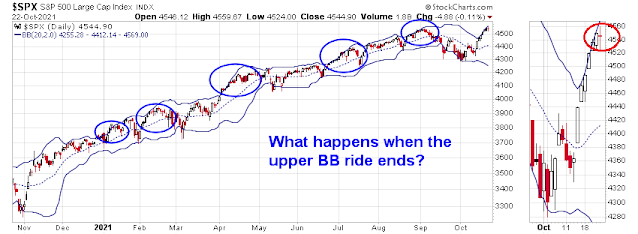
Tactically, the market advance is due for a brief period of consolidation and possible minor pullback. The S&P 500 has been on an upper Bollinger Band ride. At some point in the near future, the ride will end and it may have ended Friday when the S&P 500 was down -0.1%. The market has gone on five upper BB rides in the past year. It has consolidated sideways on three occasions and pulled back on two. The strong underlying strength of the market leads me to believe that a consolidation is the most likely outcome but any pullback should be fairly shallow.
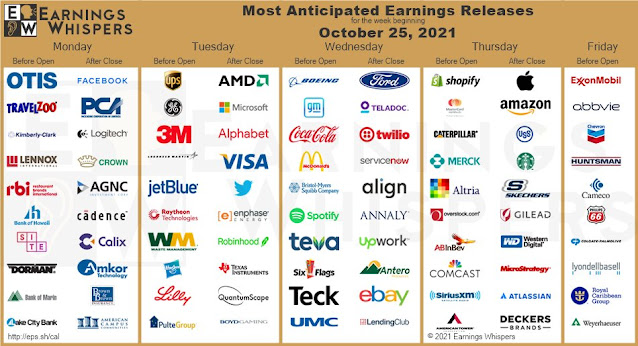
We are in the heart of earnings season next week. While the response to last week’s reports have mostly been positive, don’t be surprised if the market hits an air pocket from an earnings report. In particular, keep an eye on FB (Monday) and GOOGL (Tuesday) in light of last week’s SNAP comments on the advertising environment.
In conclusion, there is nothing more bullish than a fresh high and the S&P 500 has surpassed that hurdle. Tactically, the market can pause its advance at any time but downside risk should be limited. The intermediate term outlook is bullish and traders should be prepared to buy any dip in anticipation of further gains.
>
Something bulls could ask for is the inclusiveness that happens early in a bull market. Instead we are seeing signs of sectors stumbling and possibly entering their own bear markets. This is what happens as we get closer to the end of the bull. I’m not saying that is next week, next month or next year. Factors and Momentum will hopefully reveal the ending close to it happening. I’m just saying even tennis legend Roger Federer is showing some aging problems.
The sectors failing are anything interest rate oriented, Utilities and Staples. They look like pre-bear market.
The meme/Reddit/Robinhood sector looks like the bubble has popped. All of them plunged this week, my guess, when they switched en masse into bitcoin or the Trump SPAC. That shows the fragile support for the meme stocks and the players running out of money .
An associated innovative growth sector, Social Media (Facebook, Google etc) are visibly stumbling and we could be witnessing the unwinding of the huge 2020 outperformance of these ‘stay-at-home’ stocks. They are being targeted for extra global taxes, government oversight, lower ad spends, on and on.
The great Bob Farrell once said bubbles don’t correct by going sideways.
So strong earnings and dovish Central Bankers are helping general market indexes to new highs but with a few cracks appearing.
Ken
Utilities and Staples in a pre-bear market.
Tech is tumbling. Are we on a cusp of a bear market?
I don’t think so. We need economic stressors to arrive to cause a bear market. Take a look at the CCC High Yield Spread (link below). It is very tame. It is a leading indicator of economic stress. If it kicks up, I will become VERY cautious. Until then, I will live with my emotions signaling fear but my objective research saying the bull market proceeds.
https://fred.stlouisfed.org/graph/?graph_id=582384&rn=562
Thanks, Ken.
My compliance department has approved my client performance numbers for my third quarter client update meetings next week. Here are charts to show how my Factor and Momentum Strategy did in the real world. These are real Canadian clients net of fees. My clients follow these two strategies depending on their circumstances.
Model Growth
https://refini.tv/30VYpVc
Model Balanced
https://refini.tv/3jwJ5ET
I expect my clients will be very happy.
I’m particularly proud of my Balanced performance since I’ve avoided the falling bond market by owning fixed income products that go up when interest rates rise that went up over 25% this year as bonds fell. This was what I thought was an easy call (rates going up as economy obviously recovers after a miracle vaccine came along) that many other portfolio managers missed by being slaves to their static stock-bond model strategy. Sometimes new things happen that a professional portfolio manager has to shift (pandemics to avoid or big economic recoveries when a vaccine comes along for example).
I believe this forward-looking flexibility will be critically important over the next few years as a host of new risks and opportunities will arise. Cam is a huge resource for navigating this. My Factor and Momentum research is proving itself as well.
Later this week we will have the US 3rd Quarter GDP announced. The NOWCAST estimate has dropped from over 5% to 0.5% in the last two months. Stock and bond markets might have a big reaction afterwards.
This is a real number after inflation not nominal. I expect a good part of disastrous drop is due to the surprisingly high inflation numbers recently. Using nominal GDP would show continued strong growth.
It’s amazing that so many people that say inflation is transitory and don’t worry then use GDP on a real basis rather than nominal to show how the economic growth is falling from previous estimates. They talk conveniently out of both sides of their mouths. I say, if you think inflation is a distorted temporary factor, use nominal economic stats not real, inflation adjusted ones.
Sorry guys for the verbal diarrhea. My wife is out of town and I’ve got more time on my hands. LOL
Ken,
Your contribution is always appreciated by a large number of subscribers here, if I might take the liberty for others to say. No need to apologize. Besides you are only helping others by providing your constant musings which help us all balance and thrive. Thanks again for all your writings and valuable contribution thus far.
Thank you Mohit. Much appreciated. As I like to say and believe, “We are in this together”
Hello I agree with Mohit. Thanks so much, Ken. And by the way, do you have a site ? If so, let me know it. Best
Sorry Victor, no site.
Spent the day trading in/out of NIO/ QS/ PLTR. I continue to think these stocks are poised for extended run-ups.
Starters in CGC/ HOOD near the close.
Interesting spec play->RDW. Opening a small position after hours ~13.
Adding to existing positions in FXI/ GDX.
Reopening EWZ/ BABA.
Closing the majority of NIO/ QS/ PLTR here. Nothing goes up in a straight line.
Closing RDW ~14.
Partial add-back to NIO.
Now have limit sells on all positions-> basically, I’m disallowing the portfolio to fall below last Friday’s balance and it appears we’re headed that way…
Correction – I’m headed that way…
Needless to say, my stops were hit and glad to have had the foresight to place the limit orders.
Back in cash and will await the next setup.
Classic double top in the Nasdaq 100?
Also, what are the winning sectors this earnings season? Banks, Tesla, transports and solar?
There’s really no way to know whether the weak close will lead to a gap down or Wednesday, or whether the weak close was in fact a buying opp. I would place the odds at 50/50.
5-Year Breakeven Inflation Rate according to FRED broke out last Thursday and closed at a new high yesterday. Above the 2005 highs. Even the NYT had an article about this. I don’t know if this may be a contrarian top indicator – but Powell has warned us multiple times that the Fed is paying attention to these kind of developments.
Getting out of the way as the market turned south near Tuesday’s close clears the head and allows me to now view early indications in FXI/ EEM/ BABA/ NIO/ QS as opportunities. Much nicer start to the day than looking for ways to mitigate damage.
Restarting positions in the above + IWM in the premarket session.
FXI seems to be filling the Oct 18-19 gap.
EWZ. KWEB. JETS.
GDX. CGC.
Adding positions in VTV/ KRE/ XLE.
Adding a position in VT.
Adding substantially to VT.
Revisiting last night’s take->I’m now leaning towards yesterday’s weakness being a buying opp.
I think we see VT ~108+ before a pullback to 106.
Added positions in VTV/ XLE/ KRE.
Basically, leaning aggressively long for the ST.
Adding to BABA/ FXI/ KWEB.
Adding to EWZ.
Second allocations to most positions here. Then sit back and wait.
I view the sustained morning weakness as a potential positive. Another way to discourage boarders prior to lift off.
Looks like I was totally off, and taking a -0.5% hit as a result.
The end-of-day weakness would normally change my view, but in this case it has yet to deter my conviction in an imminent rally. That’s not my usual reaction, so I plan to give the trade a little more time and I’ll let the market action on Thursday make that determination.
If I had to come up with ‘reasons’ it would come down to this:
(a) The market feels oversold to me. Whether or not the usual ‘indicators’ support that view wouldn’t change my take.
(b) Contrary to convention, I don’t believe a weak close is necessarily bearish. We’re still in a long-term uptrend and heading toward positive seasonality. It just feels more like a buying opp.
Of course, price is final arbiter and I’ll change my mind accordingly if it comes to that.