Preface: Explaining our market timing models
We maintain several market timing models, each with differing time horizons. The “Ultimate Market Timing Model” is a long-term market timing model based on the research outlined in our post, Building the ultimate market timing model. This model tends to generate only a handful of signals each decade.
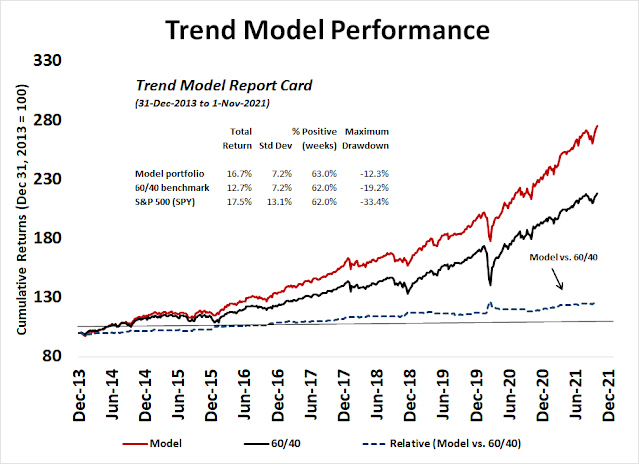
The Trend Asset Allocation Model is an asset allocation model that applies trend following principles based on the inputs of global stock and commodity price. This model has a shorter time horizon and tends to turn over about 4-6 times a year. The performance and full details of a model portfolio based on the out-of-sample signals of the Trend Model can be found here.
My inner trader uses a trading model, which is a blend of price momentum (is the Trend Model becoming more bullish, or bearish?) and overbought/oversold extremes (don’t buy if the trend is overbought, and vice versa). Subscribers receive real-time alerts of model changes, and a hypothetical trading record of the email alerts is updated weekly here. The hypothetical trading record of the trading model of the real-time alerts that began in March 2016 is shown below.

The latest signals of each model are as follows:
- Ultimate market timing model: Buy equities
- Trend Model signal: Bullish
- Trading model: Bullish
Update schedule: I generally update model readings on my site on weekends and tweet mid-week observations at @humblestudent. Subscribers receive real-time alerts of trading model changes, and a hypothetical trading record of those email alerts is shown here.
Subscribers can access the latest signal in real-time here.
Nagging questions of leadership
It is said that the most bullish thing a market could do is to make fresh highs. An even more bullish development is to see the market break out to fresh highs across all spectrums. Indeed, the large-cap S&P 500, mid-cap S&P 400, small-cap S&P 600, and the NASDAQ Composite has achieved all-time highs.

However, discussions with several readers revealed nagging questions about the quality of the leadership in this advance.
A broad advance?
Conventional breadth analysis leads to a bullish conclusion of a broad advance. The Advance-Decline Lines of the S&P 500, NYSE, and S&P 400 have all made all-time highs. Only the NASDAQ and S&P 600 A-D Lines are lagging. The standard interpretation is that most of the troops are advancing with the generals, which is bullish.

However, a review of the relative performance of the top five sectors reveals a less exciting story. As a reminder, the top five sectors make up about three-quarters of S&P 500 weight and it would be virtually impossible for the index to meaningfully rise or fall without their broad participation. The analysis of the top five sectors shows that technology stocks are in a minor relative uptrend and the cap-weight consumer discretionary sector is surging. However, the relative performance of the equal-weighted consumer discretionary sector, which reflects the breadth of the sector, is much weaker. More disturbing is the relative weakness of communication services, healthcare, and financials. The lack of relative strength in financial stocks is disconcerting in light of the Fed’s dovish taper announcement, which should be bullish for the sector.

A more detailed analysis of large-cap strength shows that the recent advance was attributable to only a handful of stocks. A comparison of the relative strength of consumer discretionary to consumer staple stocks, which is often used as an equity risk appetite indicator, shows that most of the strength can be explained by the gargantuan gains of a single stock, Tesla (TSLA). The equal-weight relative performance of the two sectors (bottom panel), while positive, is less clear-cut bullish.

The recent upside breakout of the Dow Transports to all-time highs can be interpreted as a Dow Theory buy signal. However, the strength in that index is attributable to a surge in the price of Avis (CAR). This is another sign of a single stock pulling up an indicator or index.

Similarly, while the strength in the NASDAQ 100 appears bullish, the relative performance of the equal-weighted to cap-weighted NASDAQ 100 has been tanking, which is another sign of narrowing leadership.

Resolving the doubts
How can investors square the question? Is the leadership broad or narrow and what does it mean for the durability of the current market rally? Both statements can be true.
- The stock market is rising with broad participation; and
- Within large caps, the indices are being pulled up by a handful of speculative names.
I interpret these conditions to mean that the stock market can continue to advance, but investors need to be cautious about excess enthusiasm for soaring single stock stories. This environment has distorted factor returns. In particular, the Fed’s recent dovish taper should be bullish for value and cyclical stocks at the expense of growth. Instead, growth has dominated, but that’s because of a handful of stocks.

Under these circumstances, I am inclined to adopt a balanced approach to leadership of both value and growth with a possible small value tilt.
Trading the melt-up
Putting the concerns about leadership quality aside, confirmations are emerging that the stock market is undergoing a melt-up. The S&P 500 has reached the upper Bollinger Band defined by its 200 dma, which is a telltale sign of a market melt-up. In the past five years, there have been six other instances when this has happened. In five of the six, the market topped out when the 14-day RSI flashed a negative divergence. This is a FOMO stampede. Stay long and buy the dip.

The measured objective from a point and figure chart is 5220, which represents an upside potential of 11% from Friday’s closing price.

In the short-term, however, the market is very overbought and the advance could pause at any time. The 5-day RSI is at an extreme, and the 14-day RSI has risen above 70 where advances have temporarily stalled in the last year. One possible trigger of volatility could be the CPI print on Wednesday.

You can tell a lot about the psychology of a market by how it reacts to news. The House of Representatives passed the Infrastructure Bill late Friday, sending it to Biden’s desk for signature. Keep an eye on infrastructure stocks (PAVE) on Monday. Will they be rising in relief that the legislative impasse is over, or will investors sell the news?

In conclusion, the stock market is following the script for a melt-up into year-end. However, market leadership may be changing as selected speculative issues are leading in a massive way. Investors should be positioned bullishly, but adopt a more balanced approach between value and growth.
Disclosure: Long SPXL
https://www.cnbc.com/2021/11/06/op-ed-addressing-climate-change-wont-happen-without-fossil-fuels-or-messy-partisan-politics.html?__source=iosappshare%7Cnet.whatsapp.WhatsApp.ShareExtension
“Forgive senior Saudi officials for their head-scratching in response to the simultaneous and contradictory demands from the Biden administration that Riyadh’s royals pump more oil into the world economy while reducing carbon emissions”.
1. As Western world races to Green energy, fossil fuels are going to become less valuable. What incentive is there for Oil producing nations to keep pumping Petroleum? Wouldn’t these nations like to get the highest price for their product, while the going is good? Are we heading into an energy crisis/price spike?
2. As EV revolution takes hold, are we going to see critical shortages of Copper (may be Lithium, Nickel, Cobalt as well)?
Does BHP look good?
Global Mining ETFs have start to fail badly on momentum rankings and the full blown bear market in China is likely the problem since the are the biggest consumer of metals. Energy, lithium and uranium have kept going , the latter two for green reasons. Regarding BHP, the Far East Region markets including Australia are being sucked down momentum-wise by China’s problems.
Thanks!
The question is for how long China is letting the blood letting (or whatever purge it is engaged in) continue. There has to be a turnaround at some point, restoring Chinese commodity demand.
Beijing is hosting the Winter Olympics from February 4-20. Xi may restrain the largest polluting industries at bay until then. However, the stocks may rally in advance in anticipation of lifting those rules.
Iron ore and some other commodities have failed steeply from the peak but copper seems range-bound so far. IMHO, Copper has great fundamentals (supply deficit, rising demand in EVs, renewables and grid offset by declining demand in China).
Uranium is doing great – rising on its own fundamentals (supply deficit, rising demand as China just announced construction of 150 reactors, and the entry of financial buyers).
The transition to Green Energy is unlikely to be smooth. Some people are already raising concerns whether wind, solar and other forms of green energy can reliably replace the electricity generated from coal, natural gas and nuclear. The security of energy supplies is also a big concern. Do you really want to depend upon sun shining, wind blowing or Putin while it is minus 40 degrees outside?
Over the short- to medium-term, fossil fuels will do well, I think. In the US, shale is starved of capital as investors want return of their capital. They wants the industry to generate profits.
Thanks to ESG concerns, the fossil industry cannot invest enough to ensure supply of fuels during the transition. A lot of our dollars will be flowing to the Kingdom in coming years and probably decades.
Someone needs to sit down and look across all our global energy needs, including the needs for additional metals and energy to build EVs, turbines and solar panels, and determine the right mix / sources of energy during the transition. Otherwise, oil is heading much higher in the coming decade.
Do you think politicians will get it done? EC president von der Leyen is a plagiarist. Her medical degree should be revoked. Do we even need to talk about Biden?
This thing is very complicated and needs cooperation from everyone, and a thorough study and planning. Does the situation look like this, even remotely? When ESG zealots (aided by opportunistic profiteers and power hungry politicians), bordering on Jihad, are using every means possible to railroad everyone else, the outcome is predictable. Ditto current US COVID19 vaccination campaign.
It will be increasingly chaotic and taking a long time to even achieve anything meaningful. The probability is rising for a conflict.
It doesn’t look promising so far. The ESG zealots are just killing the investment in the fossil fuels without having a plan to offset the loss of energy from other/renewable sources.
Yes, I can definitely imagine riots if the oil continues to ratchet up in coming years. $100+ or even higher is possible. It will hurt the middle and working class the most, of course. Well, that might force and concentrate the minds of politicians to finally do something right.
I am hoping an institution or a think tank of some credibility may spend some money to do a thorough study, and come up with a reasonable transition plan. It will take many decades to transition to Greener sources.
It is sad that we have lost the common sense in our society. We cannot even consider the first order effects, let alone 2nd or 3rd order effects of our actions.
Thanks!
Tom Lee estimates, Oil has to go to 252$ a barrel to inflict the same damage as it did at 133 $ circa 2008. We may have a commodity super spike coming (Oil, copper, coal is already buoyant, etc.).
Chinese coal output and inventories have largely recovered, prices are down more than 30% from the highs, I think Cam was spot on with his call that the cover story on the Economist magazine was a signal for the peak of the energy crisis. He also mentioned that oil is expected to return to a surplus situation in 2022. I’m getting more comfortable with the idea that the worst of the energy crisis is behind us.
Plan to close all positions in bond funds today.
Adding to positions in BABA/ PTON.
Reopened a position in CGC as well.
Adding a position in PLTR.
Closing positions in TIP/ IEF.
Adding a position in NIO.
Opening a position in GDX.
Closing PTON for a loss.
Closing CGC for a gain.
Closing GDX for a gain.
Closing PLTR for a loss.
Closing BABA for a loss. My largest gains were on the bond funds.
Back to 100% cash.
Trading is never easy.
Re an earlier question re Series I Savings Bonds-
The annual purchase limit is $10k. However, if you’re expecting at least $5k in tax refunds next year, you can purchase up to another $5k using those funds for a total of $15k per year.
If you have a Trust account, the account is permitted to purchase $10k per year.
And of course, every member of your family is allowed to purchase $10k/yr.
The starting amounts are small – but laddering into the bonds over let’s say 25 years can be an effective means of diversifying wealth into a risk-free asset. And as mentioned earlier, I see it as an attractive alternative to buying LTC insurance – rather than pay $10k per year in premiums (or whatever it is now) for the next 25 years, why not build a reserve fund instead that can be used for any purpose?
Closing GDX for a gain.
Maybe the 10 year yield is more about the amount of fiscal spending and less about current inflation readings. The iShares Automation & Robotics ETF has been doing quite well recently, top positions NVDA and AMD.
Should we sell S&P now?
https://www.newswire.ca/news-releases/evergrande-officially-defaulted-dmsa-is-preparing-bankruptcy-proceedings-against-evergrande-group-805167731.html