Preface: Explaining our market timing models
We maintain several market timing models, each with differing time horizons. The “Ultimate Market Timing Model” is a long-term market timing model based on the research outlined in our post, Building the ultimate market timing model. This model tends to generate only a handful of signals each decade.
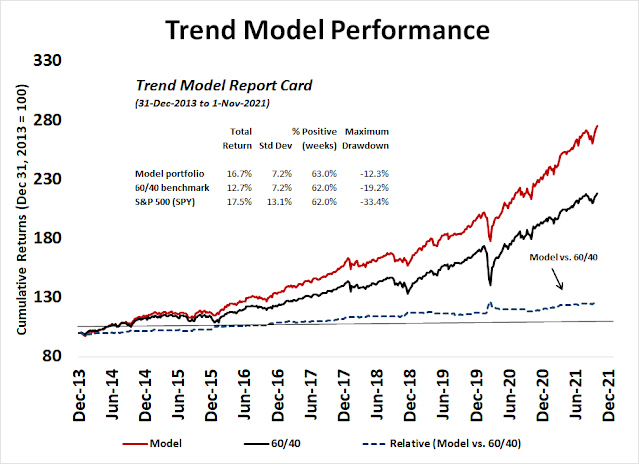
The Trend Asset Allocation Model is an asset allocation model that applies trend following principles based on the inputs of global stock and commodity price. This model has a shorter time horizon and tends to turn over about 4-6 times a year. The performance and full details of a model portfolio based on the out-of-sample signals of the Trend Model can be found here.
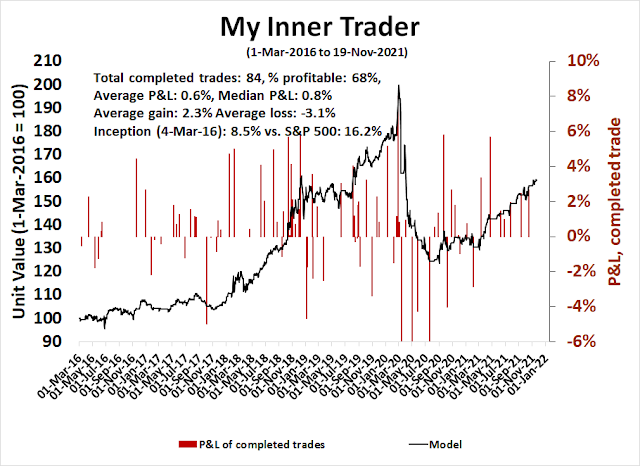
My inner trader uses a trading model, which is a blend of price momentum (is the Trend Model becoming more bullish, or bearish?) and overbought/oversold extremes (don’t buy if the trend is overbought, and vice versa). Subscribers receive real-time alerts of model changes, and a hypothetical trading record of the email alerts is updated weekly here. The hypothetical trading record of the trading model of the real-time alerts that began in March 2016 is shown below.
The latest signals of each model are as follows:
- Ultimate market timing model: Buy equities
- Trend Model signal: Bullish
- Trading model: Bullish
* The performance chart and model readings have been delayed by a week out of respect to our paying subscribers.
Update schedule: I generally update model readings on my site on weekends and tweet mid-week observations at @humblestudent. Subscribers receive real-time alerts of trading model changes, and a hypothetical trading record of those email alerts is shown here.
Subscribers can access the latest signal in real-time here.
Author’s note: There will be no mid-week market update next week because of the holiday-shortened week.
Melt-up risk control
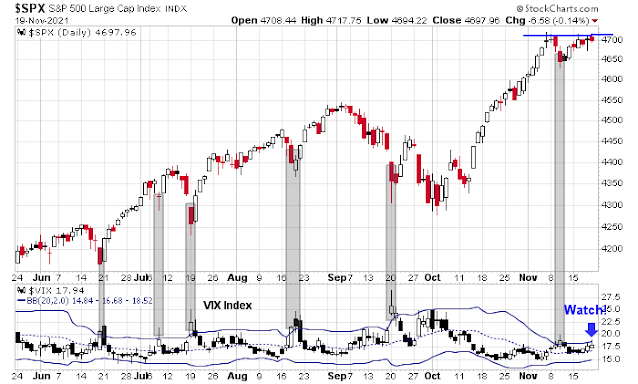
The good news is the S&P 500 is testing resistance and less than 1% from its all-time high. Moreover, the recent sideways consolidation has elevated the VIX Index to near its upper Bollinger Band. An upside breakout of the Bollinger Band would constitute an oversold reading for the stock market that carries with it the prospect of more price gains. The market is presenting investors with an unusual condition of a breakout test while exhibiting a near oversold condition.
The bad news is a number of negative divergences have appeared warning of near-term weakness ahead. Even though a melt-up into year-end remains my base case, investors need to practice some risk control in case the advance unravels.
A case of bad breadth
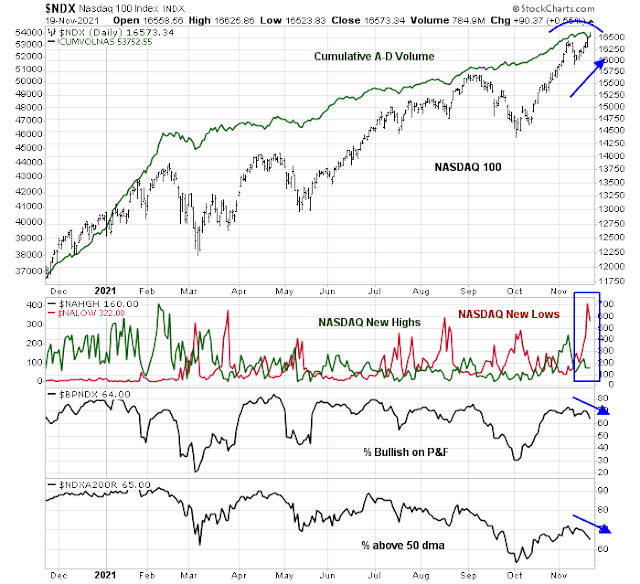
The most glaring problem for the bulls is the narrowness of the market strength last week and this is particularly evident among NASDAQ stocks. The market has been held up by a few large-cap growth stocks. Even as the NASDAQ 100 advanced, every breadth indicator has shown negative divergences.
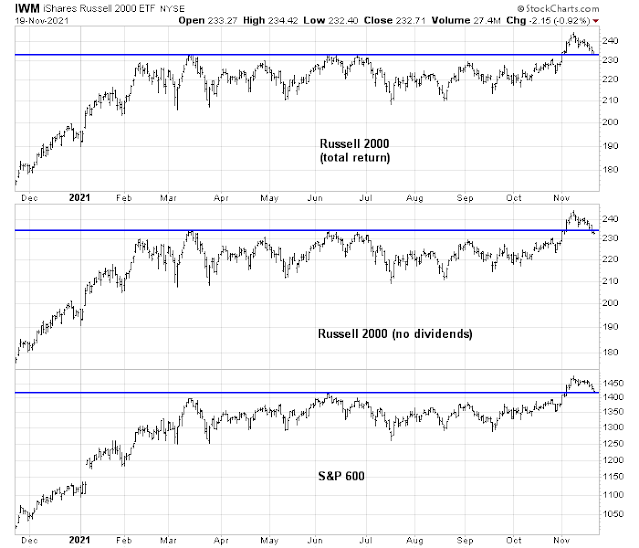
Small-cap indices recently staged an upside breakout but pulled back to test the breakout level. The bulls need to defend these levels, otherwise decisive violations of support could signal a bull trap.
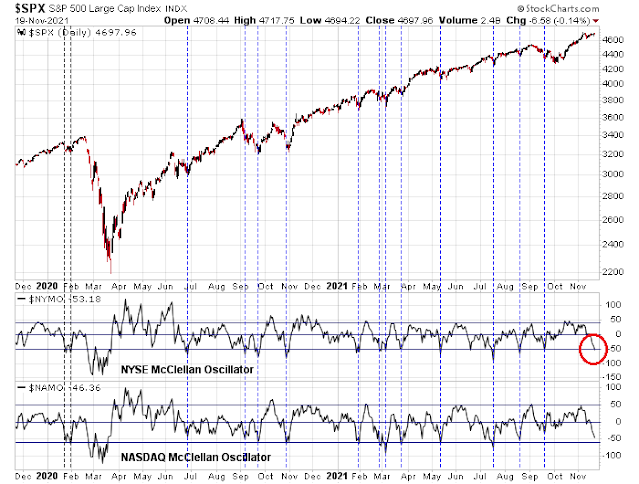
One silver lining in the bad breadth narrative is the NYSE McClellan Oscillator has fallen to an oversold condition. With the exception of the COVID Crash, such readings have been bullish signals in the past two years.
Momentum still positive
As another way of practicing risk control, I present a momentum indicator that can warn of a downdraft should the melt-up fail. I found this momentum indicator to be more effective, timely and generates fewer false signals than similar models such as MACD crossovers and negative RSI divergences.
The accompanying chart shows the ratio of S&P 500 stocks above their 50-day moving average (dma) to S&P 500 stocks above their 150 dma. When the line rises strongly, it is an indication of strong underlying momentum. When it falls, it is signaling weakening momentum. A sell signal is generated when the momentum indicator first rises above 1 and recycles below 0.9. While no model is perfect, this indicator has warned of market downdrafts after strong rallies.
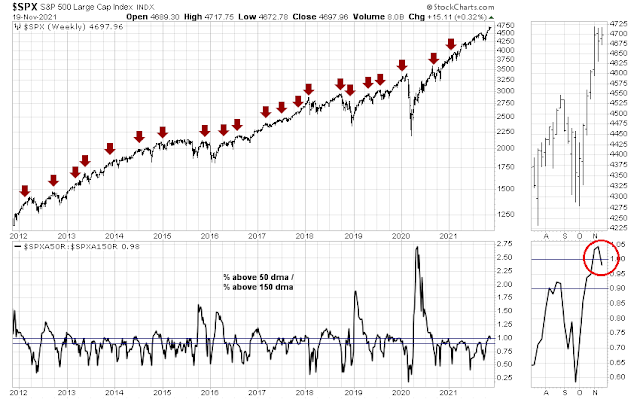
Where are we now? The market is on a buy (rose above 1), but it hasn’t fallen below 0.9 yet. For the time being, I am inclined to give the bull case the benefit of the doubt until this model flashes a sell signal.
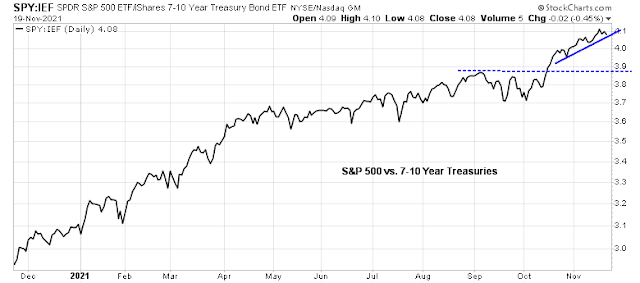
Similarly, the SPY/IEF ratio upside breakout is still holding and it remains in a relative uptrend. Risk appetite is still positive, though it is testing trend line support and needs to be monitored.
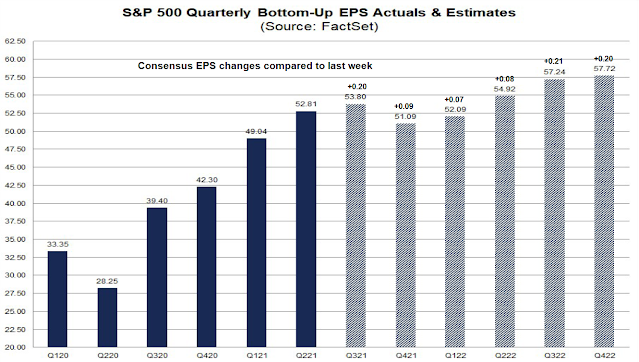
In addition to positive technical momentum, the S&P 500 is also experiencing positive fundamental momentum. FactSet reported that Street analysts revised their aggregated bottom-up quarterly S&P 500 EPS upwards across all time horizons.
Positive seasonality
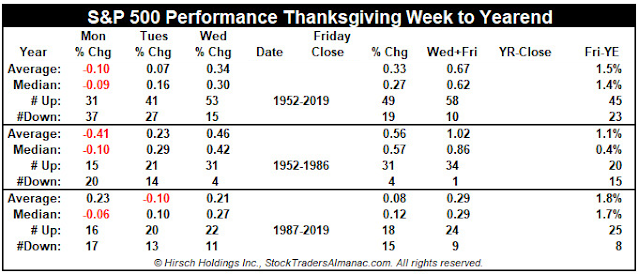
The bulls should totally give up. As Americans prepare to tuck into their Thanksgiving turkey next week, Jeff Hirsch at Almanac Trader pointed out that the market is entering a period of positive seasonality. This summary of Hirsch’s findings shows that stock prices on Monday and Tuesday of the week before Thanksgiving have historically been flat, but Wednesday and Friday of Thanksgiving week have exhibited a bullish bias. However, the period from Thanksgiving to year-end has also been bullish. However, the strength of the rally has been more restrained since 1987 compared to early periods.
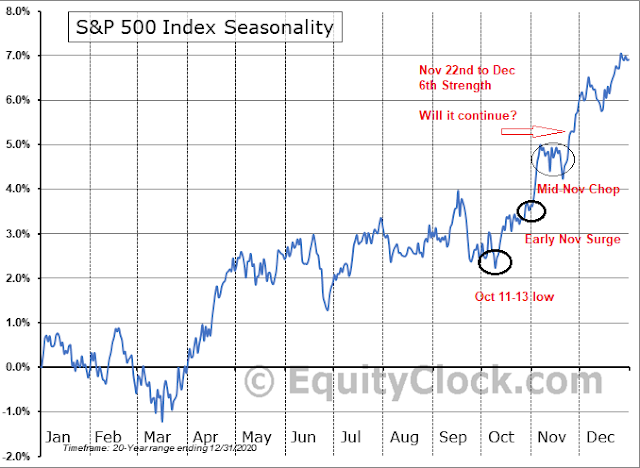
Here is a chart in graphical form, with the caveat that seasonal tendencies are only averages and there can be wide dispersion around average returns.
Climbing a Wall of Worry
Even as equity prices benefit from the tailwind of positive seasonality, sentiment readings are not stretched. The market can rise further as it is climbing the proverbial Wall of Worry.
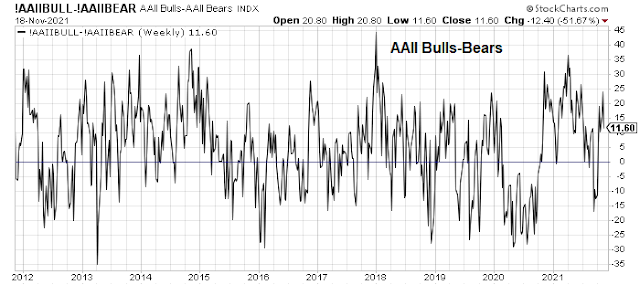
The latest update of weekly AAII sentiment shows a retreat in the bull-bear spread as the market consolidated sideways. This is an indication of skittishness among retail traders during a seasonally strong period.
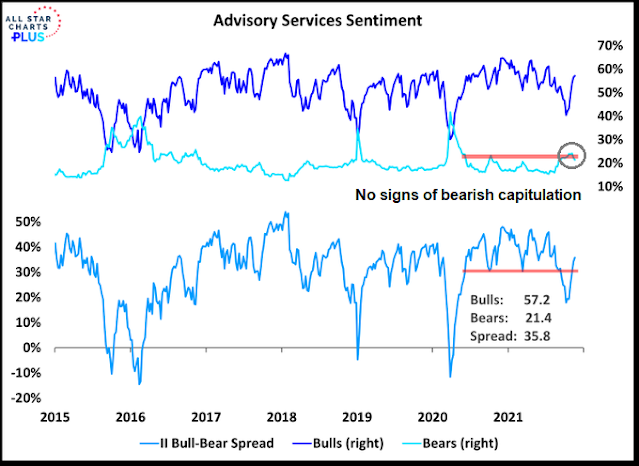
The Investors Intelligence Survey tells a similar story of an elevated level of bearishness. I am not ready to turn cautious until the bears capitulate and turn bullish.
In conclusion, the base case scenario is another year-end rally while enjoying the tailwinds of positive momentum, bullish seasonality, and supportive sentiment conditions. Investors should monitor the market for a loss of momentum, and a decisive violation of small-cap support, which would be cautionary signals to de-risk portfolios.
Disclosure: Long SPXL
While it’s probably not going to spur another vaccine rally the size of the one we saw this time last year, the news about anti viral pills is very very positive. This will have a huge impact worldwide.
https://apple.news/AWj2NL9AHT8SPDZZrtU3fyA
Hi Cam, Thank you for the thoughtful post. For the ” ratio of S&P 500 stocks above their 50-day moving average (dma) to S&P 500 stocks above their 150 dma” indicator:
1) do you have a backtest over the period shown and if so what are results?
2) same question about prior periods (e.g., 2000s).
Thank you. Regards, Matt
…also, any sort of time limit on how long ago the ratio dropped below 1?
If trading the indexes, a narrowing of breadth isn’t necessarily a concern, as studies have shown that as few as 5-10% of stocks account for 80-90% of gains.
On the other hand, if you’re trading individual stocks or even sectors, then it’s a real concern. As breath narrows, then the odds that the stock(s)/sector(s) you’re betting on continue higher start to decline.
Let me share a thought process around Value as a Factor that helps me immensely.
The Value Factor Index is not an index of similar companies. It is not like a herd of sheep that react together. They are economically sensitive companies whose sales go up and down with the economy and are selling at a cheap price. So when a recession (or pandemic hits), their businesses suffer as a group but individually they might have high or low debt that could bankrupt a given company or have businesses that sell non-essential or essential products. We have a wide array of stress on individual companies from little to pushing them towards bankruptcy as a recession progresses.
On Friday, November 6, the trading day before the COVID Vaccine Day Monday, November 9, the outlook for the economy was dire for the weakest Value company stocks in the Value Index. A vaccine was thought to be far off and 60% effective.
On Vaccine Day, everything changed. The outlook improved 1000%. Now we see the Value Index as a whole outperform Growth by a wide margin. But within the Value Index, it is the worst ones that were heading for extinction On November 6, that are soaring most. BTW this also holds true for Small Caps that get pummeled in the bear market.
This is the starting point of every new bull market when the economic outlook changes by government or Fed actions. For the next six months, passive ETFs and indexes will outperform managed money and market neutral indexes because money managers have avoided the crappy companies that are then soaring. Momentum ETFs underperform massively because they own the good companies that were doing best until Vaccine Day. They are backward looking vehicles. A passive ETF by definition own the whole index it mirrors which includes all the sick companies.
This is the dynamic that is happening early in the bull market inside the Value Index.
Flash forward to late spring, six months after Vaccine Day and we see all the crappy companies have had a big run. Some are likely too high now as speculators have jumped on board and the hot money traders expect the economy to magically be great as people get vaccinated. But reality hits and the pandemic keeps going and the people refuse to rush to get vaccinated. The Value stocks start to resort in performance within the index, autos plunge as problems hit, bank go up as defaults fall, etc. etc. All to say, Value is not a big group of similar companies. They perform differently as the market and economic narrative changes.
We are now in the stock market cycle where active managers will outperform because better analyzing and finding better companies will be rewarded with outperformance. They crappy companies will lag now. This is also true of Momentum ETFs and Market Neutral funds outperforming because as the cream of the market rises to the top of momentum performance, the outperformers will keep on outperforming right to the bottom of the next bear market.
Momentum over the last 100 years has outperformed but within each market cycle it does very badly at the beginning of the cycle and then does great for the next two thirds of the market cycle.
So it is now important to be selective within the Value arena. Banks are a homogeneous industry group to play with a passive ETF if you agree with their industry narrative. Consumer Discretionary has companies that are so different and a passive ETF is not the route to go. Materials are better played with sub-industry ETFs or individual stocks since chemicals, mining, plastics, fertilizer are all so different, You get my point.
Understanding the Factor Cycle within the stock market cycle is critical in understanding where you are in the cycle. That includes understanding the internal dynamics of the Value Index. Quants that measure the Factors (Value, Growth, Low Vol and Small Cap) over multi-decade timeframes mathematically, don’t know or appreciate the business cycle dynamics of these Factors and how that knowledge can be so profitable.
Great write-up, thanks. Dumb quants perish and smart quants flourish.
Totally aside, but interesting:
https://www.wired.com/story/norway-electric-vehicle-tax/
Wonderful post. Full of many actionable nuggets. Thank you for sharing your wisdom.
Powell gets the nod.
Whew, very unexpected by me.
I can’t trade the market we have right now.
I guess the market liked Powell, until it didn’t. Algorithms can be so finicky!
The JNK lost support, EEM are at the brink, and IWM has fallen back into a roughly 9 month range. Three different assets signaling risk aversion, VIX Bollinger Band signal notwithstanding.
I am trimming.
I believe positive results from the variant-specific vaccine candidates (expected to come out in Q4, so any day now) could be a positive catalyst for small-caps and cyclicals.
Opening a position in VT.
Betting on->
(a) Turnaround Tuesday.
(b) Seasonality stats for Wednesday +/- Friday.
Adding a second allocation ~106.9x.
Adding a third allocation ~107.3x.
Wow! The GDPNow model estimate for real GDP growth for 4Q 2021 is 8.2%.
That’s quite an acceleration from 3Q growth of 2.0%.
https://www.atlantafed.org/cqer/research/gdpnow
These nowcasts are very noisy and volatile. They don’t mean much until we get near the first GDP release date.
But yes, things are looking up.
News of the new South African variant is about to trump seasonality.
I need to do some hedging trades, the Japanese trading session was bad, but Europe this morning is a bloodbath. If this persists, it looks like markets are pricing in a recession in Europe at least, which seems plausible.
My plan is simple. Closing VT for an indicated -1.7% loss within the next two hours which will knock the portfolio balance back about a percentage point to where it was a month ago. No one can predict the fallout from this new variant and I prefer to sit in cash while it plays out.
I don’t consider selling here as panic. In fact from a personal perspective the decision is about as unemotional as it gets for me. Just seems to be a reasoned and reasonable response to uncertainty in the markets. I think we will see panic at some point- maybe even later today.
If I’d hesitated the portfolio would be down significantly more. When the decision to sell has been made – sell immediately.
Well their goes my quarter. Oh well, live and learn. I stopped out of my positions.
Mildly annoying that I didn’t trim more aggressively last Wednesday as I had posted. I will on an oversold bounce. It’s also part of portfolio rebalance and repositioning.