Recession fears have arrived on Main Street. From a statistical perspective, Google searches for “recession” have spiked.


- Will there be a recession?
- If so, how much of the slowdown is in the market?
- When will the recessionary stock market bottom?
Will there be a recession?
Because of the effect on monthly interest payments, as discussed above, I suspect it will be worse. And that would almost certainly have enough impact on the economy next year to put us close to if not in a recession, all by itself.
In the coming months, I still expect to see a substantial decline in permits. Ordinarily that would be a major negative long leading indicator. But actual construction starts are likely to continue to show strength until the near record backlog has been cleared. Since starts are the actual, hard economic activity, this indicates that housing is still going to make a positive to the economy looking out ahead 12 months.
In fairness, this is an amendment to what I wrote yesterday. Then I noted that there was no “pent-up demand” or “demographic tailwind” present anymore. That is true; but the backlog in construction due to supply shortages will delay any actual downturn affecting economic activity.
With what we know now, my most likely scenario (60%) is a mild recession next year, something like the 2001 recession in severity when the unemployment rate rose two percentage points. We could also easily see a 2-handle on unemployment (under 3 percent) sometime this year. I don’t care what hawks say; that would be amazing. (Note, to complete my forecast: 30% on no recession; 10% on a severe one.)
I wrote in my Sahm Rule post that a mild recession next year was my “most likely” (as in at least 50%) forecast. After a restless night of sleep—yes, I have macro nightmares, I deleted it. Chances are not that high.
After the CPI release I downgraded my “mild recession” to 30% chance.
As Keynes famously said, “When the facts change, I change my mind. What do you do, sir?” While there are many moving parts to my economic forecast, my base case calls for a slowdown to begin in either Q4 2022 or Q1 2023. As to whether the economy weakens into outright recession, as defined by two consecutive quarters of negative GDP growth, the jury is out on that.
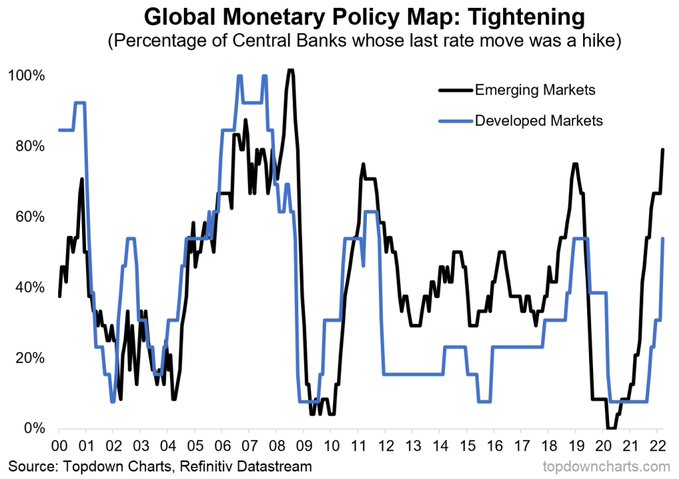
That said. Fed Chair Jerome Powell reinforced his hawkish views at an IMF hosted discussion with ECB President Christine Lagarde, as reported by the WSJ. First, he affirmed that a half-point rate hike is a done deal at the May FOMC meeting and to expect more half-point moves at subsequent meetings.
“It is appropriate in my view to be moving a little more quickly” to raise interest rates than the Fed has in the recent past, Mr. Powell said Thursday. “I also think there’s something in the idea of front-end-loading” the removal of stimulus, he said.
As for the trade-off between recession and fighting inflation, he gave a nod to trying to engineer a soft landing, but gave a higher priority to its price stability mandate.
The Fed is trying to engineer a so-called soft landing in which it slows growth enough to bring down inflation, but not so aggressively that the economy falls into a recession. “I don’t think you’ll hear anyone at the Fed say that that’s straightforward or easy. It’s going to be very challenging,” Mr. Powell said.
Mr. Powell said the Fed is focused above all else on bringing down inflation. “Economies don’t work without price stability,” he said.
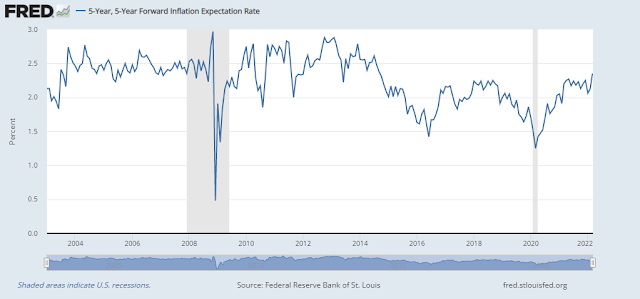
To underline the Fed’s inflation fighting commitment, Powell went on to extol Paul Volcker’s efforts in controlling inflationary expectations.
“Chair Volcker understood that expectations for inflation play a significant role in its persistence,” said Mr. Powell. “He therefore had to fight on two fronts: slaying, as he called it, the ‘inflationary dragon’ and dismantling the public’s belief that elevated inflation was an unfortunate, but immutable, fact of life.”
Mr. Volcker “knew that in order to tame inflation and heal the economy, he had to stay the course,” Mr. Powell said.
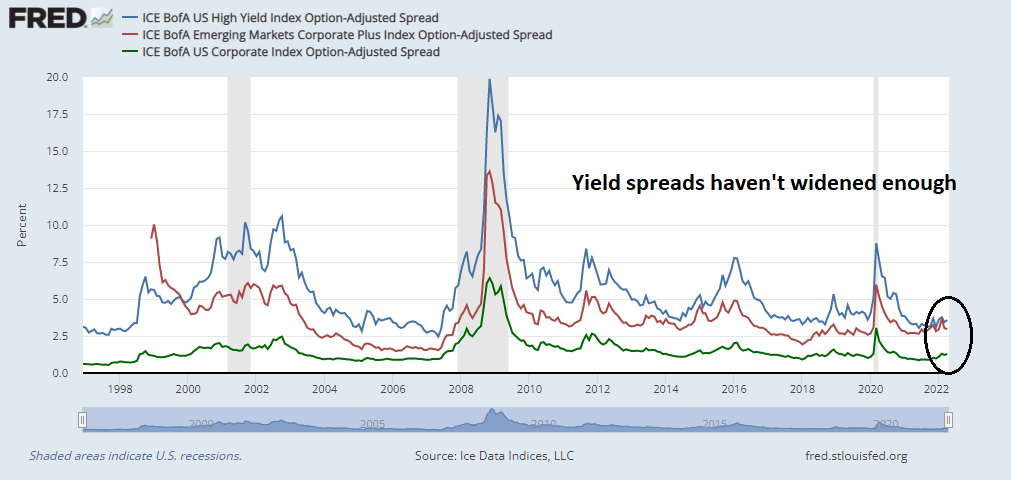
Discounting recession risk
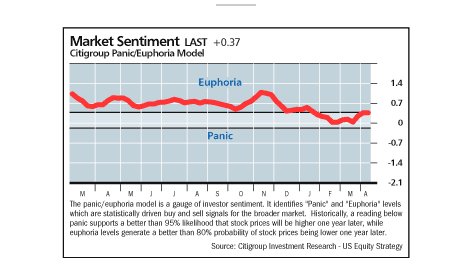
How much recession risk is priced in? I would argue that while recession fears are rising, the market hasn’t fully discounted recession risk at all. The BoA Global Fund Manager Survey showed that while global institutions are all-in on slowdown risk, portfolio positioning can only be described as neutral and not risk-off.

I also highlighted a possible equity valuation shortfall last week (see US equity investors are playing with fire). Based on current consensus S&P 500 EPS estimates and bond yields, the downside valuation risk is -10% to -30%. In the case of a recession, earnings estimates would decline further and raise downside risk, though the fall in earnings would be partly offset by falling yields.

When should you buy?
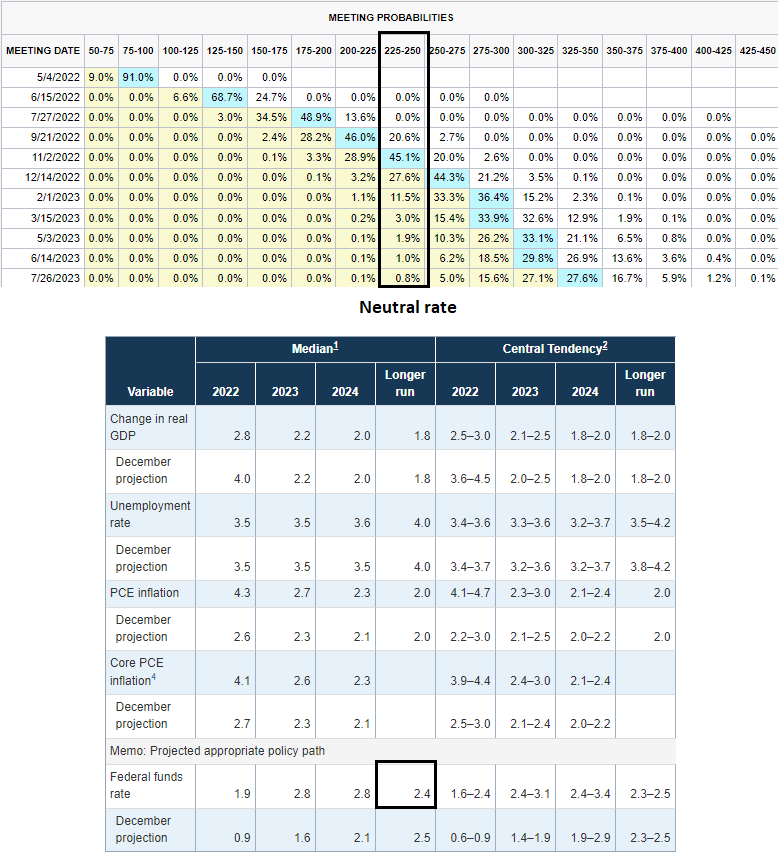
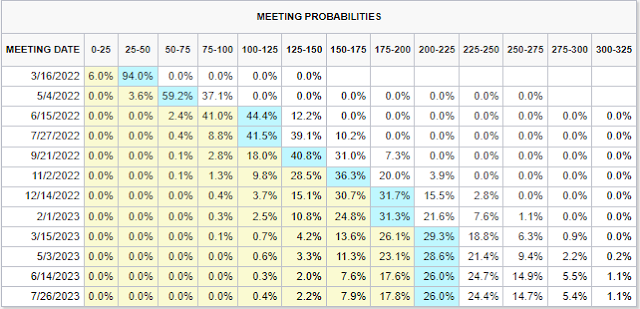
So where does that leave us? Current data indicates that the economy will experience a slowdown by late Q4 or early Q1, though an outright recession is in doubt. However, the Fed Funds futures market is discounting a very hawkish Fed of a half-point rate hike in May, followed by a three-quarter point hike in June, a half-point hike in July, and moderating to a series of quarter-point hikes.

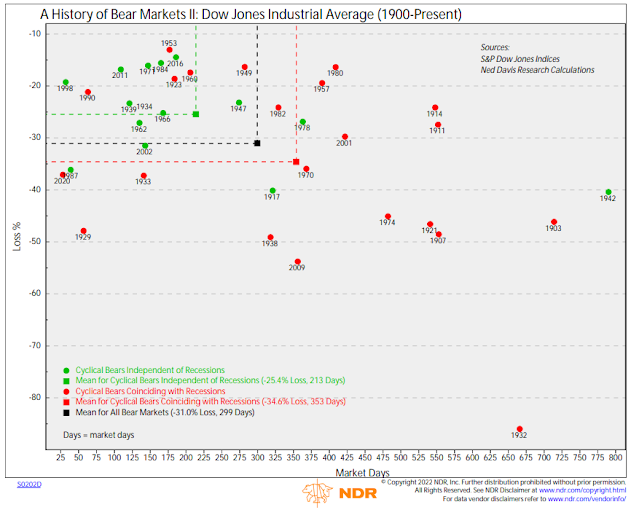
If the Fed’s actions are remotely near what the market expects, it’s difficult to see how the economy won’t avoid a recession. In that case, let’s assume that a recession begins in Q1 and lasts two quarters. As the stock market looks ahead 6-12 months, expect a market bottom some time in Q3 or Q4. This scenario is also consistent with the mid-term election year seasonal pattern of a market bottom in early October.

I also offer two rough guideposts to a market bottom. The first is insider activity. If the stock market were to weaken further, watch for insider buying (blue line) to overwhelm insider selling (red line). While this is an inexact market timing indicator, it does show periods when this group of “smart investors” believe that the long-term risk-reward of owning stocks is favorable.

Another way of spotting a long-term bottom is to watch when the awareness of a recession is well-known by using the Sahm Rule: “If the unemployment rate—the average of the current month and the prior two—is 0.5 percentage points above its lowest value during the previous twelve months, then we are in a recession.” Add to equity allocations when the Sahm Rule indicates a recession (blue line) and when confirmed by a falling 10-year Treasury yield. Like the insider trading rule, the Sahm Rule buy signal will not spot the exact bottom, but it will indicate low-risk entry points for long-term equity investors.

Neither model has flashed buy signals. In the alternative, if the S&P 500 continues to rise from current levels into late Q3 or early Q4, all bets are off. I will have to revisit my assumptions about a recession, economic slowdown, bear market, and equity valuation risk.