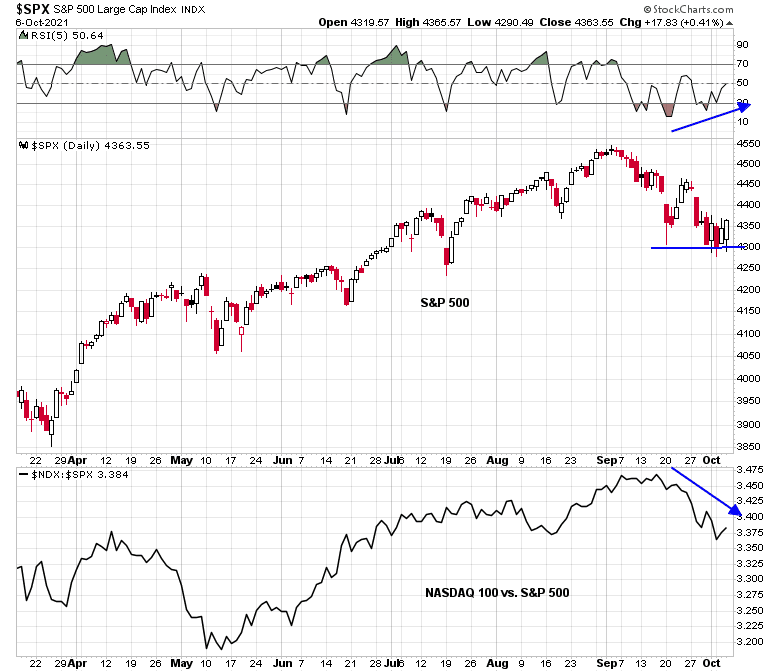
Mid-week market update: As the S&P 500 continues its test of support while exhibiting a positive RSI divergence, one important consideration is what happens to large-cap technology stocks. Large-cap tech and FANG+ account for about 45% of S&P 500 weight, and further weakness could prove to be a drag for the overall market, no matter what happens to the rest of the index.
The long-term picture
The recently publish JPM Asset Management’s quarterly book proved to be a useful reference for this question. Indeed, index concentration in the top 10 stocks is very high and exceeds levels seen at the NASDAQ Bubble top. The forward P/E between the top 10 and the rest of the S&P 500 is also very high, though not as high as the dot-com era. The key difference is the top 10 are deserving of a high valuation, as they account for 26.2% of S&P 500 earnings.

Nevertheless, the relative valuation of growth and value is stretched. The Z-score spread between the forward P/E of growth and value is only exceeded by the dot-com bubble.

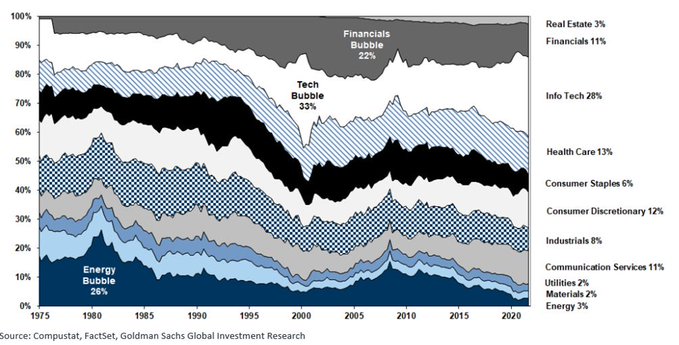
As well, this chart of the history of sector weights also provides some context of the dominance of technology stocks in the S&P 500.
Facebook’s no good, very very bad day
How bad can it get for large-cap growth? Facebook’s experience this week was an example of the threats facing the company and Big Tech in general. Not only did Facebook and other of its properties go down because of a system glitch, but it was also subject to the Senate testimony of whistleblower Frances Haugen who accused the company of choosing “profits over safety”.
Notwithstanding the antitrust threat posed by the issues raised by Haugen to Big Data companies like Facebook, Alphabet, and others, Kevin Roose of the NY Times raised a more important question about the erosion of Facebook’s competitive position.
What I’m talking about is a kind of slow, steady decline that anyone who has ever seen a dying company up close can recognize. It’s a cloud of existential dread that hangs over an organization whose best days are behind it, influencing every managerial priority and product decision and leading to increasingly desperate attempts to find a way out. This kind of decline is not necessarily visible from the outside, but insiders see a hundred small, disquieting signs of it every day — user-hostile growth hacks, frenetic pivots, executive paranoia, the gradual attrition of talented colleagues.
Roose posed the question of why the company is going to such desperate measures to expand its audience?
You can see this vulnerability on display in an installment of The Journal’s series that landed last week. The article, which cited internal Facebook research, revealed that the company has been strategizing about how to market itself to children, referring to preteens as a “valuable but untapped audience.” The article contained plenty of fodder for outrage, including a presentation in which Facebook researchers asked if there was “a way to leverage playdates to drive word of hand/growth among kids?”It’s a crazy-sounding question, but it’s also revealing. Would a confident, thriving social media app need to “leverage playdates,” or concoct elaborate growth strategies aimed at 10-year-olds? If Facebook is so unstoppable, would it really be promoting itself to tweens as — and please read this in the voice of the Steve Buscemi “How do you do, fellow kids?” meme — a “Life Coach for Adulting?”
Why is it going to such desperate means to raise engagement by making people angry?
Take the third article in The Journal’s series, which revealed how Facebook’s 2018 decision to change its News Feed algorithm to emphasize “meaningful social interactions” instead generated a spike in outrage and anger.The algorithm change was portrayed at the time as a noble push for healthier conversations. But internal reports revealed that it was an attempt to reverse a yearslong decline in user engagement. Likes, shares and comments on the platform were falling, as was a metric called “original broadcasts.” Executives tried to reverse the decline by rejiggering the News Feed algorithm to promote content that garnered a lot of comments and reactions, which turned out to mean, roughly, “content that makes people very angry.”
Facebook is in the business of surveillance in order to sell advertising. Google’s business model is the same, though it goes about it in a different way. Amazon tries to find out everything about you to sell you more products. Apple does it in a different way, though the Big Data techniques are similar. Haugen’s testimony is another step that invites antitrust scrutiny.
How bad could it get? Consider’s China’s crackdown on tech. Stonex Group strategist Vincent Deluard gave an illustration of how far P/E ratios could fall in the face of intense regulatory oversight.
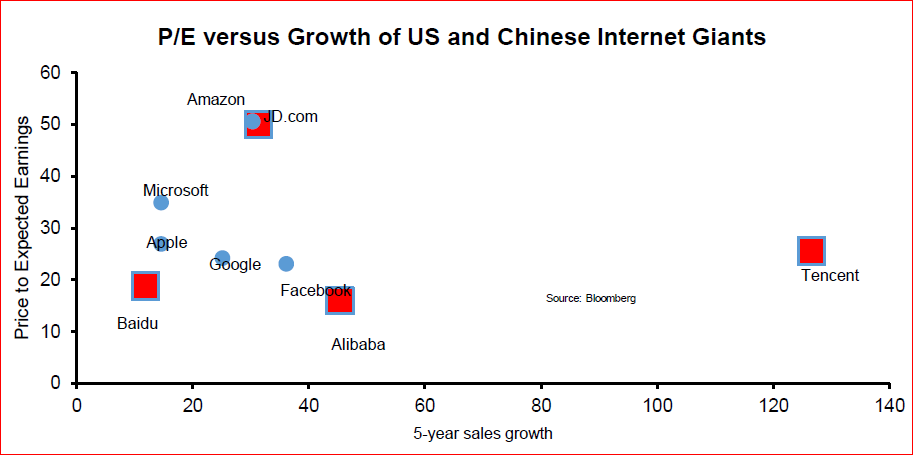
The numbers are noisy and the circumstances are company-specific, but the worst-case analysis could see forward P/E ratios fall by as much as 50%.
A light at the end of the tunnel
In the meantime, an analysis of the relative performance of top five sectors of the S&P 500 shows that only financial stocks are experiencing any positive relative strength. The rest aren’t getting love from the markets. As the top five sectors make up about three-quarters of index weight, the market faces a headwind in advancing.

To be sure, value and cyclical stocks are gaining the upper hand against growth stocks, but value and cyclicals comprise about 32% of S&P 500 index weight compared to 45% for large-cap growth.

The market faces the uncertainty of a possible government default if the debt ceiling isn’t raised. Some signs of movement may be appearing in the standoff. Senate Minority Leader Mitch McConnell offered President Biden and the Democrats two limited paths today to raising the debt ceiling. While there may be further maneuvering by both sides in the coming days, lawmakers appear to be stepping back from the cliff.
If and when a deal is reached, expect a strong relief rally led by cyclicals as they will have the greatest leverage to renewed economic growth. A light is appearing at the end of the tunnel.
Disclosure: Long SPXL
First, I have to congratulate Cam for the timing of his Marketwatch headline post. I may be off by a half hour or so, but it seemed the markets started to lift right after the story hit.
Even prior to opening my latest ill-timed trade, I already had one foot out of the day trading floor. I’ve been inviting stress into my daily life for really no reason at all. In fact, the last few days reminds me of the ‘if I’d only bet black’ mentality of a [real] casino. All my family needs is a solid +5-6% a year to live more than comfortably the rest our of lives. So I’m taking a harder look at how I might accomplish that.
(a) I Bonds as long-term care insurance. If it were possible to sink my entire portfolio into I Bonds, I would. Even at just 20k/yr, my wife and I would have had at least a portion of our net wealth growing at a decent rate risk free. Under current inflation expectations, it’s estimated that I Bonds will return 6% a year – which doubles the amount invested every twelve years or so. By my calculations, investing 20k/yr for the next 25 years at 6% would provide a nest egg of ~$1.2 million when we’re at an age where we may need in-home help. And unlike LTC insurance, if we don’t need/use the money for health care – we can simply use/gift the funds.
(b) There is currently no other asset that will reliably generate a 5-6% return annual return with low volatility – and volatility is what I seek to minimize. However – there may be a way to approximate those conditions. Over the past 12 months, I’ve managed to earn ~+15% return. So I’ve managed to accomplish in one year what I needed to accomplish in close to three. Now that valuations and risk are high, why not step aside until the market invites me back in. There is almost zero stress when we can afford to let prices come to us.
I bond rates are divided into fixed and variable components for a composite yield. How the Fed divvies these two is a mystery. With inflation running hot, I bonds may be yielding 6%, for now, however as inflation cools down, this rate is likely to come down. I doubt that these bonds would yield anywhere close to a consistent 6% over their lifetime.
On the other hand, there may be years when they yield more. I’m just using the latest projections for the next year. The main advantage from my perspective is zero risk of capital losses.
https://www.marketwatch.com/story/this-simple-investment-can-earn-you-more-than-6-with-no-risk-11633443665
I also understand that the vast majority of Cam’s subscribers will be younger than me and looking for far more than 5-6%/yr. Returns will be commensurate with risk. By the time most of you reach your mid-sixties, your main concern will be capital preservation – less likely to risk a field goal attempt/ 4th down conversion and perhaps opt to run out the clock instead.