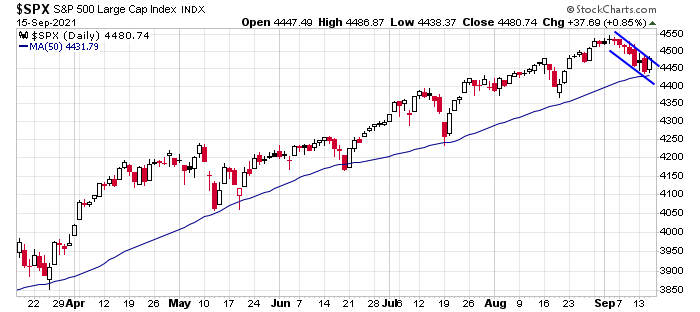
Mid-week market update: As the S&P 500 revisits the area around its 50 dma, will the weakness persist or will it be halted? The index has found good support at the 50 dma all of this year. Equally constructive is the bull flag pattern being traced out by the S&P 500, though the index hasn’t staged an upside breakout through the flag yet.
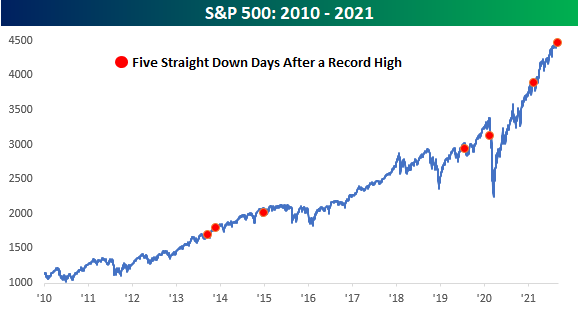
Bespoke pointed out that the most recent losing streak is just the seventh time since the GFC that the S&P 500 closed at a record high and then fell for five consecutive days. The only time the decline didn’t halt was the COVID Crash.
Bearish enough?
Sentiment models indicate that a deep pullback is unlikely. A recent Deutsche Bank survey of institutional investors shows that a 5-10% correction has become the consensus view.

An IHS Markit survey of US investment managers also shows that risk appetite is plunging. The survey readings are consistent the results from trade settlement data.
The IMI survey results align with the equity trade settlement data we analyze on behalf of our 850 US-listed clients, representing $22T in market capitalization. During the first week of September, institutional investors reduced exposure to nine out of ten macro sectors with the consumer discretionary and industrial sectors experiencing their fifth consecutive week of outflows.

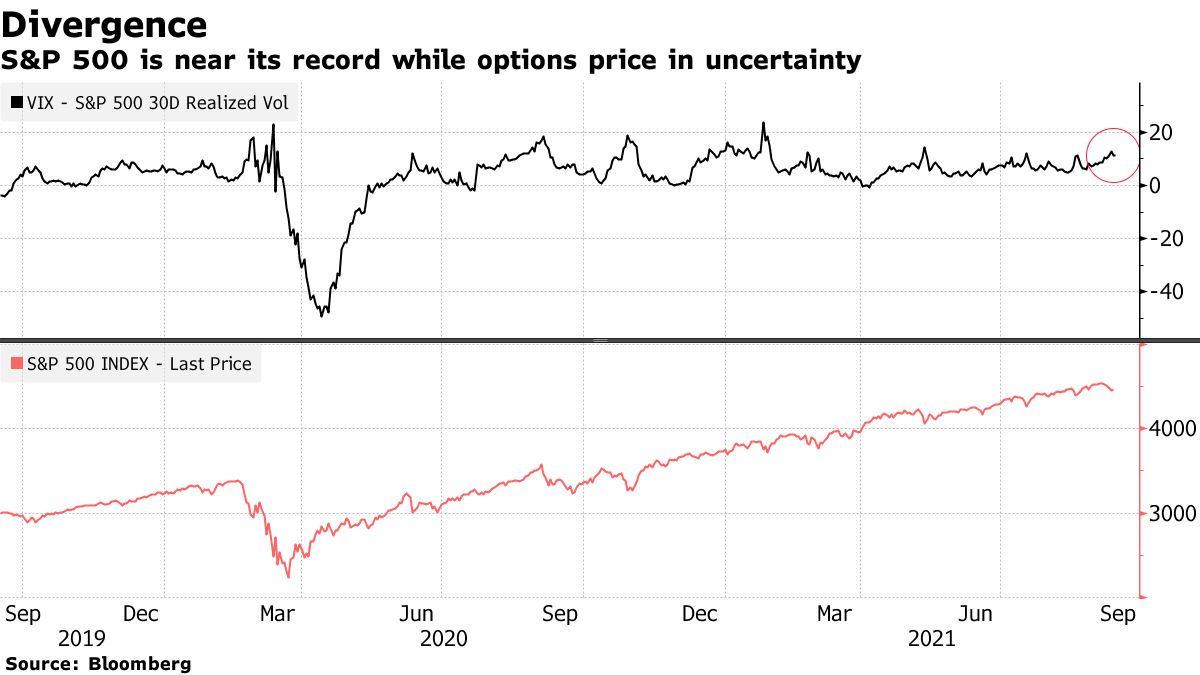
Bloomberg reported that Jason Goepfert observed a dramatic increase in nervousness in the option market. The spread between the VIX Index and realized volatility is highly elevated.
Sundial looked at what happened before when the S&P 500 was within 1% of a record and the Cboe Volatility Index’s divergence from S&P 500 30-day realized volatility was in the upper 75% of its range.
That scenario’s occurrence last week was the ninth time it had manifested going back to at least 1995. Over the previous eight instances, the next one to four weeks saw the S&P struggle to hold any meaningful gains. But over the next two months, it rallied every time, Sundial’s Goepfert said. There were no occasions when major losses hit equities over the longer term.
In the short run, sentiment is nearing a bearish extreme. Helene Meisler conducts an (unscientific) Twitter poll every weekend. The latest results show a net bull rating of -18. In the brief history of the poll, the market has rallied whenever the reading is -10 or less. Will this week be an exception?

One final flush?
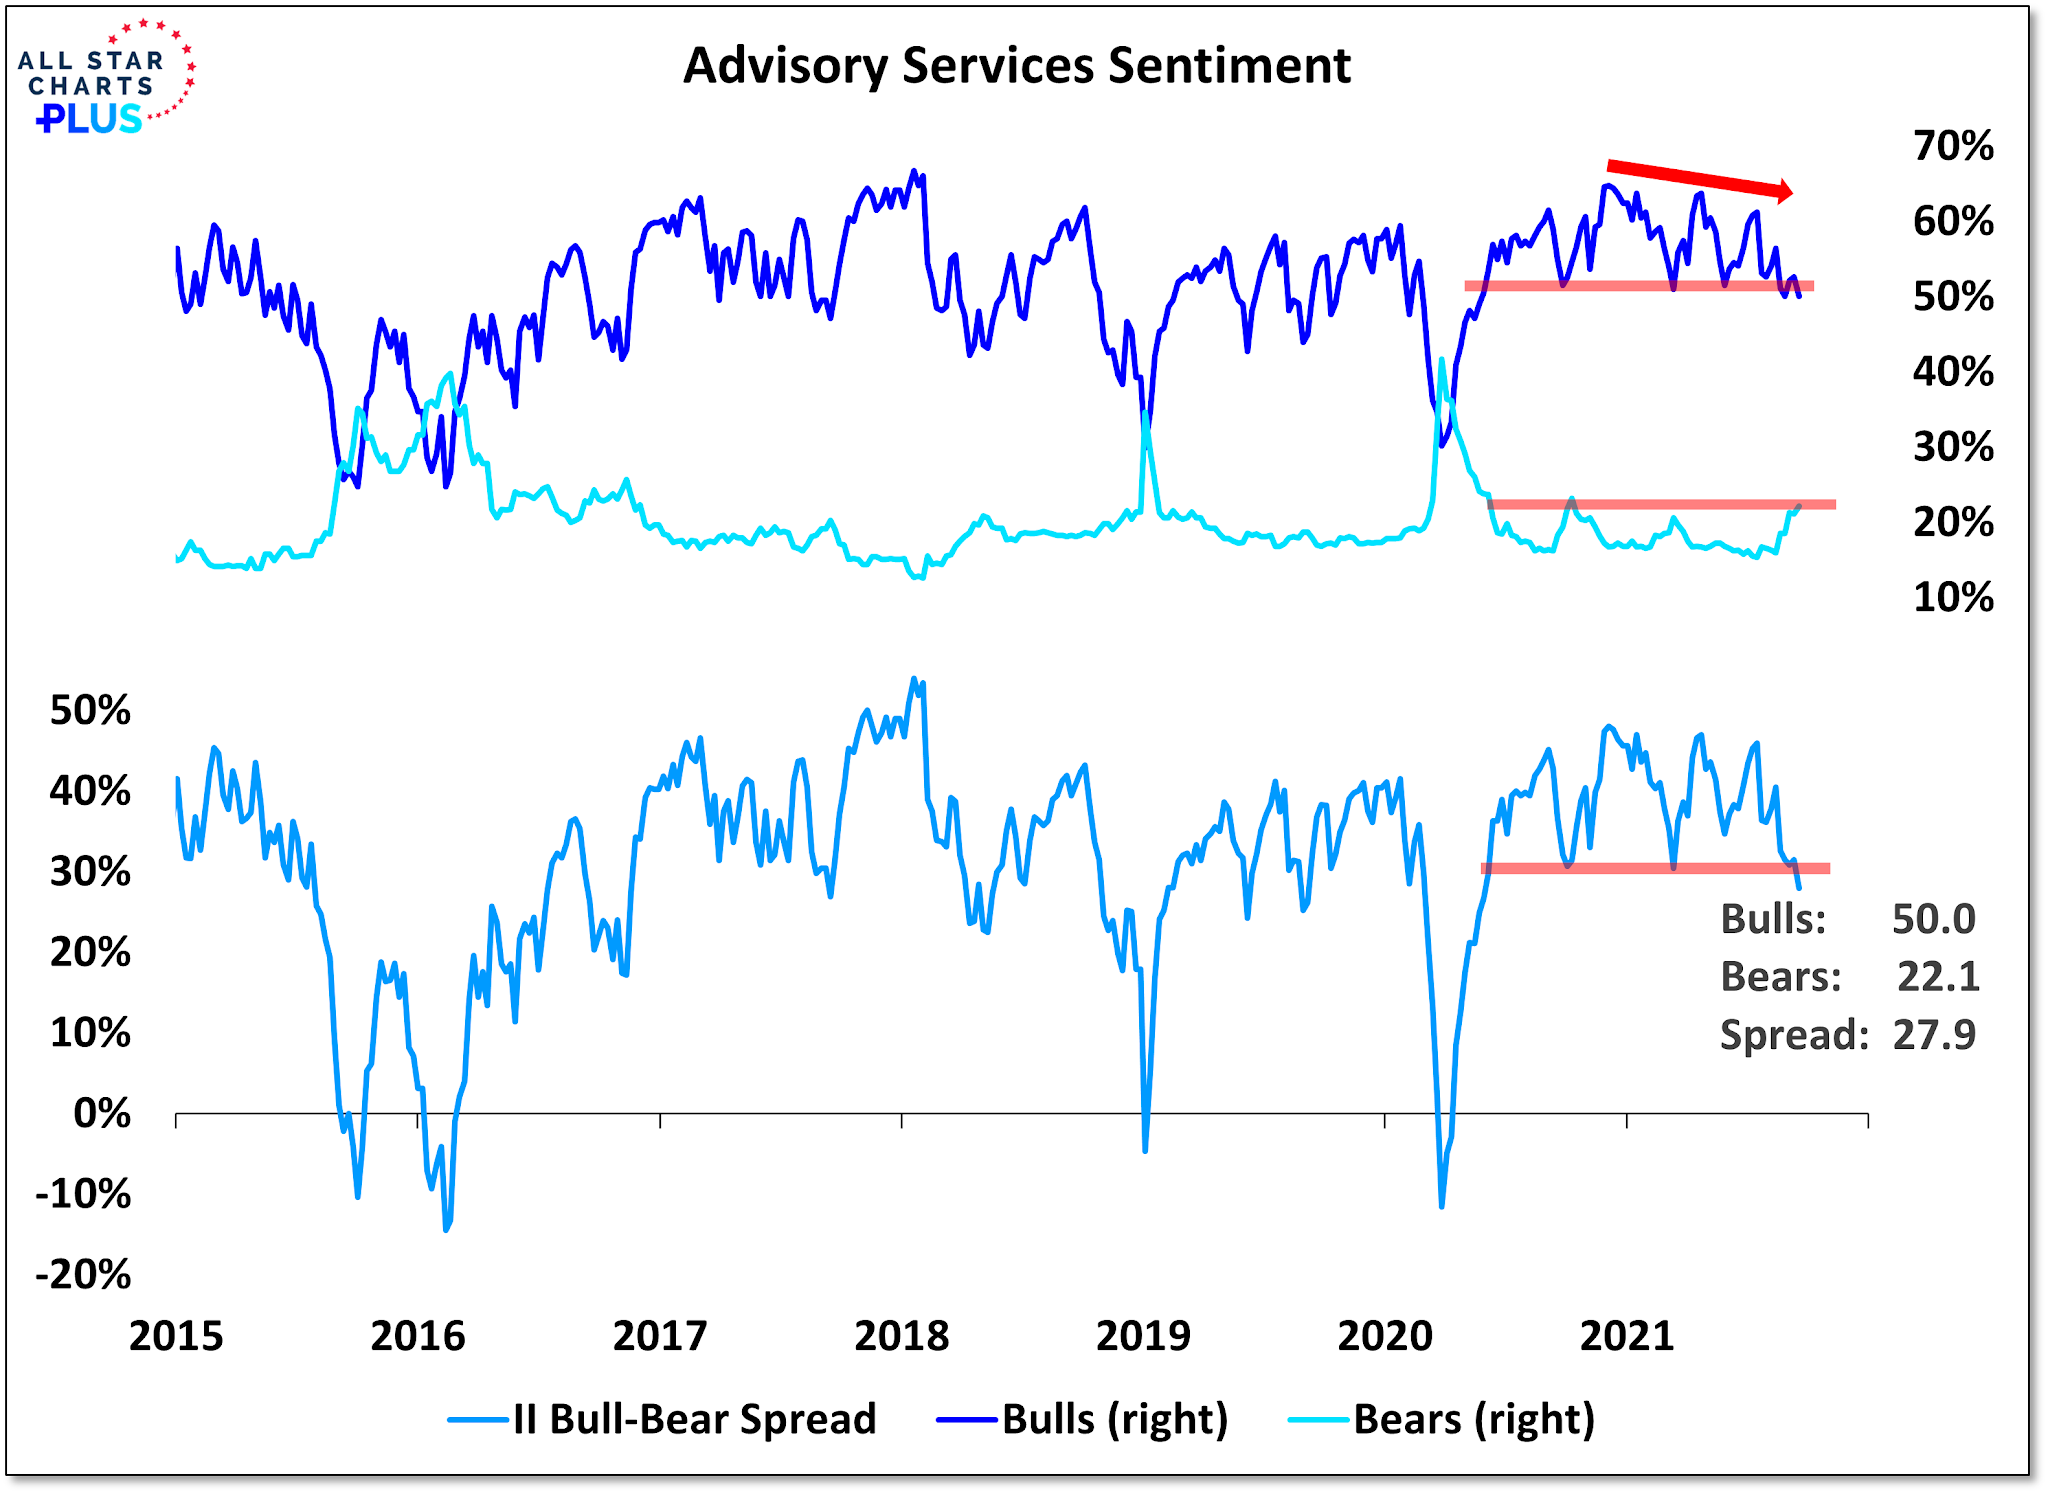
The latest Investor Sentiment poll shows bullishness in retreat, but bearishness hasn’t spiked. The constructive view is the market is ripe for a relief rally. A more skeptical take is the market may need one final flush before it can make a durable bottom.
Mark Hulbert believes that sentiment isn’t sufficiently bearish for the market to sustainably rally.
Don’t expect U.S. stocks to mount anything more than an anemic rally in coming weeks. That’s because there’s still too much bullish sentiment. According to contrarian analysis, the most impressive rallies begin when there is widespread pessimism, just as market risk is highest when there is widespread optimism.
The chart below paints the picture. It plots the average recommended equity exposure level among a subset of Nasdaq-focused stock market timers I monitor (as measured by the Hulbert Nasdaq Newsletter Sentiment Index, or HNNSI). The HNNSI is my most sensitive barometer of stock market sentiment.

I am open to the possibility that market psychology may need that final flush to signal a capitulation bottom. My market bottom models aren’t flashing buy signals just yet. We may need one last panic when the S&P 500 breaches its 50 dma before a short-term buying opportunity presents itself.

This Friday is quad witching expiry and could be the source of some price volatility. If the S&P 500 fails to stage an upside breakout through the flag pattern, will quad witching be the catalyst for a buy signal?
What’s going on with China? I’ve been asking myself that question every day for the past two weeks.
I’m not a fan of the CCP, but I am a great fan of China and its long and illustrious history. My early years at Michigan included enough credits in East Asian Studies and Chinese that I could have (should have) added a minor in Chinese studies. But mainly, I learned about China by listening to stories from my parents, one of whom was raised within the grounds of what was then Yenching U (now Beida), the other the son of a Shanghai politician.
I finally had the opportunity to visit China in 1984, and recall the pride I felt flying first into Beijing and then Nanjing. My first visit to Beida was emotional – my uncle pointing out the many places my Mom used to frequent. A Chinese-American visitor (easily identifiable by clothing) in 1984 was still an unusual sight and we attracted many stares striding across campus – my uncle at 6’3″ in a Mao jacket and me at 6’2″ in faded flannel shirt and jeans. Yet I was ‘home’ and felt I belonged. I remember countless conversations with interpreters re Mao – at the end of the day, a truly great leader/visionary who also somehow managed to truly **** things up for an entire generation of Chinese. Xi now has the potential to become the anti-Mao, yet instead seems to have taken shelter behind the CCP.
I don’t necessarily have a problem with ‘common prosperity.’ In some ways, that sounds almost almost American. So what is the problem? I think it comes down to corruption. Politics and business practices in China are corrupt at their core. Xi has what it takes to tackle the problem head-on. Unfortunately, I don’t think he has the will.
Until that changes, investing in China just doesn’t make sense. There are better places to put our money.
Cam, based on the article, the following 3 scenarios comes to mind. Is this consistent with your current thinking?
1. short and sharp dip below 50ma and quickly recapture. akin to early Mar 2021.
2. A further 5% drawdown from here going to 4200 level (middel of 50 and 200ma); akin to late Oct and late Nov 2020.
3. -10% from current level to test 200ma to establish a durable short term bottom, setting up for the year end rally
So much for St Leger’s day.
Tricky spot here, how would the market react to disappointing retail sales report? The weak readings on August economic data are not unexpected, according to what I have read August is expected to be the through. The narrative for the remainder of the year is delta peaking and some reacceleration in growth, especially in Asia. Analysts are bullish on Japan and Europe vs some expected underperformance in US megacap tech. Expectation of higher rates (bearish gold and growth stocks) going into the FOMC meeting may be a theme.
Mr. Bond – I expect you to die!
Looks like it’s the strong dollar that has the license to kill.