Preface: Explaining our market timing models
We maintain several market timing models, each with differing time horizons. The “Ultimate Market Timing Model” is a long-term market timing model based on the research outlined in our post, Building the ultimate market timing model. This model tends to generate only a handful of signals each decade.
The Trend Asset Allocation Model is an asset allocation model that applies trend following principles based on the inputs of global stock and commodity price. This model has a shorter time horizon and tends to turn over about 4-6 times a year. The performance and full details of a model portfolio based on the out-of-sample signals of the Trend Model can be found here.
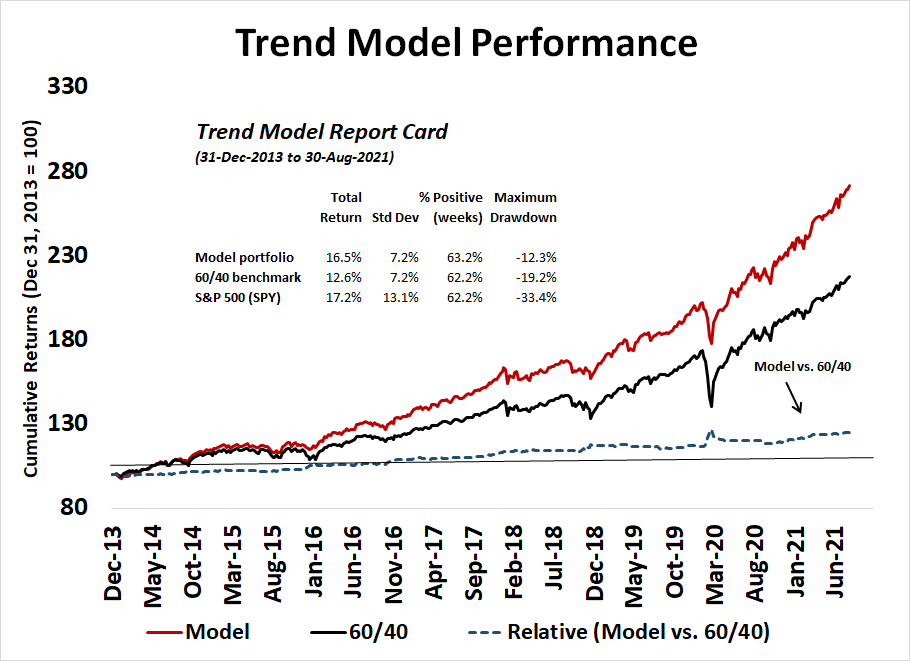
My inner trader uses a trading model, which is a blend of price momentum (is the Trend Model becoming more bullish, or bearish?) and overbought/oversold extremes (don’t buy if the trend is overbought, and vice versa). Subscribers receive real-time alerts of model changes, and a hypothetical trading record of the email alerts is updated weekly here. The hypothetical trading record of the trading model of the real-time alerts that began in March 2016 is shown below.

The latest signals of each model are as follows:
- Ultimate market timing model: Buy equities
- Trend Model signal: Bullish
- Trading model: Neutral
Update schedule: I generally update model readings on my site on weekends and tweet mid-week observations at @humblestudent. Subscribers receive real-time alerts of trading model changes, and a hypothetical trading record of those email alerts is shown here.
Subscribers can access the latest signal in real-time here.
The stealth correction?
For several weeks, I have been calling for a choppy sideways market, but the S&P 500 continues its upward grind. To be sure, the index pulled back about 2% last week and briefly tested its 50 dma, but its upward trajectory has been relentless.
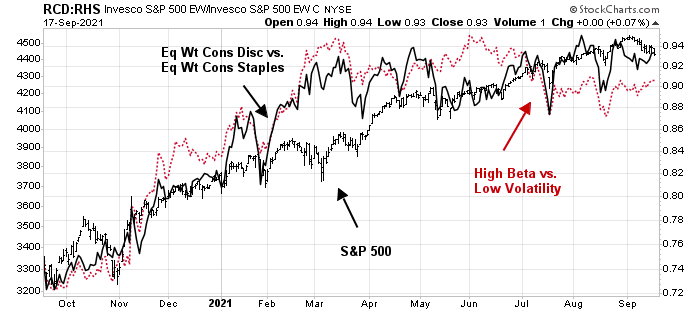
A discussion with another chartist raised the possibility that the market has been undergoing a stealth correction. As good technicians know, corrections can occur in price or in time. Beneath the surface, market internals have been correcting in both price and time. My equity risk appetite models have been trading sideways for much of this year.
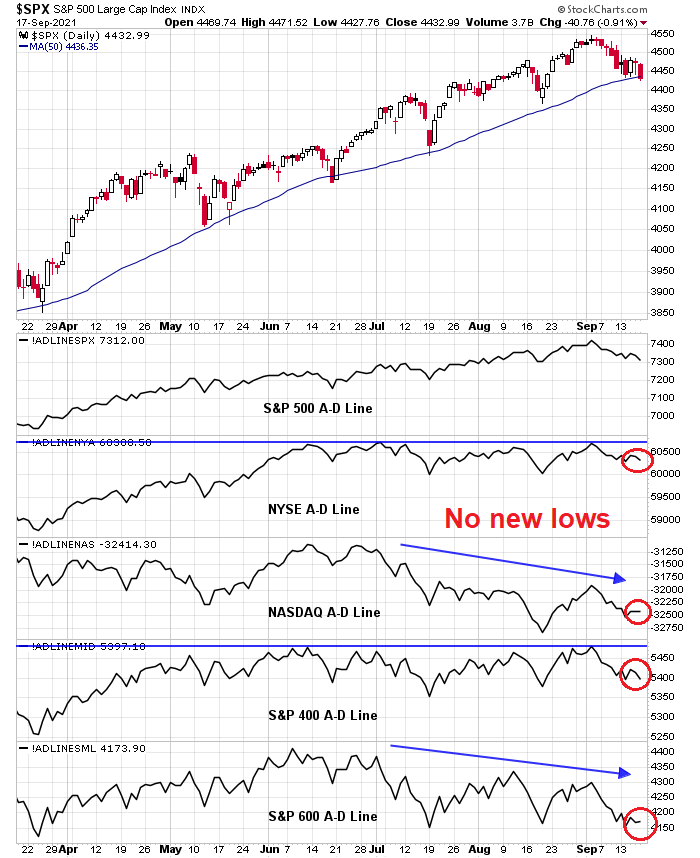
Breadth indicators tell a similar story. While the S&P 500 Advance-Decline line has made fresh highs during the current advance, other versions of the A-D Line have been flat to weak. The weakest have been the NASDAQ and the S&P 600 small-cap A-D Lines.
The tactical outlook is more constructive. Even as the S&P 500 tested the 50 dma and made a marginal low last Friday, all of the A-D Lines except for the S&P 500 did not make a fresh low.
The rolling correction
The rolling correction can be measured in many ways. One is the value/growth cycle. Large-cap growth makes up about 45% of the S&P 500 weight and dominates index movement, while value stocks comprise a smaller 31%. The disparity in weights explains the upward drift in the S&P 500 because of the recent leadership of growth stocks.
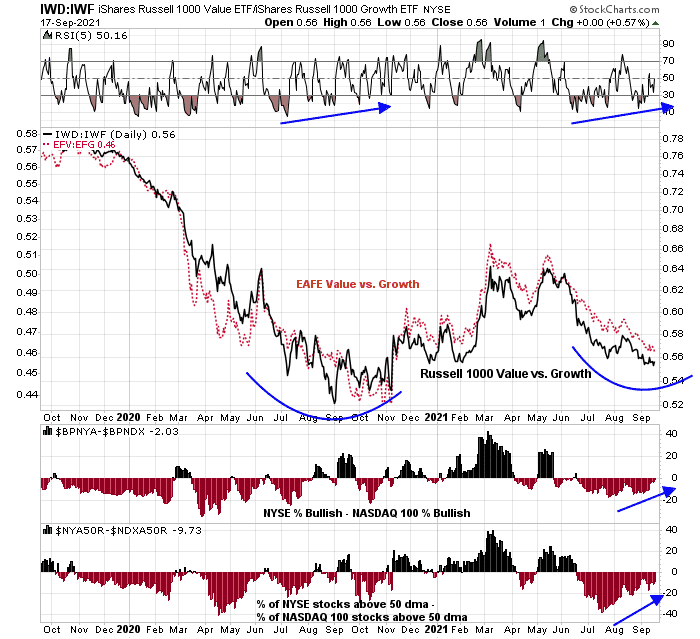
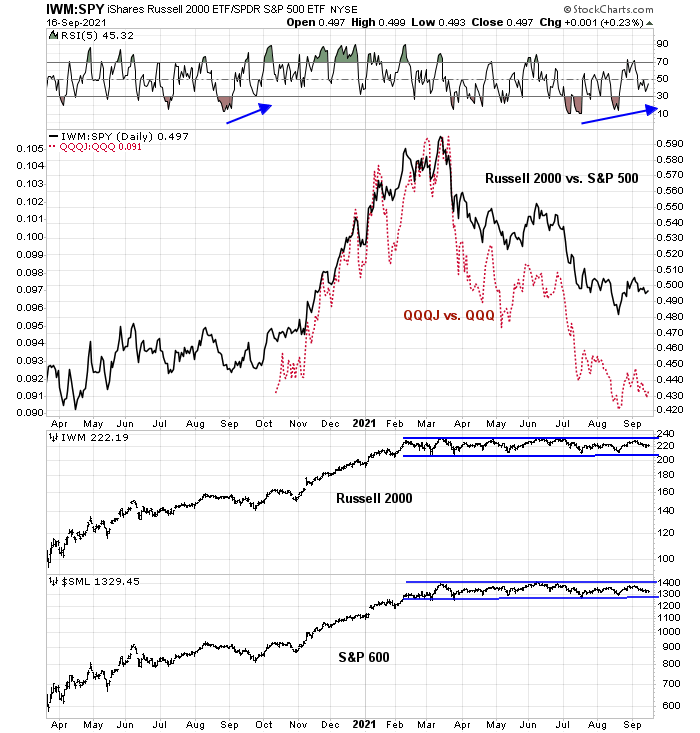
However, the value/growth ratio may be showing signs of turning up. The ratio is exhibiting a series of positive RSI divergence similar to the value bottom during the July to November period in 2020. In addition, relative breadth (bottom two panels) is showing signs of improvement.
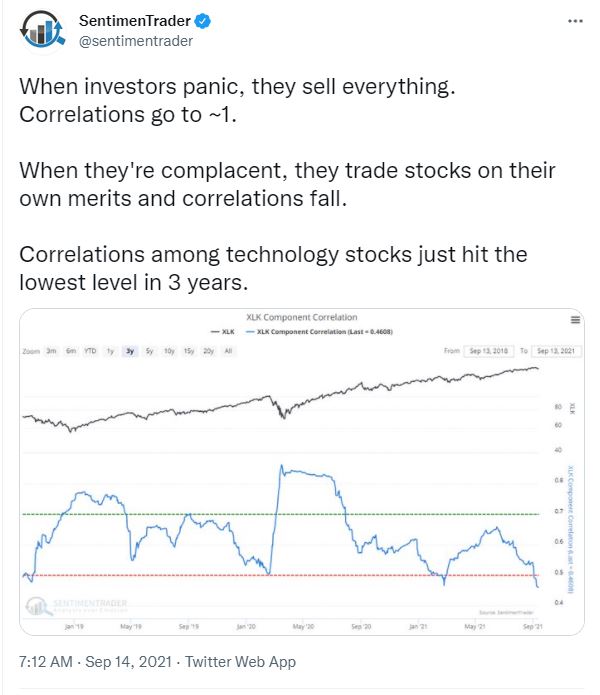
Another reason for a possible turn in the value/growth cycle is complacency. Technology stocks, which form the bulk of the growth stock universe, are vulnerable to a setback, according to SentimenTrader.
Another manifestation of the stealth correction in time is the sideways and range-bound price action of small-cap stocks for most of 2021. While the small-cap/large-cap ratio is also exhibiting a constructive positive RSI divergence, I remain unconvinced of the bullish implications of this signal until the Russell 2000 and S&P 600 stage upside breakouts.
A bullish surprise
I encountered a positive surprise from the credit market. The relative price performance of junk bonds to their duration-equivalent Treasuries made a new high last week, indicating a strong credit market risk appetite.

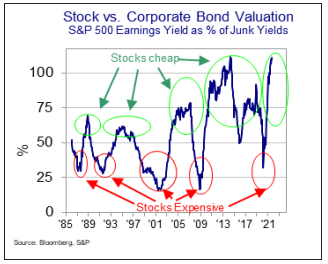
Brian Reynolds of Reynolds Strategy pointed out that equities look cheap against junk bonds when the equity risk premium is calculated using junk bond yields.
The primary trend is up
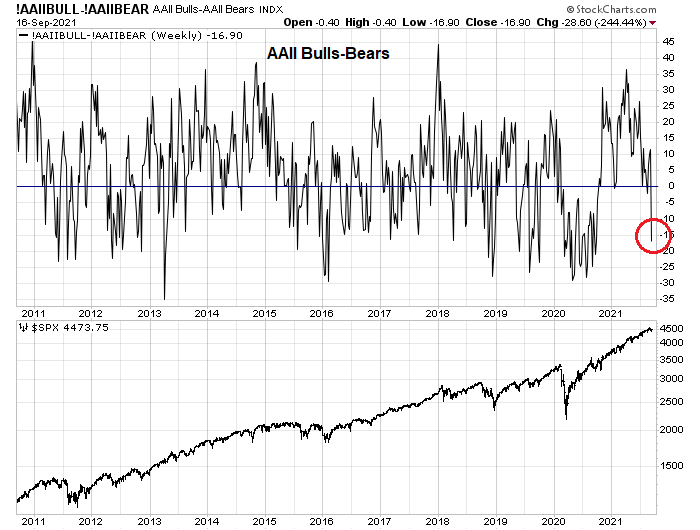
These conditions tell me that we are experiencing a bull market. While I have few insights as to when the choppiness will end, short-term downside risk should be relatively limited. The latest AAII sentiment survey shows a dramatic drop in the bull-bear spread. Such a spike in bearishness in the face of a minor 2% peak-to-trough drop in the S&P 500 is bullish from a contrarian basis.
A tactical low looks near. The S&P 500 tested its 50 dma but the 5-day RSI flashed a minor positive divergence. As well, the VIX Index closed within a hair of its upper Bollinger Band, which would be a short-term oversold signal.
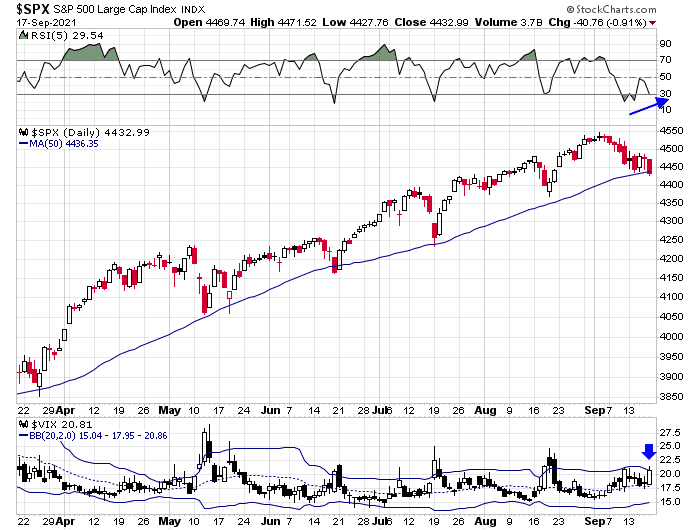
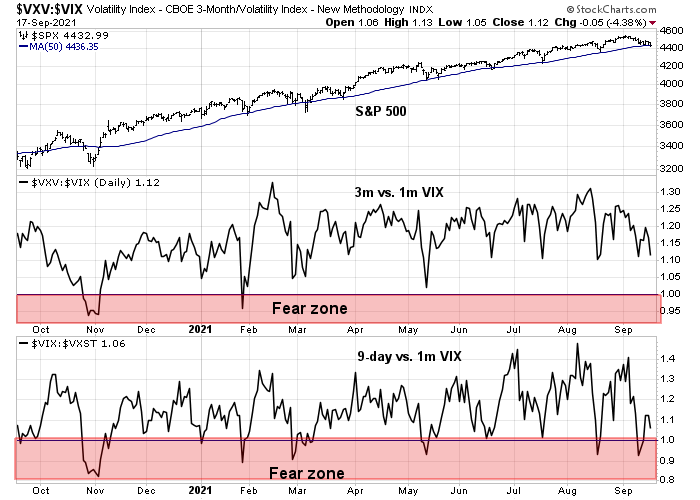
On the other hand, I was surprised by the inability of the term structure of the VIX to invert despite the recent market weakness. Neither the longer term one-month to three-month ratio nor the nine-day to one-day ratio inverted. I am open to the possibility that the market may need one final panic for a tradable bottom to appear.
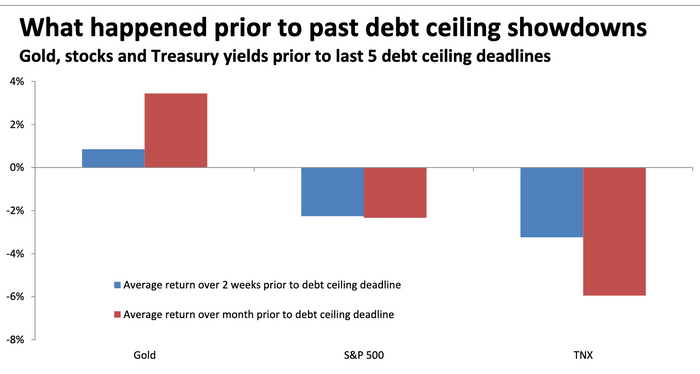
Next week’s FOMC meeting may be a source of volatility. As well, Mark Hulbert that stock prices tend to struggle ahead of a debt ceiling dispute, which is expected to occur in the next two weeks.
Investment-oriented accounts should remain bullishly positioned and be prepared to buy any weakness. Traders may wish to wait on the sidelines until a definitive trend becomes evident and be prepared to buy either the panic bottom or the upside breakout.
Adding to existing longs, although with some trepidation. I’m backstopped with appropriate position sizing, but even so the large gap-down will sting.
If a bounce fails to materialize within the first thirty minutes of trading, the plan to is take the hit.
SPX 100 dma ~4325.
I sense a degree of anxiety, but I think panic will require maybe SPY 425.
Taking the hit here. -1.17% loss over two days – and that’s despite what I thought was sound sizing.
The SPX is now officially -5% off its ATH.
Ready to buy the dip. QUAL, QQQ. Wait for it…
I’m guessing that Cam now has all of his indicators in place for a buy signal.
Bot QUAL and QQQ.
I’m eagerly awaiting an update from Cam.