Preface: Explaining our market timing models
We maintain several market timing models, each with differing time horizons. The “Ultimate Market Timing Model” is a long-term market timing model based on the research outlined in our post, Building the ultimate market timing model. This model tends to generate only a handful of signals each decade.
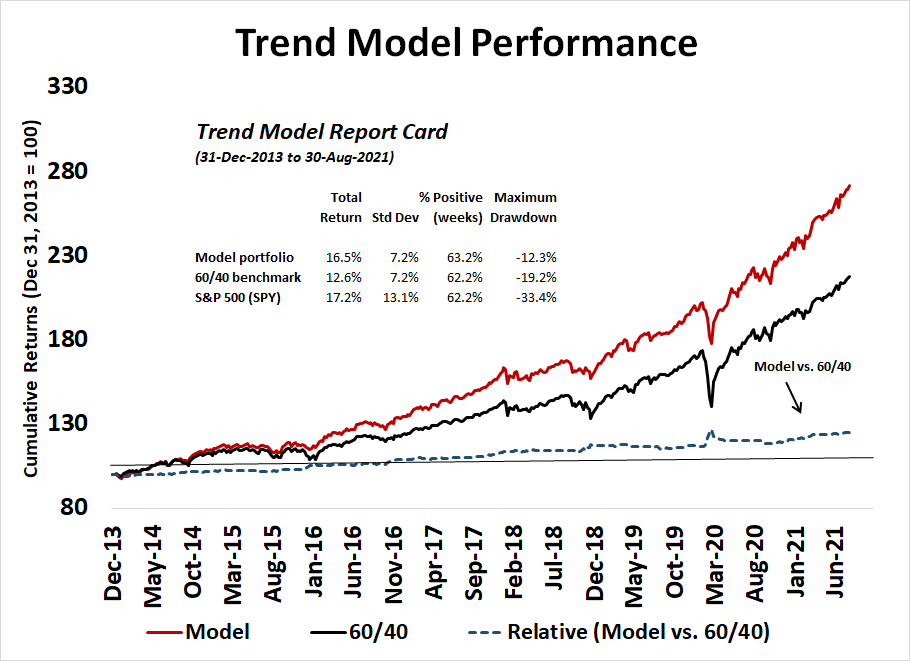
The Trend Asset Allocation Model is an asset allocation model that applies trend following principles based on the inputs of global stock and commodity price. This model has a shorter time horizon and tends to turn over about 4-6 times a year. The performance and full details of a model portfolio based on the out-of-sample signals of the Trend Model can be found here.
My inner trader uses a trading model, which is a blend of price momentum (is the Trend Model becoming more bullish, or bearish?) and overbought/oversold extremes (don’t buy if the trend is overbought, and vice versa). Subscribers receive real-time alerts of model changes, and a hypothetical trading record of the email alerts is updated weekly here. The hypothetical trading record of the trading model of the real-time alerts that began in March 2016 is shown below.

The latest signals of each model are as follows:
- Ultimate market timing model: Buy equities
- Trend Model signal: Bullish
- Trading model: Bullish
Update schedule: I generally update model readings on my site on weekends and tweet mid-week observations at @humblestudent. Subscribers receive real-time alerts of trading model changes, and a hypothetical trading record of those email alerts is shown here.
Subscribers can access the latest signal in real-time here.
Panic and recovery
Last week, I wrote, “A tactical low looks near.,,[but] traders should be open to the possibility that the market may need one final panic for a tradable bottom to appear.” What I didn’t expect was the China Evergrande panic that gripped the market, though the subsequent relief rally was not unexpected.
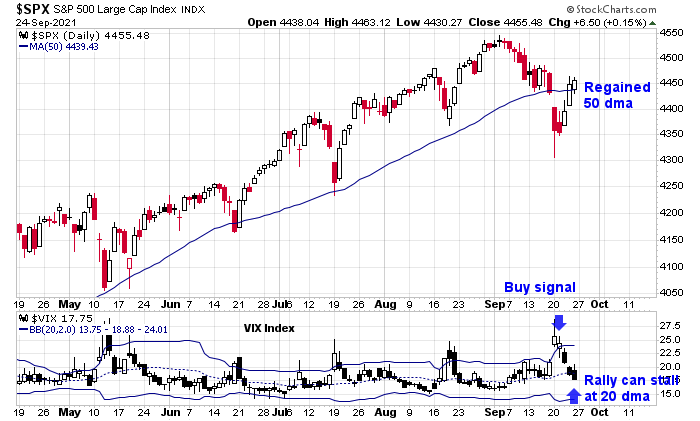
The S&P 500 fell -4% from its all-time high and rebounded by the end of the week to regain its 50-day moving average. The VIX Index flashed a buy signal when it rose above its upper Bollinger Band last week. However, traders should be aware of the caveat that rallies can stall once the VIX recycles from above the upper BB to the 20 dma. This scenario is a very real possibility as market jitters over a debt ceiling impasse, Treasury default, and a widespread government shutdown looms ahead.
Capitulation sentiment
There were signs of capitulation level sentiment everywhere. Starting in Hong Kong, where China Evergrande is listed, Jason Goepfert of SentimenTrader documented how the net advance-decline breadth fell to levels seen at short-term lows.

Rob Hanna at Quantifiable Edges wrote that his “Quantifiable Edges Capitulative Breadth Index (CBI), which measures short-term capitulative selling among S&P 100 stocks, closed at 11 on Tuesday and 12 Wednesday”. Readings of 10 or more have historically been short-term buy signals, especially if the S&P 500 is above its 200 dma.

The NYSE McClellan Oscillator (NYMO) fell to an oversold level last week. With the exception of the COVID Crash, such readings have provided good short-term long entry points for traders in the past.

Credit market risk appetite, as measured by the relative price performance of junk bonds to their duration-equivalent Treasuries, made an all-time high.

Interpreting the yield breakout
As for market leadership, it is noteworthy that the 10-year Treasury yield staged a decisive upside breakout in the wake of the September FOMC meeting, though the 5-year yield had already shown signs of strength.

In the wake of the yield breakout, bear in mind the historical record of sector and industry sensitivity to rising yields has been cyclical and value stocks.

Should yields continue to strengthen, the value stock revival may finally be realized.

In the very short-term, however, breadth is highly extended. Don’t be surprised if the market rally pauses early next week.

In conclusion, the stock market made a classic washout bottom last week. While I wouldn’t necessarily discount the possibility of a pause in the advance, the intermediate-term path of least resistance for stock prices is up.
Disclosure: Long SPXL
The ideal scenario for a durable low (one which may fail to materialize in the current era of what Ken refers to as AI investing) is a retest/undercut of last week’s lows followed by recovery and rally to new highs. Still looking for SPY 425 with the realization that the market rarely gives us what we look for. Also looking for SPY 500 in the months ahead.
My game plan, barring unforeseen circumstances, is to add to equities at roughly 7% and 14% down from ATH. This is based on a pullback of 5-10 % and a correction of 10-20 % if they happen. Ride the market till it’s 7-10 % above current ATH.
Cam’s analysis and insights provide the guardrails, so to speak. And tactical shifts to cyclical sectors.
Thanks Cam, I feel better now about rebasing my 124 sector ETFs to last Monday’s low.
Human investors Swooned in a big way but the stock market had a surprisingly small decline as A.I. stepped in.
Thanks for the chart on how sectors move on higher interest rates. Banks and Financial ETFs as well as Energy were big winners last week just as the chart predicted. No supply chain worries there with Banks, The money is printed in the U.S. of A. by the Fed and doesn’t need scarce shipping containers to deliver.
Just for the hell of it here is the top 30 ETF outperformers from last Monday’s bottom followed by the bottom 30 underperformers. This four day performance is early days and major shifts will happen in following weeks. But often, the sprinters that explode out of their starting blocks, win the race. Likewise, slow starters can continue to lag.
S&P Oil & Gas Exploration & Production ETF
Oil Services ETF (VanEck Vectors)
S&P Bank ETF (Spider)
US Global Jets ETF
Dynamic Leisure & Entertainment Portfolio
Lithium
Financial Select Sector SPDR Fund
U.S. Broker-Dealers & Securities Exchanges ETF
S&P Pharmaceuticals ETF (Spider)
U.S. Aerospace & Defense ETF (iShares)
Global Timber and Forest
Global Auto
Global Base Metals
North American Tech-Software ETF (iShares)
EW Consumer Discretionary
Semi-Conductor
Momentum Factor ETF (iShares)
Consumer Discretionary Select Sector Fund
EW Technology
S&P 500 Pure Growth
Global Metals Mining ETF
Agribusiness ETF (VanEck Vectors)
Dow Jones Internet Index Fund (First Trust)
S&P High Quality
EW Materials
Taiwan
S&P Insurance ETF (Spider)
Transportation Average ETF (iShares)
Russell 2000 ETF (iShares)
Renaissance IPO ETF
MSCI Eurozone ETF (iShares ) – ex-UK
Now the nasty 30 group (worst at the bottom)
iShare Value ETF (iShares)
Dynamic Food & Beverage Portfolio
China Internet
ARK Innovation ETF
New Zealand
China MSCI Index
Health Care Select Sector Fund (Spider)
Consumer Staples Select Sector Fund (Spider)
Emerging Consumer
Int’l High Quality
S&P Low Volatilty
Japan ETF (iShares MSCI)
EW Consumer Staples
U.S. Home Construction ETF (iShares)
NASDAQ Biotechnology ETF (iShares)
EW U.S. Real Estate
China Large-Cap ETF (iShares)
Singapore
China Consumer
Health Providers
U.S. Real Estate ETF (iShares)
Fidelity TIPS
Utilities Select Sector Fund (Spider)
REIT ETF (Schwab)
Gold Shares (Spider)
U.S. Market Neutral Anti-Beta ETF (AGFIQ )
ARK Genome ETF
Gold Miners ETF (VanEck Vectors)
20 Year Treasury Bond
Uranium ETF
25 Year Zero Coupon Treasury Bond
These are not recommendations. They are observations. I don’t know your risk tolerance or financial circumstances.
It’s interesting that iShares value lost money. Cyclicals seems to be bubbling up, in the above list. Hopefully this is a trend that continues.
D.V. to show you how early days the ranking is after 4 days, the S&P 500 was up 2.4% and the Value ETF was up 1.3% so it underperformed by 1.1%. That small difference put it in the bottom quartile. So Value isn’t doing to badly. In a month if it’s underperforming by 5% then that is truly bad.
Thanks Ken for the prompt reply.
Cam
In the bar chart posted, from RenMac, showing interest sensitivity, what do the numbers on the top (or bottom) of the bars mean?
I suppose EW means Equal weight?
Thanks kindly.
SPX support ~4400 has failed. Trapped bulls may take prices down to retest last week’s lows.
Or does this morning’s selloff represent a buying opp?
I don’t know, so I’ll split the difference and start scaling into VT here.
Adding BABA.
FXI.
EEM.
EWC.
QQQ.
VTI.
VTV. EWZ.
Adding to VT.
Adding a position in SPY.
Now in the green.
Cam nailed. The debt-ceiling pause that refreshes.
Nailed it.
At some point the chamber of commerce will call Mitch and say, “really?” And all will be good again.
fwiw, the Quantifiable Edges Capitulation Breadth Index closed ~6 today, versus 12 last Wednesday.
The positive spin might be that we had a successful retest today.
All positions off here for what amounts to an overall minor gain. I don’t like what I’m seeing right now.
The market will probably gap and run when least expected. Reopening a VT place setter – positions will be added and/or removed as the market dictates.
Closing the VT position. Anything can happen tomorrow morning, and I’ll deal with it then.