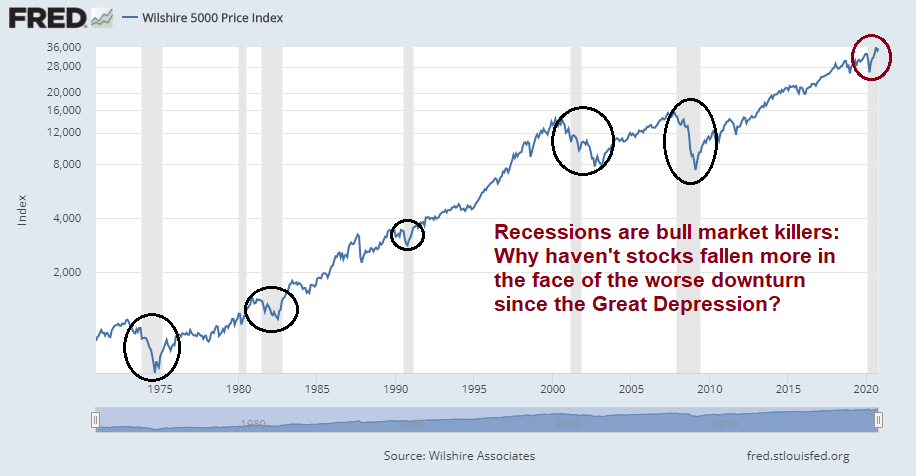
One of the investment puzzles of 2020 is the stock market’s behavior. In the face of the worst global economic downturn since the Great Depression, why haven’t stock prices fallen further? Investors saw a brief panic in February and March, and the S&P 500 has recovered and even made an all-time high in early September. As a consequence, valuations have become more elevated.
Three explanations


BIS: Insights from dividend futures
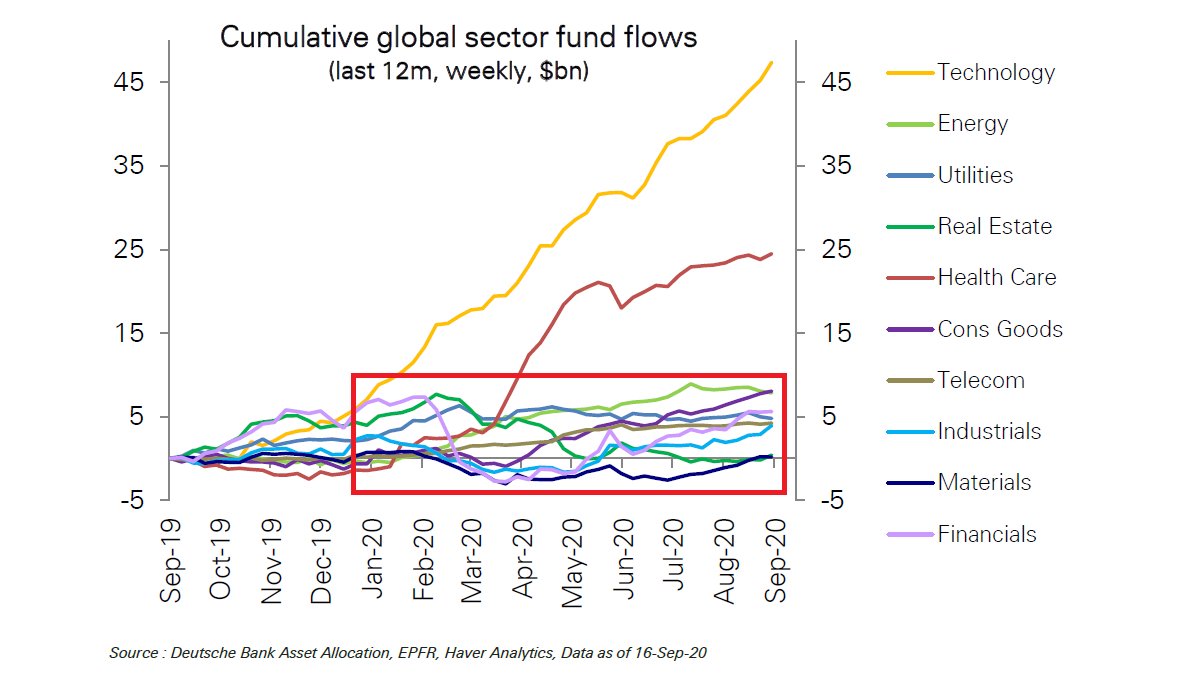
Financial markets recorded further gains during the review period, despite the challenging macroeconomic outlook. A divergence emerged between, on the one hand, elevated stock valuations and tightening credit spreads and, on the other, the reality of an economic recovery that looked incomplete and fragile. While investors did differentiate across sectors, rewarding technology stocks in particular, they seemed to be comforted overall by a stream of economic indicators that turned out better than feared. An accommodating monetary policy stance and news about new fiscal programmes in some jurisdictions also provided critical support for asset prices.
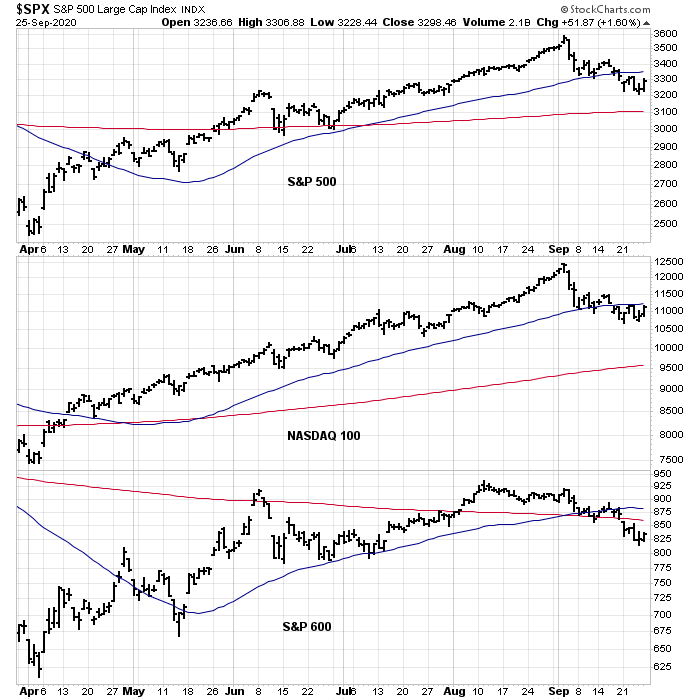
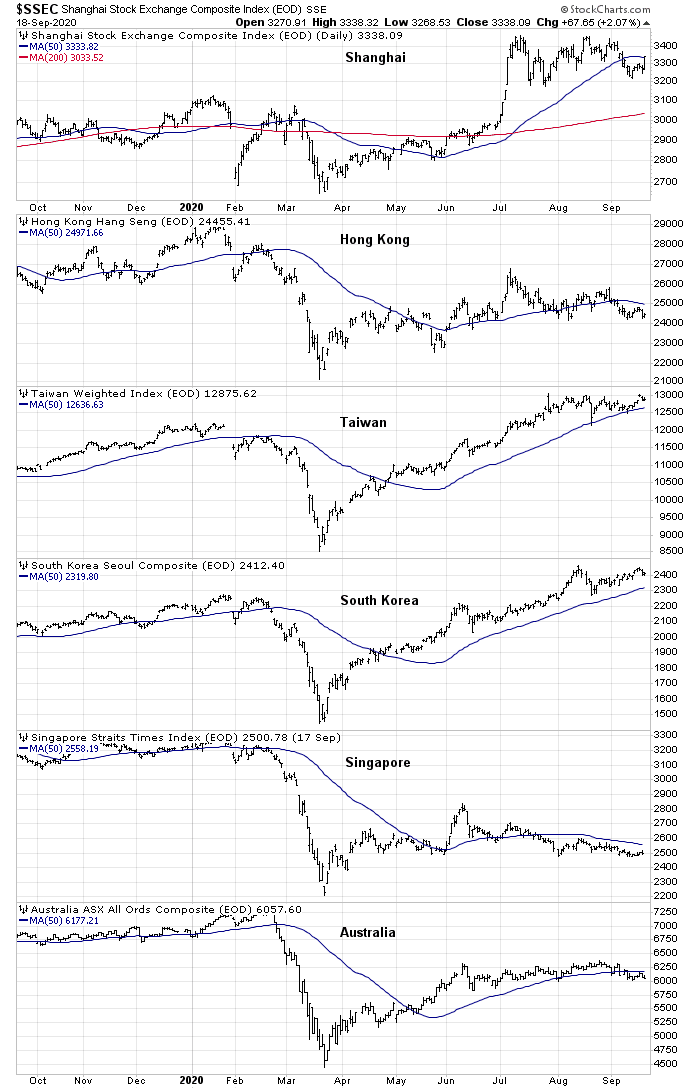
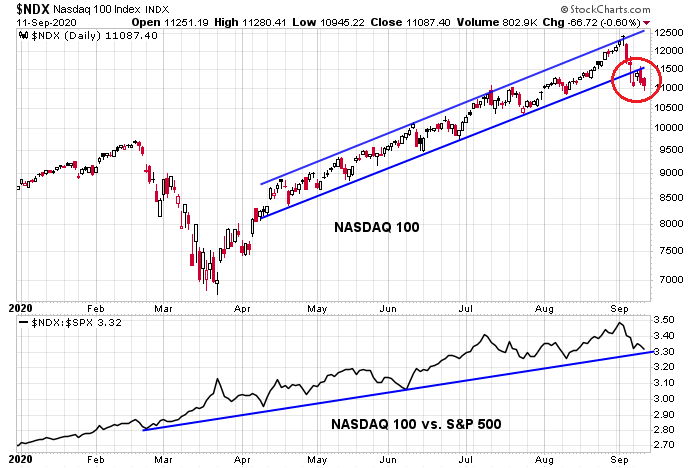
Stock markets overall saw a notable rise between July and early September. After recording strong returns in April and May, equity prices moved largely sideways in June but resumed their ascent thereafter. The gains were largest in the United States and China, whose main equity benchmarks by August had surpassed their pre-pandemic valuations, which had already carried signs of overheating (Graph 1, first panel). While other AE and EME stock indices recouped much of their March losses, they still remained some 10% below previous highs. A sell-off at the end of review period cut some of the early gains, particularly in the technology sector.
As part of the BIS study, Fernando Avalos and Dora Xia analyzed dividend futures on the S&P 500 and the Euro Stoxx 50 Index. Finance theory of discounted cash flows hold that equity prices is the sum of all future dividend payments, which are proxies for investor expectations of the fundamentals of individual companies in the respective stock indices.
Avalos and Xia found these dividend futures expiring in 2024 have rebounded strongly from the March bottom than contracts that expire in 2020. While 2020 is expected to be difficult, the long-term corporate earnings outlook isn’t expected to be as bad.

Avalos and Xia went on to observe that rates have plunged, the net present value of the 2024 dividends are worth much more than the pre-crisis period. Therefore the recovery in stock prices can be attributed to the combination of a strong rebound in long-term expected dividends, and falling interest rates. Had rates remained the same, valuations may be over 15% less than they are now.
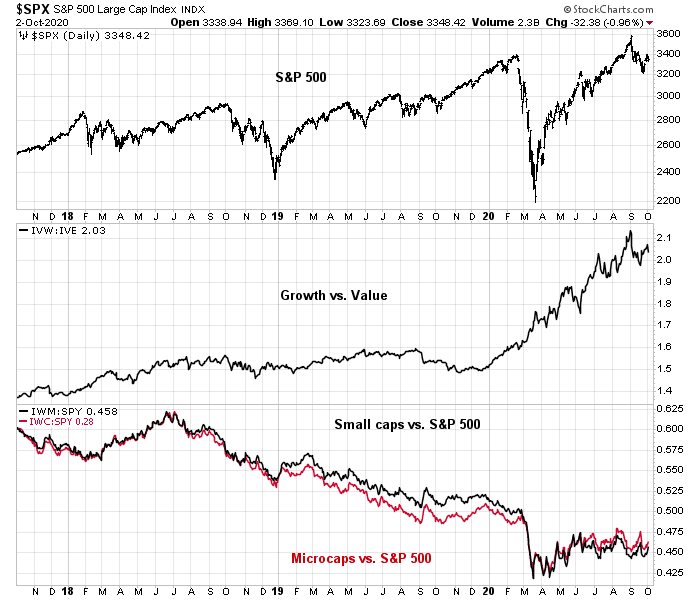
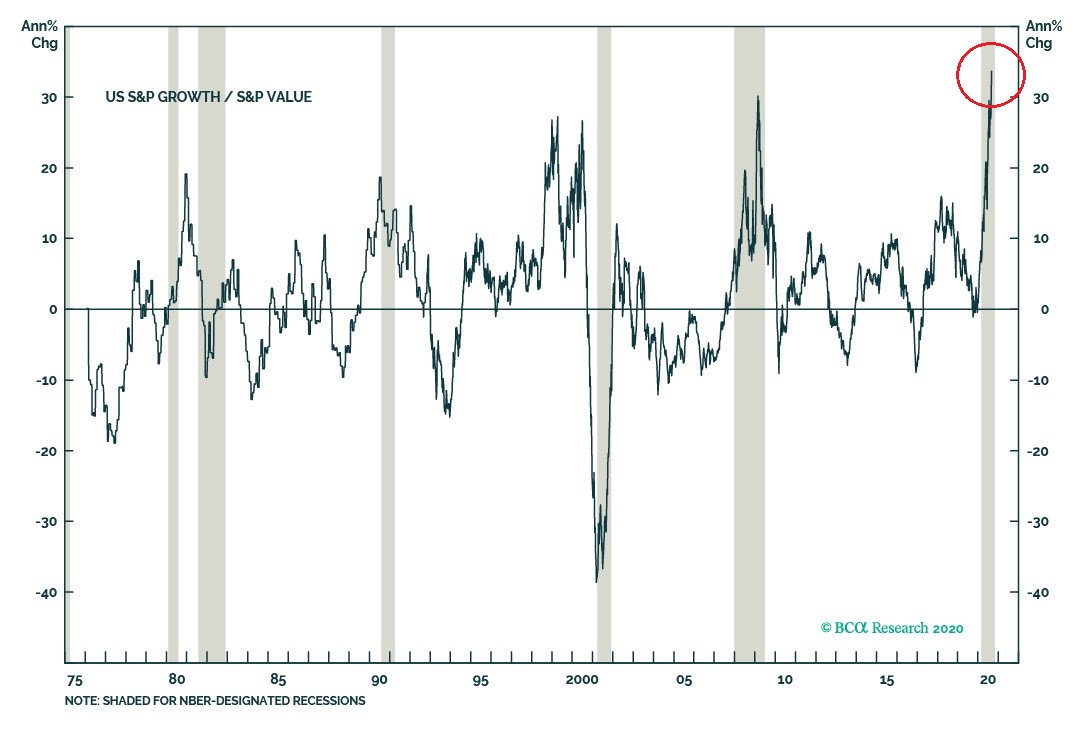
While the authors don’t directly address the issue, this analytical framework also explains why growth stocks have handily beaten value stocks during the study period. Growth stocks normally don’t pay dividends, and finance theory holds that most of their value comes from their expected corporate value at a far off time in the future. This makes the duration of growth stocks higher than value stocks. (For the uninitiated, duration measures the sensitivity of an asset to interest rates. The longer the duration, the more sensitive the price is to interest rate movements.)
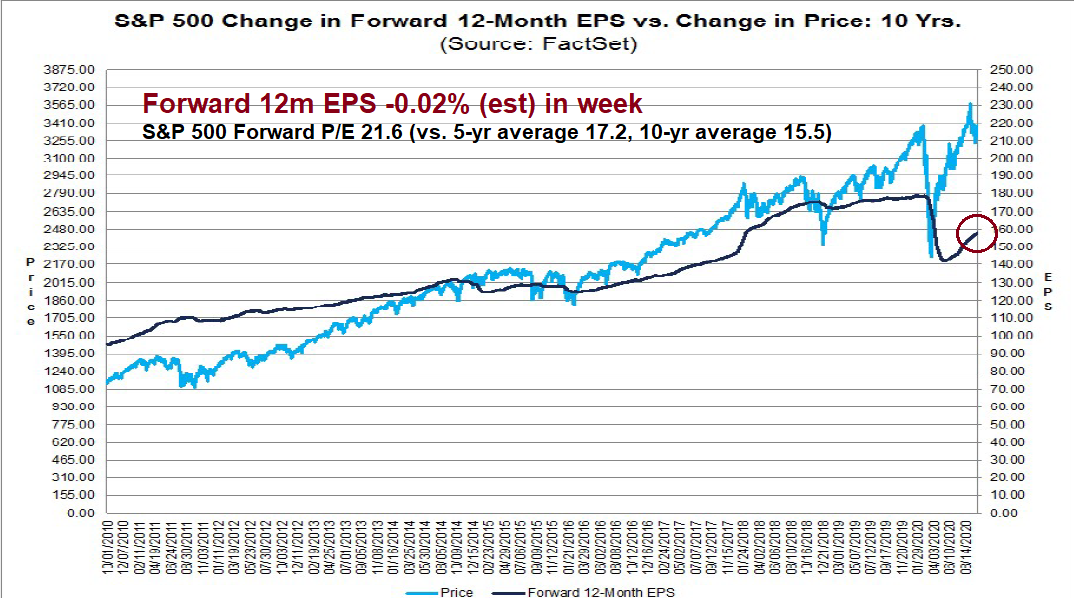
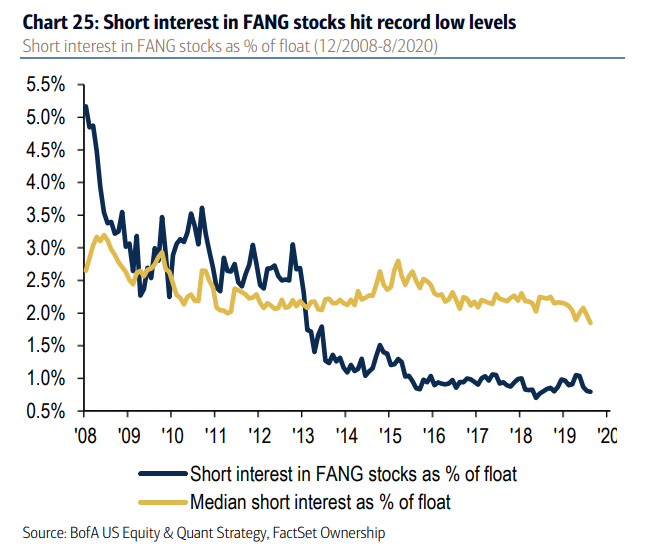
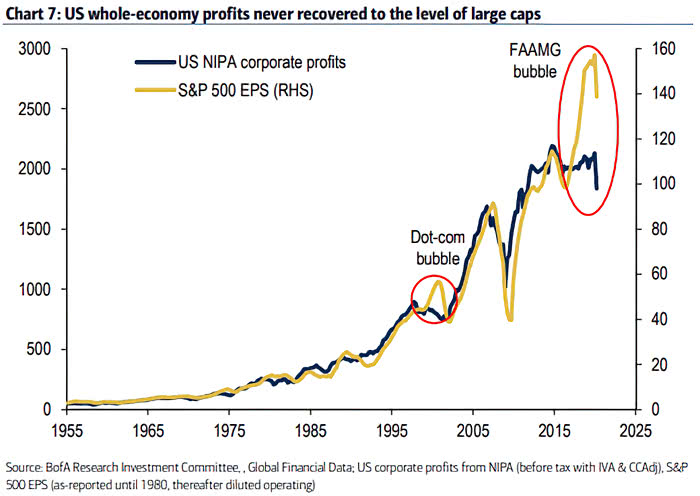
Indeed, the forward P/E ratio of FAAMG stocks have diverged from the rest of the S&P 500 far more in 2020 than the pre-crisis era.

While the BIS approach of studying dividend futures is useful from a finance theory viewpoint, it is unsatisfying from real-time investors’ perspective. Analysis from Goldman Sachs indicate that forward P/E ratios are relatively insensitive to differing inflation regimes – and inflation is a major determinant of interest rates.

Upside-down markets
A third, and more detailed, explanation of market conditions in 2020 comes from the writer under the pseudonym Jesse Livermore. Jesse Livermore has penned a number of very detailed and cogent analysis in the past, and the latest is no different. His latest Opus, “Upside-Down Markets: Profits, Inflation and Equity Valuation in Fiscal Policy Regimes”, was published by O’Shaughnessy Asset Management. The paper is long and extensive at over 40,000 words. He begins by describing an upside-down market:
An upside-down market is a market in which good news functions as bad news and bad news functions as good news. The force that turns markets upside-down is policy. News, good or bad, triggers a countervailing policy response with effects that outweigh the original implications of the news itself.
Here is a stylized though radical example of the events of 2020, though COVID-19 is not incurable and won’t last forever.
To illustrate with a concrete example, imagine a policy regime in which U.S. congressional lawmakers, acting with the support of the Federal Reserve (“Fed”), set a 5% nominal growth target for the U.S. economy. They pledge to do “whatever it takes” from a fiscal perspective to reach that target, including driving up the inflation rate, if the economy’s real growth rate fails to keep up. Suppose that under this policy regime, the economy gets hit with a contagious, lethal, incurable virus that forces everyone to aggressively socially distance, not just for several months, but forever. The emergence of such a virus would obviously be terrible news for humanity.
He went on to describe the economy, and the subsequent policy response.
The virus would force the economy to undertake a permanent reorganization away from activities that involve close human contact and towards activities that are compatible with social distancing. Economically, the reorganization would be excruciating, bringing about enormous levels of unemployment and bankruptcy. But remember that Congress is in-play. To reach its promised 5% nominal growth target, it would inject massive amounts of fiscal stimulus into the economy—whatever amount is needed to ensure that this year’s spending exceeds last year’s spending by the targeted 5%. To support the effort, the Fed would cut interest rates to zero, or maybe even below zero, provoking a buying frenzy among investors seeking to escape the guaranteed losses of cash positions.
The result would be bullish for equity prices, despite the horrible news about the economy.
If you are a diversified equity investor in this scenario, you will end up with a windfall on all fronts. Your equity holdings will be more attractive from a relative yield perspective, more scarce from a supply perspective, and more profitable from an earnings perspective. The bad news won’t just be good news, it will be fantastic news, as twisted as that might sound.
The rest of the paper takes a detailed journey through the drivers of corporate profitability, inflation, the interaction between fiscal and monetary policy, and equity valuation. He concluded that valuation equilibrium is unstable, and therefore equity prices could experience significant volatility [emphasis added].
Imagine that you are in a two-asset market where one asset, cash, earns nothing forever, and the other asset, an equity stream, earns $1 a year forever, with a portion of that amount paid out as a dividend and a portion reinvested to generate future growth. If you buy the equity stream for $10—an earnings yield of 10%—and the enthusiasm of buyers subsequently wanes, you won’t need to sell at a loss. If the price falls, it’s not a big deal, because the 10% yield that you be will earning on the investment is intrinsically worth the temporary loss of access to your money. All you will have to do is wait and let the earnings accumulate, either as dividends that get paid out to you or as investments that compound. Over the long-term, you will end up doing very well, regardless of where the market decides to take the price.
But now suppose that the price gets pushed up in a TINA chase to $100—an earnings yield of 1%. If you buy at that price, you’re going to have to remain laser-focused on the market’s subsequent response, keeping the position on a short leash and rapidly exiting if buyer enthusiasm starts to wane, because the 1% earnings yield that you’re going to be accruing is nowhere near enough to compensate you for the loss of access to your money, which is what you will have to endure if the price falls appreciably from where it currently is. If the market decides that it wants to assign a 20 P/E ratio to the security instead of a 100 P/E ratio, the price is going to fall by 80%. You’re going to have to wait a full 80 years to get your money back in earnings. Will the wait be worth the 1% spread over cash that you will have locked in? Absolutely not, which is why you’re going to have to pay close attention and make sure that you don’t get stuck in that kind of a situation.
In the same way that you are going to be more sensitive to drawdown risk as a buyer at elevated valuations, everyone else in the market is going to be more sensitive as well, which will make the prices themselves more sensitive, and the investments more risky.
Ultimately, the only way that a market can be stable is if everyone is more-or-less happy with what they are holding—willing to transact, but not feeling an urgent need to do so. In the hypothetical market above, is it going to be possible for everyone to be happy with what they are holding? Definitely not. If the equity price in that market is stable or rising, the underinvested individuals earning nothing in cash are going to be unhappy. They will want more equity and will chase prices higher until some counterbalancing disincentive emerges to discourage them, such as the disincentive of a needy, shaky, creaky market that looks and feels more expensive than it deserves to be. If the equity price is falling, then overinvested individuals taking losses in equities will be unhappy, and will chase prices lower in pursuit of the safety of cash, until prices get cheap enough to make the securities attractive as investments for their own sake, because the underlying cash flows are attractive, regardless of the price that they can be sold for.
In the end, TINA markets are guaranteed to be difficult and frustrating for large numbers of people. The problem of how to properly invest in them has no easy solution. Chasing ultra-expensive assets, nervously supervising them in the hopes that you haven’t top-ticked them, is stressful and unpleasant. But so is waiting on the sidelines earning negative real returns while everyone else makes money. Time is not on your side in that effort.
Based on the assumption that investors just want to maintain the pre-crisis allocations irrespective of valuation, he arrived at an S&P 500 target of 3900.
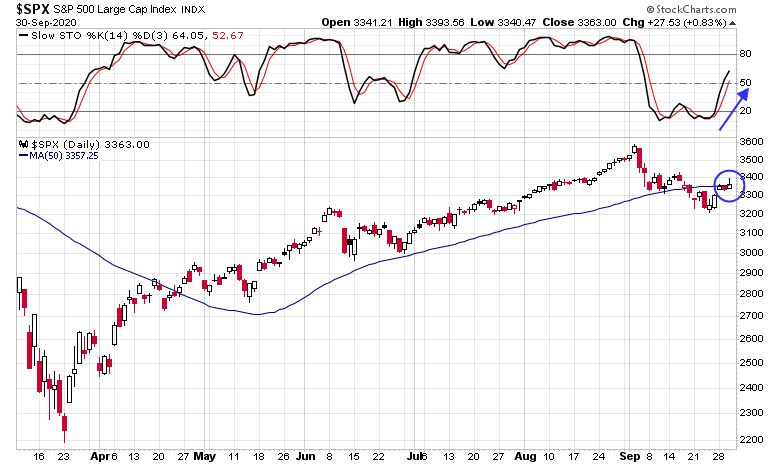
Returning to the subject of the current equity market, on the assumption that investors display zero sensitivity to valuation and invest entirely based on a pre-determined asset allocation preference, we can quantify the exact impact that the COVID-19 deficits would be expected to have on prices, if they found their way into markets. We simply assume that investors would bid up on the price of equity until their pre-pandemic allocation to equity was restored. To restore that allocation amid the COVID-19 debt issuance, the market would have to rise by roughly 18%, from its price at the time of the writing of this piece, roughly 3327, to a final price of roughly 3900, a forward 2-yr GAAP price-earnings ratio of 26 times.
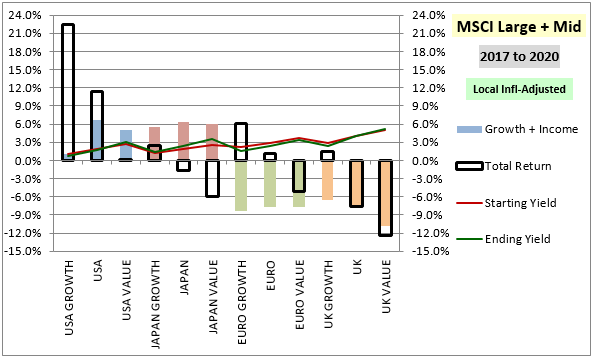
Stock returns by category from Dec 1976 to Dec 2019 for MSCI US, Japan, Europe ex-UK and UK indices, each separated into growth, broad market and value. Description and discussion below, to include charts of different sub-periods. Empty black boxes represent total returns, colored columns represent fundamental returns (annualized dividend growth w/ all dividend payouts recast as share buybacks). When a box is higher (lower) than a column, it means the category grew more expensive (cheaper) over the period.
He qualified the analysis by point out that Japanese fundamental improvement is distorted by the effects of Abemomics.
The depicted fundamental performance for Japan is distorted by the dividend payout ratio increases associated with Abenomics. If we were to measure growth in Japanese fundamentals using other aggregates (sales, earnings, etc.), the growth would not have been as strong.


I find this chart alarming. For US growth, you have ~22% annualized total return with only ~1% of that coming from fundamentals, the rest from valuation expansion.
The valuation question
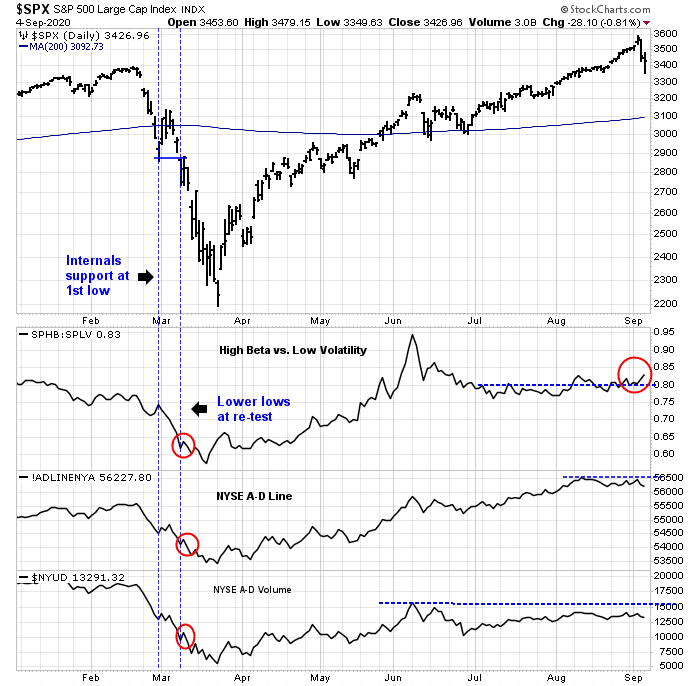
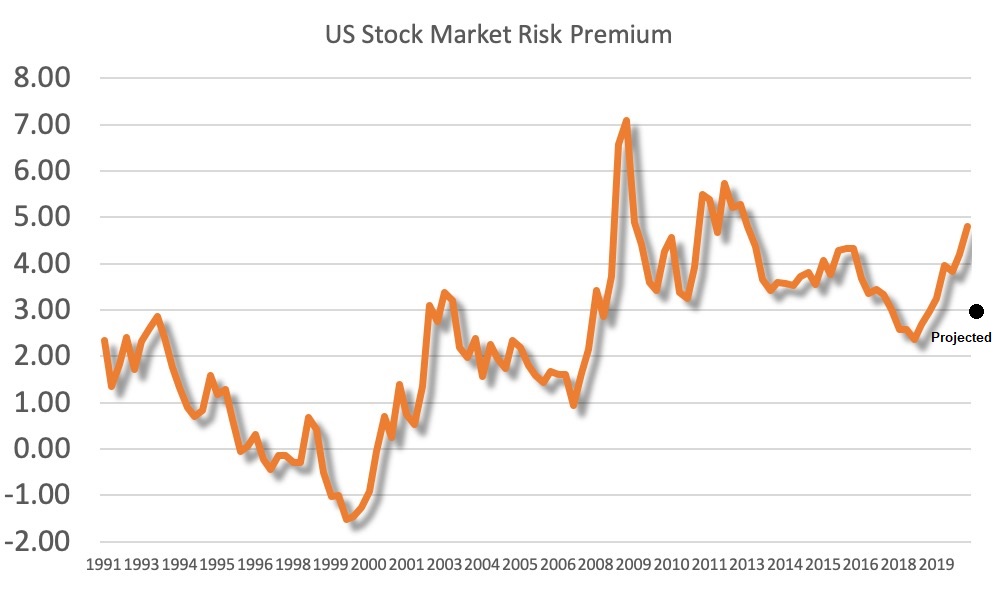
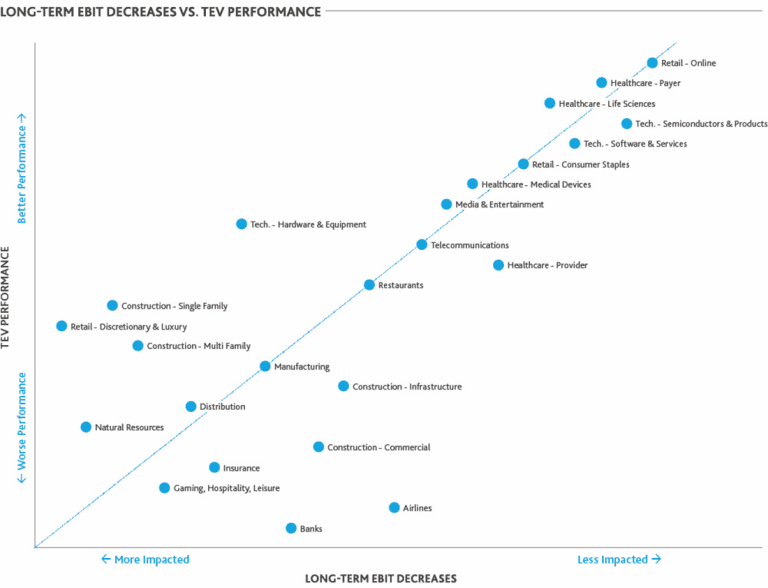
- From BDO: The market was reacting rationally on a relative valuation basis.
- From BIS: The discounted value of dividend futures revealed that long-term cash flows had recovered, and lower interest rates boosted valuation. However, there may be some limits to the forward P/E to interest rate trade-off as forward P/E ratios have been relatively insensitive to low inflation and interest rates.
- From Jesse Livermore: Good news can be bad news, and vice versa, in the current fiscal and monetary policy environment. The best case analysis of the S&P 500 results in a target price of 3900. Moreover, US equities, and growth equities in particular, are overvalued compared to US value and the rest of the world.