Mid-week market update: Did the Economist do it again with another contrarian magazine cover indicator? At the top of the market, their issue cover was entitled “Big tech’s $2trn bull run”. Last weekend, their cover featured a “closed” sign on the earth.

The market staged an upside breakout through a falling trend line yesterday, and the upside held today. Notwithstanding the Bernie Sanders induced last hour weakness, it managed to put together two green days in a row, which has not happened since February 11-12. This market action has all the makings of a primary low.

The contrarian in me is worried. I am part of the consensus that this is a bear market rally, whose scenario calls for a retest of the lows, which may not necessarily be successful. What could possibly go wrong?
Historically bearish
The magnitude of yesterday’s gargantuan rally was last exceeded in 1933. Though the sample size is relatively small, Bespoke’s historical analysis of such episodes has not been friendly to the bulls.
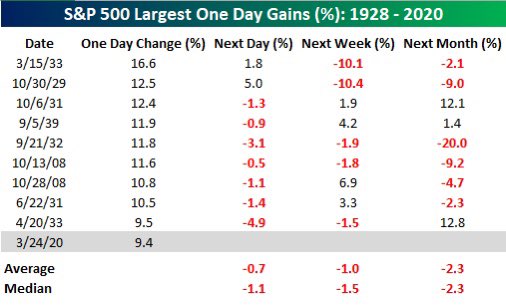
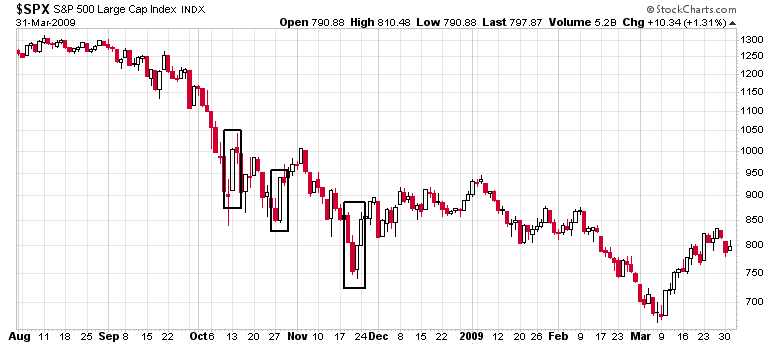
The market action in 2008 did show three similar instances of large single-day gains, with mixed subsequent results.
Why I am leaning bullish
On the other hand, the short-term bull case is underpinned by improving internals, and favorable market positioning. The most bullish opens up the possibility is a V-shaped rebound, which would confound everyone expecting a bear market rally that stalls and retests the old lows. Yesterday’s rally started the clock a the Zweig Breadth Thrust (ZBT) buy signal. The ZBT Indicator recycled off its oversold reading, and it has nine more trading days to reach an overbought condition. If it does in the short time window, it would qualify as a ZBT buy signal indicating positive price momentum. While I am open to all possibilities, I am watching the indicator, but I am not holding my breath for that outcome.

As well, market internals have been turning up, even before the latest rally began. Factor returns, as measured by the high beta to low volatility pair trade, and Callum Thomas’ coronavirus pairs consisting of a cruise line (RCL) vs. a funeral home (SCI, but he really had to dig deep to find that pair), and global airlines (JETS) to Chinese healthcare (KURE), are all signaling a return of risk appetite.

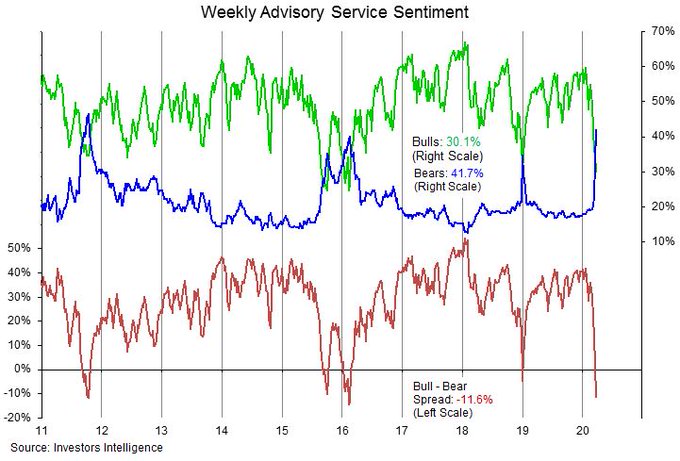
In addition, Investors Intelligence sentiment is turning more constructive. The number of bears have finally spiked, and they now exceed bullish sentiment. These conditions form the prerequisite for a market bottom.
Don’t fight the Fed
The Heisenberg Report recently featured the analysis by Charlie McElligott at Nomura, which indicated that the Fed is effectively building a short volatility position in its book.
The Fed is “not just acting as liquidity-, short-term lending- and USD funding-provider of last resort, but also now as the ‘chief risk-taker and CIO’”, McElligott goes on to say, adding that as of Monday, the Fed resumed building a ‘short volatility’ position”.
McElliogott explained the Fed’s short vol trade as not only just supplying liquidity to the market, but trying to narrow credit spreads through their actions in the credit markets. This does not mean, however, that the Fed is actively trading equity volatility derivatives.
We actually see the Fed in the game of not simply suppressing the risk-free rate, and thus term premium, as they did last time, but now buying spread product (beyond MBS alone) with risk assets outright and through the new SPV, it’s reasonable to believe that investors will ‘reverse engineer’ the Jay Powell playbook noted above, and go with their muscle memory from [the] Fed ‘short volatility positioning’ prior conditioning
Indeed, something odd has been going on with volatility in the past few days. The VIX had been falling even as stock prices fell, which could indirectly be attributable to the Fed’s actions. In addition, one helpful sign for equity and risk appetite bulls is the recent collapse in UST volatility. It is difficult to envisage market stabilization without signs of falling volatility in the risk-free asset.

The Fed’s actions have been mostly successful in stabilizing the credit markets. Do you want to fight the Fed?
Lastly, Goldman Sachs estimates that pension funds need to buy $214 billion in equities as part of their month and quarter end rebalancing, which should put a bid in the equity market starting next week.
My inner investor remains defensively positioned. Subscribers received an email alert yesterday that my inner trader had dipped my toe in on the long side. Initial resistance can be found at about 2650, and secondary resistance at about 2790.
The next test of market psychology will occur tomorrow morning with the closely watched initial jobless claims report. There have been numerous reports of surges of jobless claims all over the country, to the extent that state websites are crashing from the load. Initial claims are expected to explode to between 2 and 3 million. Bloomberg reported that unemployment claims spike to 929,000 in Canada. Given the roughly 10 to 1 ratio in population, this translates to 9 million in initial claims, so be prepared for an upside surprise. I will be closely watching this report, and the subsequent market reaction.
Disclosure: Long SPXL
Every analyst and their dog on Fox Business today assured us that the market would be making a new low soon. LOL
Keeping an open mind. It very well could make new lows.
Thanks, Cam.
What is a ‘primary low’?
I am confused. My understanding of the post is that we are in the process of making a bottom. A bottom around the low?
A primary low is the first major low in a bear market. If this is a primary low, then it should rally, and come back and retest the old low at some point in the future. The retest may not always be successful.
here are some examples of primary lows:
1) The post-9/11 selloff saw a panic selloff and primary low, which was followed a rally, but did not retest the old low until almost a year later. The test was unsuccessful, and it was followed by a double bottom in late 2002.
2) 2008 saw an lows in October and November, which could be described at primary lows (at the time). The market rallied and unsuccessfully retest the old low. It wasn’t until March 2009 that the final low was made.
Cam – Sorry, could you pls clarify what you mean by successful or unsuccessful retest.
Does unsuccessful retest mean that the market went under the previous (or primary) low or stayed above the previous (or primary) low?
Does successful retest mean a double (or triple) bottom?
Thanks!
Unsuccessful retest = violation of previous support, ad defined by the old low
ummm… wouldn’t a 9 million headline number be extremely bad hence bearish?
Or is this a case of “it’s so bad, how much worse could it get”?
Yes it would be very very bad. But then we’ve had good headlines and the market hasn’t responded. If we get a bad headline and the market doesn’t react negatively, then that would be a sign that the market is washed out.
Sell-side firms are expecting the number to spike to 1-4M for the week ending Mar 20. It can get to as high as 10M in coming weeks as the restaurant industry alone can lose 5-7M jobs.
I hope it doesn’t print 9M in tomorrow’s headline.
https://www.cnbc.com/2020/03/25/jobless-claims-expected-to-spike-to-a-record-breaking-number-in-the-millions.html
I quote Cam;
“The market action in 2008 did show three similar instances of large single-day gains, with mixed subsequent results”.
What is depicted in the graph is a double bottom in November’08 and March 2009 after 66% loss in a large index (S&P 500).
So, at some point, most asset classes become too cheap to pass by after loss of 50-60% value.
Here are examples:
1. US real estate from peak to bottom circa (2007-2012), lost 50% value give or take (many Americans back then owned more than one homes; the common non-sensical wisdom they had learnt was that houses always sell in America!).
2. S&P 500 2003 bottom, 2009 bottom: in the first instance, 50% loss. In the second instance 66% loss from the peak.
3. Gold from 2011 to 2019 (40% loss). Oil seems different (LOL).
Here is my conclusion:
1. Whether there is a durable bottom, depends IMHO on how much was lost prior to the bottom. After loss of 66%, stocks had no where to go but up, especially with the Fed coming to the rescue in 2008 (yes, without Fed, we could have lost 80%). Cam is absolutely right, usually a bottom must get a successful retest.
2. For now, the VIX index going lower (as stocks decline) is a fairly good sign of a market bottom.
3. I just came out of a corporate meeting and the average Joe Six pack is still bullish (!!). Most of my colleagues are looking to invest capital as they see this as a “back up the truck” and buy moment. Market bottoms are usually accompanied by people liquidating portfolios (not asking how much more can they invest). This group of colleagues was wildly bullish two years ago and too bearish in 2011 when S&P 500 was 1100 (they do not read Cam!)! Incidentally, our business is down 40%.
4. The average sentiment out there is that the epidemic will be over soon, say in a month or so. No one is talking what would happen if this thing drags on for another quarter. Conclusion: Too much one sided sentiment (that the epidemic will be over in a month or so!).
The real estate boom of last decade was driven by too much long sided interest in real estate, fanned by sell side interest (realtors), promoting the idea that houses in US are a good investment. How many short sided realtors were there, back then? Most of the realtors I discussed this idea in 2007, have gone under and lost their shirts and pants. This is not about realtor bashing, but about making sound decisions about investments.
So, let us circle 2650 and 2800, 38.2% and 50% retracement of 2200 bottom.
A lot of what happens in the next few months depends on how the corona virus is contained (or not). I am unsure whether we are able to control this successfully in the US, because of its relatively high infectivity and high mortality rate. Sure, the 2-4 Trillion $ bazooka would help, but it only buys time. It does not control nor treat the virus.
Let us watch NYC infection rates, as the President tweets, that the epidemic is under control.
Thanks for writing and posting this. Good to see the perspective of others.
I think it is too late to contain the CV in the US or in Europe. The virus was introduced to the US in Jan or even earlier in Dec. Enough time has passed for it to spread throughout the continent. The recent, harsher methods in some states may slow the spread, but the genie is already out of the bottle. The virus is already in all 50 states.
I hope the spread will slow in the summer but that is still two months away. Plenty of time to infect more people.
I don’t understand how we can return to normal life without knowing who is infected and who is not. We can’t practice social distancing (of six feet) in NYC Subways, restaurants or really in any public place. Without a testing of every person, and the subsequent social isolation of that person, the virus will continue to spread until there is herd immunity over the next year or two..
And then the fall will arrive.
Macro Charts has fully reversed his Historic Sell calls from late Jan. He is going Long.
https://twitter.com/MacroCharts/status/1242768188816924672
I think he is not expecting a retest of the lows.
Another viewpoint…
Sanjay,
I think MC’s signal can be compatible with Cam’s view expressed here, as in, a retest of the lows is expected.
Note the first green dot (great financial crisis of 08) from his image, market went on to make new lows after rallying 25%. I think that’s the most relevant data point out of 9, given similar level of financial stress and wide spread econ damage. Just my view.
Thanks for that chart.
.
It’s an investment model (as supposed to trading model), meaning even if there’s more downside, the upside to downside reward ratio is good for an investment time frame.
I agree with both of view. This is a long-term investment model which does not preclude the possibility of another low.
Still skeptical that all factors from this event have been priced in.
Interesting that initial claims came in at much worse than expected, and ES futures rallied over 1%. That’s what I meant by a test of market psychology.
Market strength on bad news is bullish (even though ES futures are still red before the open).
Do you think the market had already priced in the anticipated jobless claims and hence the ugliness prior to the last 2-3 trading days?
Remember when the Fed fired its bazooka (twice) and the announcement was only good for a one-hour rally? This is just the reverse.
Thursday was good close and good technical action (with large number of unemployment numbers etc. ), but Friday, today was not good. That said, for now the low is holding. VIX remains up and rallied into the close FWIW.
Even more surprising that the market completely ignored the news from Italy that the number of new infections in the Lombardy reaccelerated and that the situation in France is continuing to get worse.
Will it be bullish enough to get us past the first resistance (2650)?
First a pull back, more volatile side ways move, like what we saw today, on Friday. Let us pencil in 2300 on Monday and a rally into Tuesday (turnaround Tuesday).
JP Morgan’s model predicts the peak of the epidemic in early April in Europe.
https://twitter.com/HondoTomasz/status/1242703963666948097
That is interesting. Other than China (and who can trust their words) and a few countries near China the virus has not been stopped to my knowledge. There still is no treatment, cure or vaccine that is viable yet. Could the worst of it be yet to come?
And we’ve only seen one piece of economic data (claims) that is very ugly and many more are coming. I’m still very cautious in spite of my comment yesterday.
Today’s market action was very choppy between 800 and 1200 on the Dow except for the first hour and the last 10 minutes. I thought that was strange but not sure what it means.
So do we still think there will be a retest of the recent lows? Or are we back on the “Trumpian / FED / Congress throw money at it – we can outspend the virus” wild bull market again?
Triple 80% upside days have evidenced market bottoms in 3 out of 4 cases since 2002 with a glaring exception on January 2nd, 2009.
https://twitter.com/mark_ungewitter/status/1243300560868171777
For the past 3 sessions, a minimum of 80% of NYSE issues advanced, and 80% of volume went into those issues.
That’s happened twice before in the past 80 years.
The 1st kicked off the mid-80s bull market. The 2nd kicked off the 2009 bull market.
https://twitter.com/sentimentrader/status/1243269364608126977
Beware if these historical studies. We had so many historical study rules broken in the downdraft that can you really trust the same kinds of historical studies to the upside?
That makes sense. Thanks for your feedback.
I’m seeing more than a few people getting bulled up again.
I doubt if the virus and the concomitant economic and financial effects will go away so quickly unless we have a vaccine.
I noticed, too, that people were all bullish again today. Some were even talking like this was the new bull market and the down trend was over. People get too emotional.
WSJ proclaimed the start of a new bull market (market up 20%+ since the recent low) in a headline.
They have now taken the story down. I can’t find the headline now.
https://www.sfgate.com/coronavirus/article/san-jose-projections-coronavirus-testing-15159836.php
Markets supposedly bottom well ahead of the news – in this case, I’m not convinced it’s already priced in the effect of the virus on the US. Current fatalities are 17 in Santa Clara County, 5 in San Mateo County, and 2 in San Francisco. If projections for at least 2000 fatalities in Santa Clara County over the next three months are correct, then a-35% correction feels off (and based on the numbers coming out of New York and New Orleans the Bay Area may do relatively well).
Are death in Santa Clara County related to correction in S&P 500?
Absolutely. Whether the correction anticipates/precedes the data or catches up to the data, the data point itself (along with associated ripple effects) reflects the impact of the pandemic in the US and will be incorporated into S&P 500 price movements.
If this comes true as soon as the next couple weeks I think it could take the market to news lows.
“COVID-19 could lead to more than 80,000 deaths in the US and overwhelm hospital capacity nationally as soon as early April even if social distancing measures are respected, new research showed Thursday.”
https://news.yahoo.com/us-virus-deaths-may-top-80-000-despite-161924116.html
Just to clarify:
The analysis estimated that approximately 81,000 people in the US will die from the virus over the coming four months.
Estimates ranged between 38,000 and more than 160,000.
During the epidemic peak — also set for some point in April — as many as 2,300 patients could die every day, according to the IHME models.
Exactly. These numbers are the most accurate predictions we have, generated by analysts who presumably know what they’re doing.
In contrast, the Administration wants to see a return to business as usual by mid-April. The rationale is flawed. Sure, the longer businesses remain closed the more difficult the recovery – but a premature return to business that escalates/ extends the national epidemic is far worse.
Friends, there is a lot of discussion on corrections and double bottoms.
See Cam’s graphs from posts in the last week. Major correction, simply DO NOT end without a double bottom.
Furthermore such double corrections historically do not end in weeks, but months.
A great perspective of 1929-1932 market
https://twitter.com/TheChartmeister/status/1243528926309363712
Thanks; that said, check what happened after 1932 (the bear market continued until 1941; the 1929 peak was not recaptured till 1952!!). That said, the US economy was much different then, there were policy errors that were made.
I am seeing more and more people speak up that the cure may be worse than the disease.
Here are two articles worth a quick glance.
Japan’s winning its quiet fight against Covid-19
A different approach has worked wonders in the Land of the Rising Calm with a minimum disruption to daily life
https://asiatimes.com/2020/03/japans-winning-its-quiet-fight-against-covid-19/
Jacob Wallenberg: “There will be no recovery. There will be social unrest. There will be violence. There will be socio-economic consequences: dramatic unemployment. Citizens will suffer; some will die”
https://www.ft.com/content/3b8ec9fe-6eb8-11ea-89df-41bea055720b
This may become an issue:
https://www.businessinsider.com/coronavirus-spain-says-rapid-tests-sent-from-china-missing-cases-2020-3
Wow! Missing 70% of the positive tests. That’s huge. Thanks, rxchen2. I read that China has stopped testing all together. You can’t report new cases if you don’t test for them.
Whether we have a double bottom at primary low or go down and have a V (2009 bottom) remains to be seen. All financial models are based on historical comparisons which, in my opinion, do not fully apply here.
We are dealing with a biological phenomenon that is still evolving and not well understood. Forecasts are based on major assumptions that may not hold up. As Arthur Burn once said – ‘Forecast but Forecast Often’. All these models will evolve. Uncertainty and fear are two major challenges that we confront.
I am hopeful. The Governments all over the world are proactively engaged (some more than others), top scientists and researchers are engaged in this battle, Corporations are stepping up to help (Banks in much better shape), Monetary policy for once is ahead of the curve (whatever it takes moment), fiscal policy in full force (with minor hiccups), and most importantly the people of our nation are engaged. The curve will flatten sooner than later. Algo’s will do what they do in the meantime. Trading this market needs nerves of steel and capacity to absorb losses. Cam’s analysis is very helpful but not foolproof.
It is a fight for our survival and future and we will come out on the other side, bruised but not beaten, ready to rebuild and grow. That is who we are and that is what we do.
Stay safe, stay well and help those who need it.
Good catch all, pithy note. Thanks.
This very tepid response to the House passing the bill is suggestive of Buy the Rumor, Sell the Fact. I presume Mr. Hui is using the term Primary Bottom for Intermediate Bottom. Can we say that there was close enough capitulation to call such a bottom? If today’s close barely reaches yesterday’s close, why would we bet on an up day Monday? What good news could transpire over the weekend?
Don’t get greedy. We had a very strong 3 day rally, so it’s not surprising to see some pullback. Next week we should see fund flow support from portfolio re-balancing as bonds have wildly outperformed stocks. It’s quarter end, and balanced funds will start to re-allocate from bonds to stocks.
Agree wholeheartedly with your perspective. A pause in a torrid rally was expected.
I think the passage of the bill was a given. No news there.
Like Cam said, we had a strong rally over the last three days. I think it is also prudent to take some risk off going into the weekend.
“My glass-half-full assessment is further supported by the potentially large rebalancing that is coming our way over the next week. My back-of-the-envelope calculation shows that a 60/40 stock/bond portfolio in mid-February has now become a 51/49 portfolio, entirely on the basis of market action. This is very large drift in a very short time. Given the many trillions of dollars in assets that follow some sort of multi-asset class approach, the coming rebalance could well be in the range of a few hundred billion.”
https://www.fidelity.com/learning-center/trading-investing/markets-sectors/stock-market-drops-2020?ccsource=em_Service_923250_1_0_2020_Harry