The following note is addressed to short-term traders with time horizons of a week or less. I would like to highlight some three bullish, and one cautionary data points.
First, the latest update of the Citi Panic/Euphoria Model is solidly in panic territory. This is contrarian bullish, but recognize that the bullish call is based on an intermediate term time horizon.
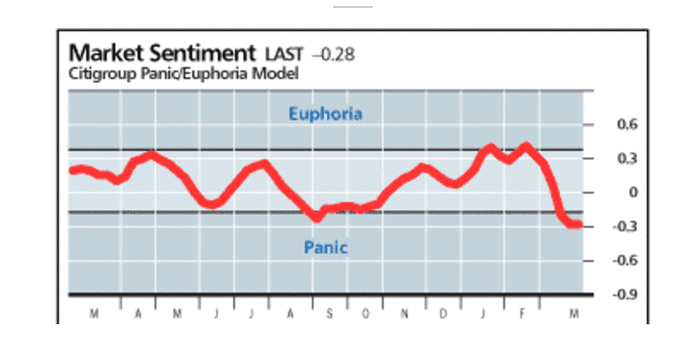
There is an encouraging sign for short-term traders in this model. Luke Kawa pointed out that sentiment had turned suddenly, and momentum is positive. Tobias Levkovitch, the keeper of the Panic/Euphoria Model, found that “Fund managers and institutional investors went from worrying about their personal safety (‘should I buy a gun?’) to having conversations expressing hope a market bottom had formed in the span of five days”.
These comments show that institutional managers are as human as the rest of us. I conclude from this that the rally is a bull trap, but if institutions are ready to hop on the bullish train, there could be further upside in the short run.
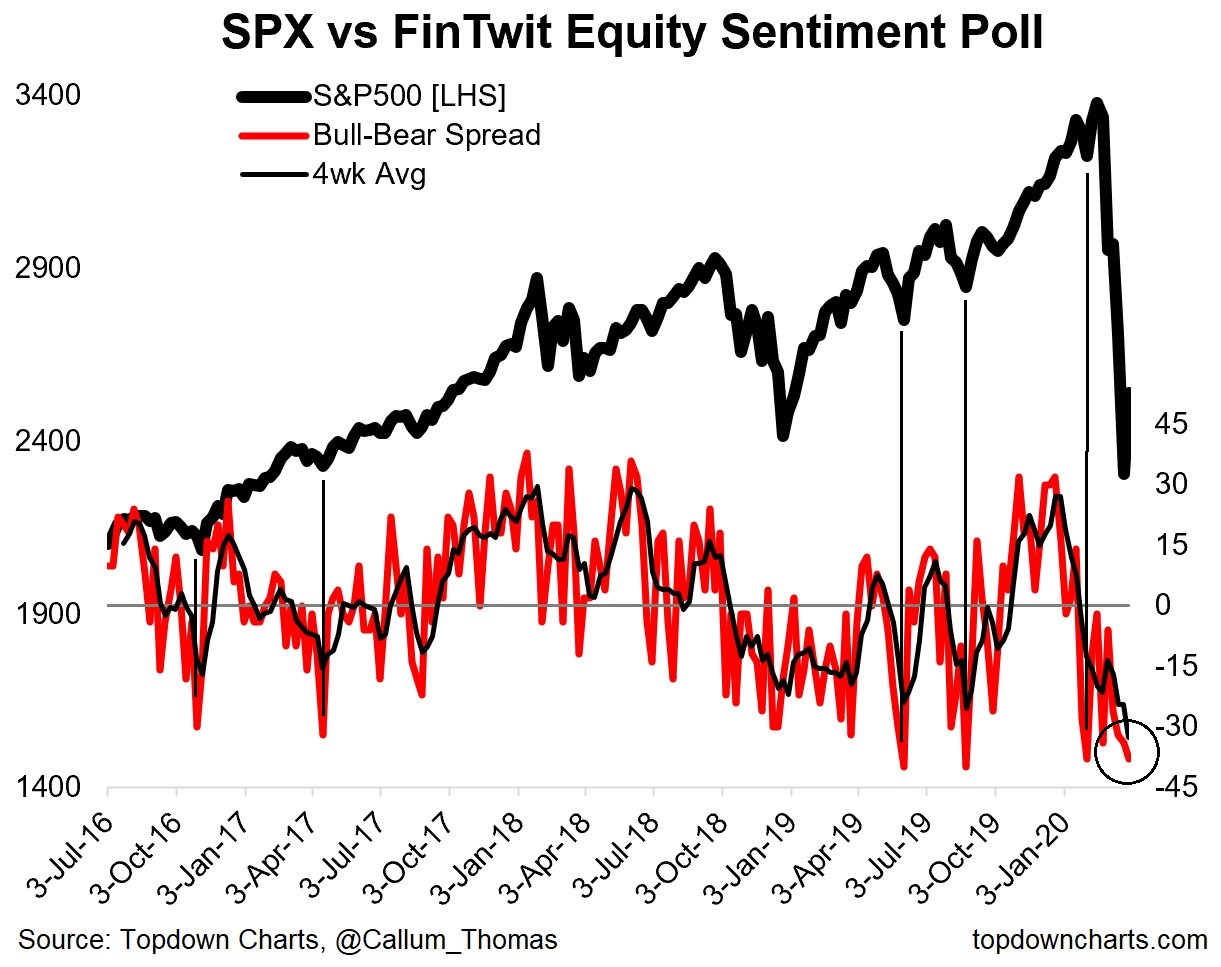
My short-term bullishness is supported by the weekly (unscientific) Twitter poll conducted by Callum Thomas of Topdown Charts. I was surprised to see that overall bearishness had risen despite last week’s price rebound. Such levels of bearishness have signaled tradable rallies in the past.
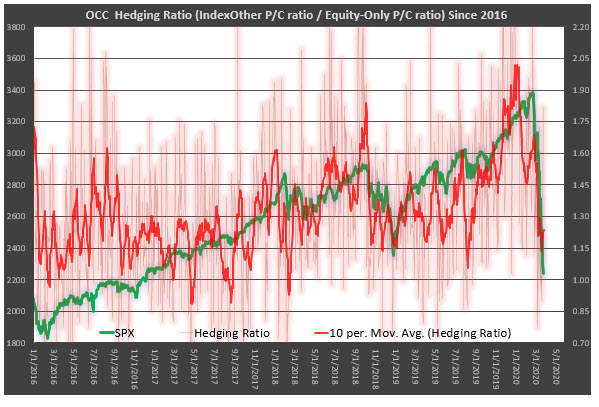
Analysis from Chris Prybal of Schaeffer’s Research confirms my interpretation of a sentiment wash-out. Instead of just examining the put/call ratio, Prybal constructed a hedge ratio based on changes in the put/call ratio and market movement.
Using OCC’s volume data, I’ve developed a “hedging ratio,” derived by taking the daily index/other put/call ratio and dividing that by the equity-only daily put/call ratio. The underlying hypothesis is that there may be a rush to hedge or buy index puts during periods of market turmoil — and so, by comparing the index activity against the equity-only reading, we can shed some new light on the underlying dynamics of the options market.
Using a 10-day moving average to smooth out the daily readings, the OCC hedging ratio has clearly plunged. However, the ratio has not set a new low. It’s critical to know that spikes in this OCC hedging ratio have aligned with many market tops in the past, while low hedging ratio readings have usually corresponded with market troughs.
One word of caution
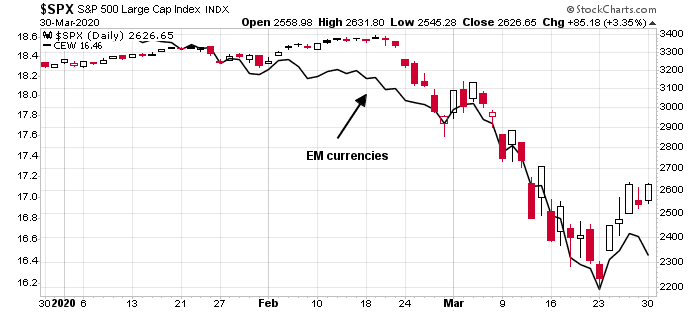
Despite my short-term bullishness, I noticed a worrisome nascent negative divergence today. The stock market had been highly correlated with the strength of EM currencies, as measured by the EM currency ETF CEW. We saw the USD strengthen today, and CEW fall, even as stock prices rise. CEW and SPX had been moving in lockstep in the past month.
What about the Fed’s swap lines that alleviated shortages in the offshore dollar market? FT Alphaville recently featured an article by Wenxi Du of the Booth School at the University of Chicago. She explained that the current episode of offshore USD shortage is different from 2008:
The sudden stop in dollar funding in the last couple of weeks accompanied by crashing asset prices and a sharply appreciating dollar evokes memories of the global financial crisis of 2008. However, there is one key difference: then it was about overleveraged banks, now non-banks are a much bigger part of the story.
Post-crisis regulation made low-margin balance sheet intensive market-making and intermediation activities unattractive to banks due to constraints on leverage. In their place came non-banks, including portfolio investors and nonfinancial corporations (NFCs). They are now playing a much bigger role in the market for short-term dollars. Institutional investors such as life insurers and pension funds from around the world have become the key protagonists, especially in the market for dollar-denominated securities.
A life insurance company from the euro area has obligations to its policyholders in euros, but will typically hold a globally diversified portfolio with a substantial portion being dollar-denominated assets. Hedging the currency risk entails finding a bank that will lend dollars in exchange for euros, with an agreement that the dollars will be repaid for euros at a fixed point in the future, and at a pre-agreed exchange rate – known as an “FX swap”.
NFCs are also enmeshed in global value chains and need short-term dollar funding to finance their working capital. When direct dollar funding sources are not readily available, NFCs can raise dollars in the FX swap markets.
As you recall, the Lehman Crisis blew up because financial institutions refused to lend to each other in the overnight market. The Fed was helpless in the face of the crisis because many of the troubled institutions were non-banks, which could not access the Fed’s discount window. It led to the collapse of WaMu and AIG. This time, it’s playing out again, but in the offshore dollar market. Many of the institutions that lack USD funding are non-banks. While the Fed could and did establish swap lines with local central banks to alleviate shortages, the liquidity transmission mechanism is faulty, and may create further tensions.
My inner trader remains nervously long, and he is watching the offshore USD market, and EM currencies in particular for signs of stress.
Disclosure: Long SPXL
“These comments show that institutional managers are as human as the rest of us. ” I had no idea: really?
I guess funds flowed into the US stock markets, but both US and global ADs foretell downward moves.
I would like to add another parameter for our friends here to consider why institutions suddenly reversed the thinking. What is the most watched number now in the whole world? The answer is: Daily New Cases (worldwide) of this new coronavirus. Pls read this page daily.
https://www.worldometers.info/coronavirus/coronavirus-cases/
The new cases looks like having peaked out. Look at the Ro value (aka growth factor) is now 0.90. It has trended down decisively since 2/21, the Fri before the avalanche started in the following week. Yet we are bombarded by MSM and vested interest groups with scary headlines and hyperbolic numbers everyday nonstop. Last week the forecasters from ICL and Cambridge revised the number of potential deaths in UK from half million to 20K. This is ridiculous and irresponsible. I also remember the Harvard guy who predicts 90 million deaths worldwide back in early Feb. Bunch of eggheads lacking real-life skills. I also think CDC will be proven very wrong.
Criticisms aside, the probability is going higher for a quick rebound if the daily new cases (or Ro) continue to trend down. Don’t be surprised if big money starts to jump the gun. The effect will be immediate. It will wake up all sorts of algos in no time.
See this account from FT Alphaville on why the Imperial College projections went down to 20K. Short answer is the assumptions changed.
Free registration required: https://ftalphaville.ft.com/2020/03/26/1585245384000/Let-s-flatten-the-coronavirus-confusion-curve/
I think you are mistaken about growth factor and Ro. Growth factor changes every day. My impression is that Ro describes infection rates, is an (unknown) constant that has been estimated at 2.5 compared to flu’s 1.0 to1.5 or so.
New cases only went down for Mar 29th. I won’t read too much into that. I would like to see a few more days of new cases going down. They should trend down with the US and Europe being locked down for two weeks now.
I agree with your criticism of media and the experts. On the other hand, these wild forecasts bring the attention to the seriousness of the issue. If the ICL/Cambridge would have forecasted only 20K deaths, Boris Johnson would have done nothing.
The odds of Trump winning the election have been going up since Mar 23, 2020. I wonder if that played a part in the market jumping up.
https://www.predictit.org/markets/detail/3698/Who-will-win-the-2020-US-presidential-election
BlackRock’s Fink seems to not think that there is much of a recession. To wit:
“As dramatic as this has been, I do believe that the economy will recover steadily, in part because this situation lacks some of the obstacles to recovery of a typical financial crisis”
https://www.cnbc.com/2020/03/30/larry-fink-says-economy-will-recover-from-coronavirus.html
Are we in a recession or a V shaped market (or a W ot L shape… or something else…)
Here’s a better link for Corona Virus.
https://ncov2019.live/data?fbclid=IwAR3NOTrG4_pAE3rFs6gPJFEtg_L-_IsRfYI81Hrhr_5FYOPD3W3AgWXIQ60
How serious is this?
With the Fed buying MBS, the interest rates are heading lower and blowing up the hedges mortgage bankers buy to protect themselves against the rise of interest rates.
“The huge volatility in mortgage bonds created massive margin calls from the broker-dealers, who wrote the hedges, to their mortgage bankers.”
https://www.cnbc.com/2020/03/29/mortgage-bankers-warn-fed-purchases-of-mortgages-unbalanced-market-forcing-margin-calls.html
Cam, two weeks ago you wrote:
>>>
The US population is about 330 million. Harvard epidemiologist Marc Lipsitch has projected that 40-70% will be infected. Most cases will be mild.
https://www.theatlantic.com/health/archive/2020/02/covid-vaccine/607000/
Let’s take the lower 40% figure, and assume that 5% of the cases require hospitalization. That comes to 6.6 million people. While they won’t all need hospitalization all at the same time, the US just under 1 million hospital beds. Only a fraction of them are ICU beds. Assuming that a low-ish 1.5% fatality rate (lower than China), that comes to about 2 million dead.
<<<
Have your assumptions changed?
If nothing is done the assumptions wouldn’t change at all. Here are some questions for you?
1) Is there some way that the case fatality rate changes from the Chinese data, which is where I took my original estimates? The CFR in Italy, which is a well served G7 country with a first rate medical system, is even higher at 5%.
2) If the US isn’t locked down, what makes you think the infection wouldn’t overwhelm medical capacity, which would exacerbate the CFR?
3) Are there any variations in my parameters that you could point to to support either higher or lower results? This is simple math that a 10 year old can do.
In the Imperial College study he changed his assumption from a do nothing scenario to a full lockdown, which is how he arrived at his lower figure. What policy changes can you suggest to lower the output in the model?
I take it the answer is ‘no’.
‘If the US isn’t locked down…’ – California and many other states are ‘locked down’. (Not all states, as unfortunately Mr ‘Literally Hitler’ has deferred to the states in imposing heavier restrictions.)
Your assumption that covid-19 is being left to run unbridled through the US is fundamentally at odds with the actions being taken.
Here is a model that actually takes these actions by the various states into account.
It’s intended to identify capacity constraints. Some states are looking at more problems than others.
The projection for the whole of the US centers around 80k deaths. The model doesn’t show a predicted number of infections, so can’t impute CFR.
The model for California, where I and 13% of the population live, shows no hospitalization capacity constraints. (Notwithstanding, the state is planning for 50k additional beds, including 10k ICU.
We will have a good idea how accurate it is in a couple of weeks.
https://covid19.healthdata.org/projections
Arguably the US fatality rate is likely to be higher than Europe because of lifestyle considerations. 42% of the US is obese. About 1/3 are diabetic, which is a risk factor with covid-19. By contrast the diabetes rate in Europe is 7-10%.
As examples, have you seen fat cops in Frankfurt or Paris, compared to American cities?
Diabetes Prevalence:
US – 10.8
Germany -10.4
Italy -5.0
How are covid-19 patients faring in Germany vs. Italy?
https://data.worldbank.org/indicator/SH.STA.DIAB.ZS?name_desc=false
Len g
Diabetes may be just one factor; there are others that are different between Italy, Germany and USA. Data that you submitted, supports just that. When all is said and done, there will be regression analysis that will be published that parse out the more relevant factors. Here is more food for thought;
https://www.sciencealert.com/the-new-coronavirus-could-have-been-percolating-innocently-in-humans-for-years
What are your thoughts on quarter-end flows and their potential impact on this rally? It seems like PMs don’t want to be caught with a cruise operator or airlines on their 13F and are rolling into more conservative names (i.e. churn). Conversely, I wonder what the odds are that PMs start to bottom pick in high-vol names come April 1st? It seems like if this short-term rally continues that could be a tail wind. Either way, the new quarter may be a catalyst for stocks to make their move, one direction or the other.
Hi Cam, can you please kindly inform when you are out of SPXL position? Many thanks!
I always send an alert when I fully exit a trading position
I’m reading more about grocery store supply chains failing. The implication is that we can’t rely upon them to have food and necessary supplies down the road. What if the infections and deaths slow down by remain high into summer? We could see some economic collapse.
And, I’m seeing reports that the real toll in Wuhan is around 40,000 deaths so far. We may be under a false hope that this will be mostly over in a month or two.
Hi Wally, Would appreciate if you can also post the sources for this information.
Sanjay, this prepper site pretty much sums up what I am reading from sporadic reports elsewhere. And our Krogers grocer here in Texas is having trouble keeping shelves stocked.
http://endoftheamericandream.com/archives/supplies-are-starting-to-get-really-tight-nationwide-as-food-distribution-systems-break-down
Let’s not get too crazy….
The question this afternoon is what happens tomorrow with a new quarter? It would seem any advance buying or balancing of portfolios has been accomplished this last five days of up markets.
I was thinking that today will be easy day – straight UP – rebalance in the making. Nothing like this happened. Hope that projection of 2650-2700 will come true. Cam, thank you very much for your posts.
Hi Petr, I see a rising wedge on the daily S&P 500 chart which is bearish and it has been bouncing off of the 1000 dma. Maybe Cam will elaborate on these formations in his next analysis post.
Hi Wally, I agree with you. But lets focused on daily pattern. There is wave A (2180-2630)+ B (2630-2470) – C ?. Moreover there is nice triangle (ending wave B). To be honest I nervously watch the price action. Due to the lack of courage I did not sell my trading account as the price declined under 2700. My fault. 🙁 Perhaps Cam can add some comment in relation to the above.
Petr, can 1 day a wave B make? I guess if you are looking at an hourly chart. But if so, then wave C could have been completed today with a daily trading high of 2641.39 which was higher than the previous reaction trading high of wave A 2637.01 on Thursday. I don’t know if those moves would violate a wave counters rules or not since I don’t count Elliot waves.
Unfortunatelly you were right.
https://www.yahoo.com/news/more-70-americans-hospitalized-covid-213700164.html
https://www.cdc.gov/mmwr/volumes/69/wr/mm6913e2.htm?s_cid=mm6913e2_x
So, patients with significant his factors seem to have higher mortality, or so it seems, for now.
“These results are consistent with findings from China and Italy, which suggest that patients with underlying health conditions and risk factors, including, but not limited to, diabetes mellitus, hypertension, COPD, coronary artery disease, cerebrovascular disease, chronic renal disease, and smoking, might be at higher risk for severe disease or death from COVID-19 (3,4)”.
Until I see tape that’s much easier to trade or a market that shows signs of sustained growth, I am staying out.
Is this the first one?
Credit hedge fund EJF suspends redemptions in sign of market stress
https://www.fnlondon.com/articles/credit-hedge-fund-ejf-suspends-redemptions-in-sign-of-market-stress-20200331
Anyone familiar with Marc Lasry’s performance record? He’s from the credit side and he seems chill about the corporate credit market in that there’s lots of opportunities there or maybe he’s just talking his book so that he can slow down redemption of his fund. Mr El-Erian seems to suggest buying index is still isn’t safe but he doesn’t seem to be against picking individual stocks. Mike Wilson seems to think new lows isn’t likely. Scott Minerd, another manager I have no idea of, is quite bearish in the credit market by saying that outside of corporate credits things are still looking quite grim and that the fed will have tough time providing liquidity in those other areas of credit market.
Benny, I try not to confuse myself with other opinions since we have Cam and few others have a clue. Besides, I have enough opinions of my own if I want to deviate from what Cam is presenting. LOL
Wally, that’s understandable and I can kinda guess what lol. Cam is definitely helpful and just want to find some other useful experts. As an update, add Mr Gundlach and Howard Marks in the camp that expects to see more decline.
Cam, you just sent out a trade alert going short, do you expect new lows or simply a retest?
Not sure. I am inclined to let price and internals decide. This is like pornography, I’ll know it when I see it.
That may be the best explanation I’ve heard on seeing a bottom.
Is this just an overreaction to President Trump’s remarks that the next two weeks are going to be painful? Wasn’t that expected?
Cam, would appreciate your feedback on re-balancing. Is that over or the technicals have just taken over?
We can ascribe different reasons for market movements. I still have no idea why the market reaction to the last two Fed bazookas amounted to only a one-hour rally in ES futures before the open.
At this point, much of the market movement can be attributable to positioning, sentiment, and clues from market internals.
For now, today’s sell off is pretty orderly, FWIW, almost too orderly. Though we are down by 114 points on the S&P 500 (4.43%), it almost feels like a seller exhaustion is setting in.
It is 3 pm as I write on the East Coast, and I would like to see if we have a waterfall decline into the close.
2. Will watch after 4 pm, futures (till 5 pm) into close of futures markets (several free platforms are available for this e.g. Barchart, 10 minutes late information).
3. Will be watching the reaction to bad unemployment numbers tomorrow. For now, we know numbers will be bad, but let us focus on the reaction to the numbers. This is important.
4. VIX index did not rise today as much as one would have thought.
5. Gold is not rising either.
6. Bonds can only rise so much, and are trying to retest the lows set in March.
7. Still waiting for a plateau in NYC.
8. Lot of epochal/canonical warnings are starting to surface about global change! Though not willing to give in to such ideas, the US may be in for a long period of recovery after this year.
9. The 2630 brick wall of resistance last few sessions was pretty stark, but I did not sell because of greed.
10. Would like to see another few days of jaw jarring 9:1 days of down to up volume, though we may have already seen it.