Preface: Explaining our market timing models
We maintain several market timing models, each with differing time horizons. The “Ultimate Market Timing Model” is a long-term market timing model based on the research outlined in our post, Building the ultimate market timing model. This model tends to generate only a handful of signals each decade.
The Trend Asset Allocation Model is an asset allocation model which applies trend following principles based on the inputs of global stock and commodity price. This model has a shorter time horizon and tends to turn over about 4-6 times a year. In essence, it seeks to answer the question, “Is the trend in the global economy expansion (bullish) or contraction (bearish)?”
My inner trader uses a trading model, which is a blend of price momentum (is the Trend Model becoming more bullish, or bearish?) and overbought/oversold extremes (don’t buy if the trend is overbought, and vice versa). Subscribers receive real-time alerts of model changes, and a hypothetical trading record of the those email alerts are updated weekly here. The hypothetical trading record of the trading model of the real-time alerts that began in March 2016 is shown below.
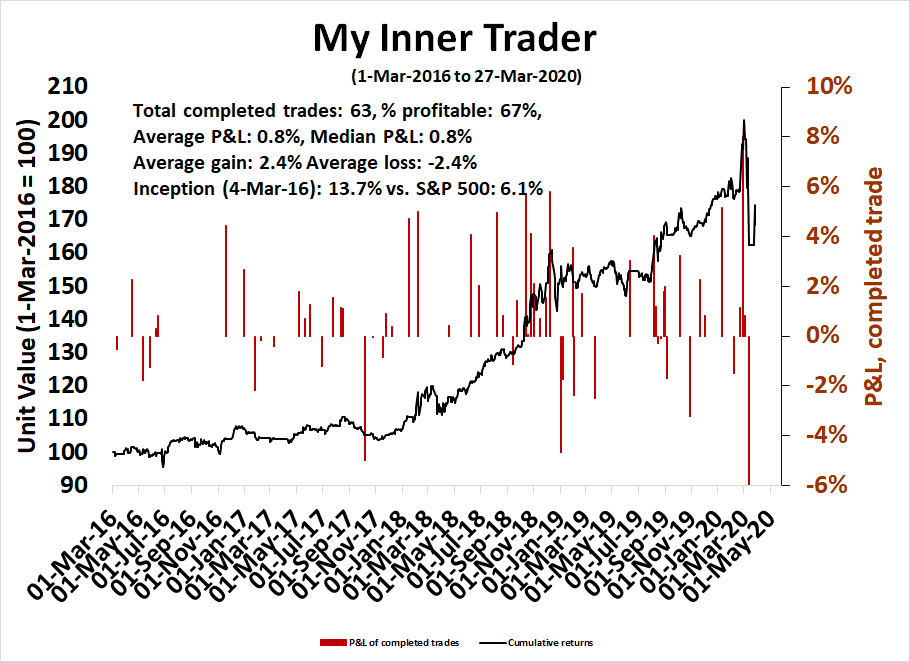
The latest signals of each model are as follows:
- Ultimate market timing model: Sell equities
- Trend Model signal: Bearish
- Trading model: Bullish
Update schedule: I generally update model readings on my site on weekends and tweet mid-week observations at @humblestudent. Subscribers receive real-time alerts of trading model changes, and a hypothetical trading record of the those email alerts is shown here.
A new bull?
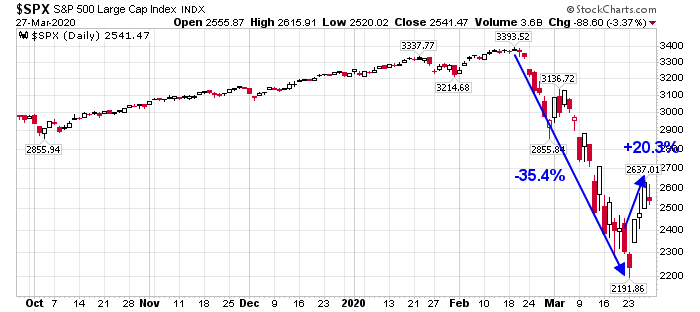
A week ago, I was impatiently waiting for a bear market relief rally (see This is insane! Where’s the bear market rally?). The market gods heard my pleas, and the market surged 20.3% from intraday trough to peak last week, which is enough to pass the definition of a new bull market.
Does that mean we just entered a new bull market after exiting the fastest bear market in my lifetime? Let’s consider the issues from a variety of perspectives.
Earnings, earnings, earnings!
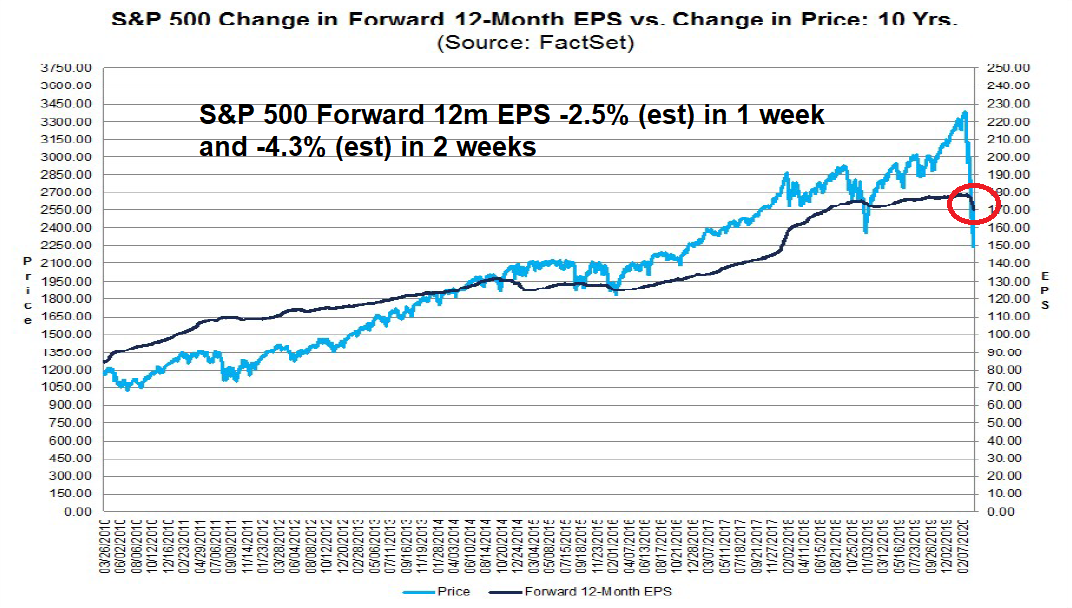
Let’s begin with the fundamentals. The price of stocks depend on earnings, earnings, and earnings. FactSet reported that the S&P 500 is trading at a forward P/E of 15.5, which is between its 5-year average of 16.7 and 10-year average of 15.0.

The rise in the forward P/E ratio is attributable to a combination of rising prices and falling forward earnings. Wall Street analysts have finally begun to downgrade EPS estimates, and forward earnings skidded -2.5% in 1 week and a cumulative -4.3% in two weeks.
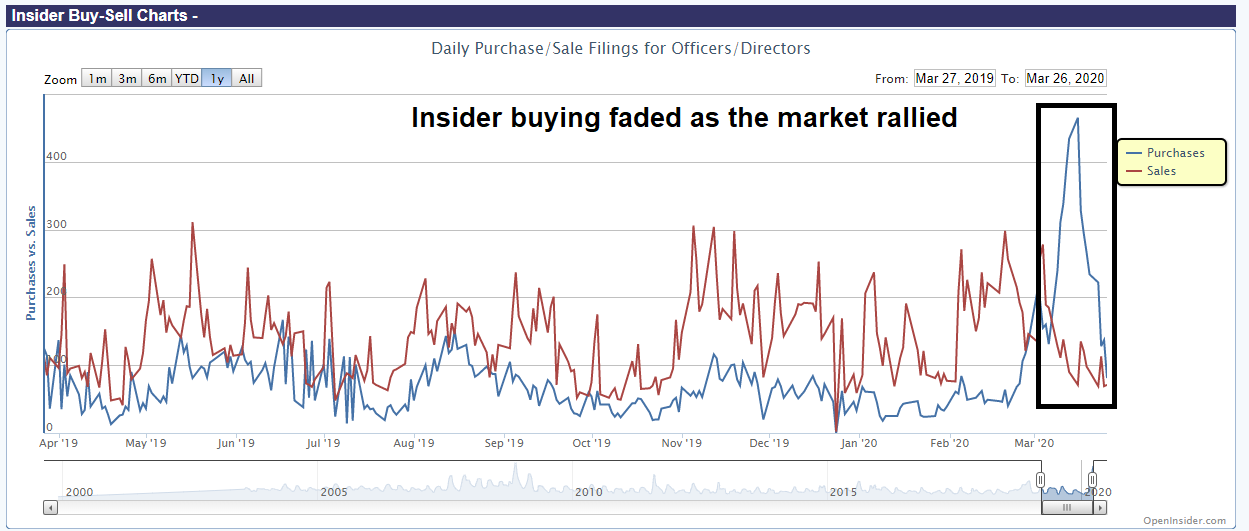
Corporate insiders have shown themselves to be highly valuation sensitive during this downdraft. A concentrated cluster of insider buying appeared just as the market fell, but buying evaporated as the market recovered.
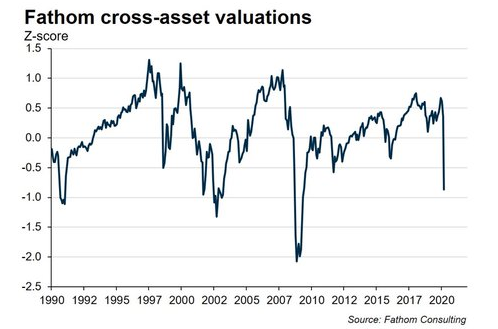
Does that mean that stocks are no longer cheap? Well, sort of. Fathom Consulting recently introduced a valuation model based on cross-asset valuations. It shows that equities are cheap, but they could become even cheaper.
Macro outlook
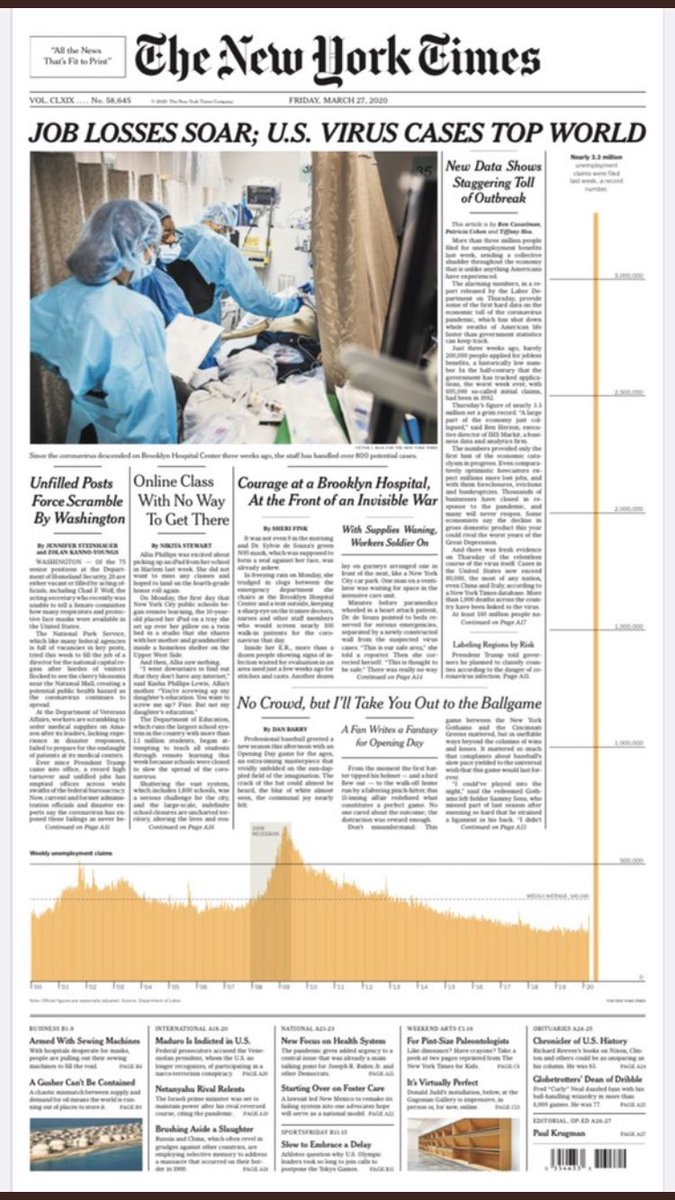
So far, the market hasn’t shown much reaction to macro developments. Nevertheless, the major highlight last week in top-down macro data was initial jobless claims. The chart from the from page of the New York Times is certainly a front page for the history books. Wow!
What does the surge in jobless claims mean? The spike in claims translate to an unemployment rate of roughly 5.2%. Wall Street’s Q2 unemployment rate estimates vary wildly, but the consensus is around 7%. As an aside, please be reminded that next Friday’s Non-Farm Payroll report will not show a jump in unemployment from 3.5% to 5.2% because the jobless claims spike occurred after the reference period.

The rise in jobless claims triggers the Sahm Rule, which calls for a recession whenever the unemployment rate jumps (see FRED graph after the NFP report).

Nautilus Research found that sudden surges in jobless claims has historically been unfriendly to stock prices. Even though the sample size is small (n=7), forward returns are especially bearish on a 3-6 month time horizon.

Technical outlook
What about the outlook based on technical analysis? The indicators are mixed and confusing. Bullishness and bearishness are in the eyes of the beholder.
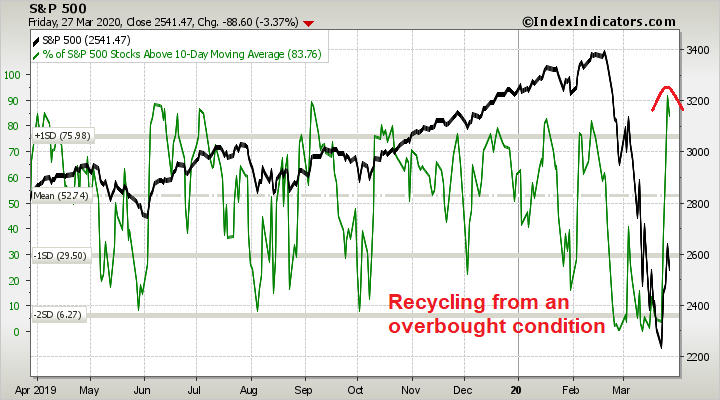
Short-term breadth is recycling off an overbought extreme, which argues for weakness early in the week.
On the other hand, longer term breadth indicators are tracing out a bottoming pattern, indicating that this rally could have some more legs.

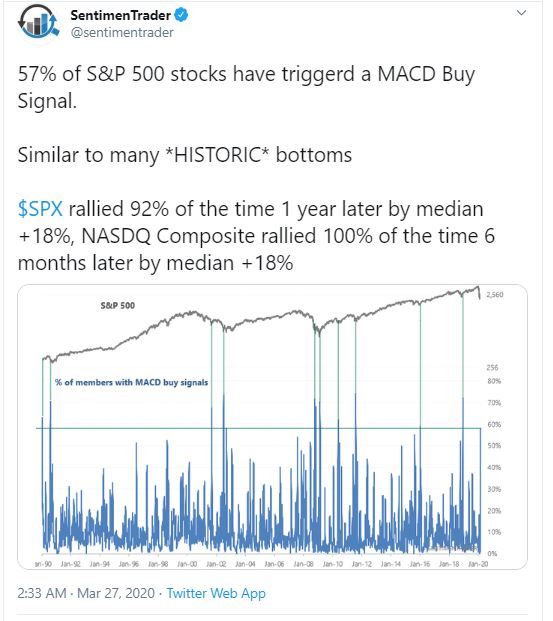
Similarly, SentimenTrader observed that 57% of the S&P 500 have triggered a MACD buy signal, which is a bullish price momentum signal. The key caveat to that buy signal is that it has occurred during bear market rallies in the past. While the market may have been higher in a year’s time, the shorter term outlook may not necessarily be as bullish.
Speaking of price momentum, there is still time for a bullish Zweig Breadth Thrust buy signal to develop. As a reminder, the market has up to 10 trading days after the ZBT Indicator recycles off an oversold reading. Day 1 was last Tuesday. We have another six trading days. Stockcharts is late in updating their ZBT Indicator, so I made my own real-time estimate (bottom panel). Based on current readings, it would only take one more day with a 3%+ price surge to achieve this buy signal.
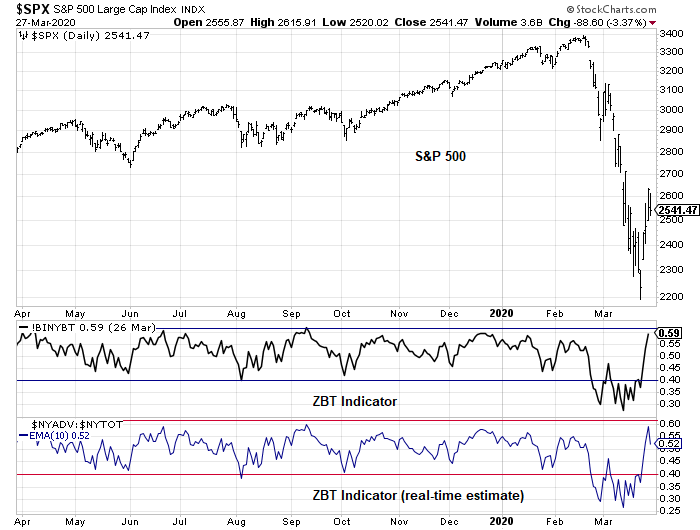
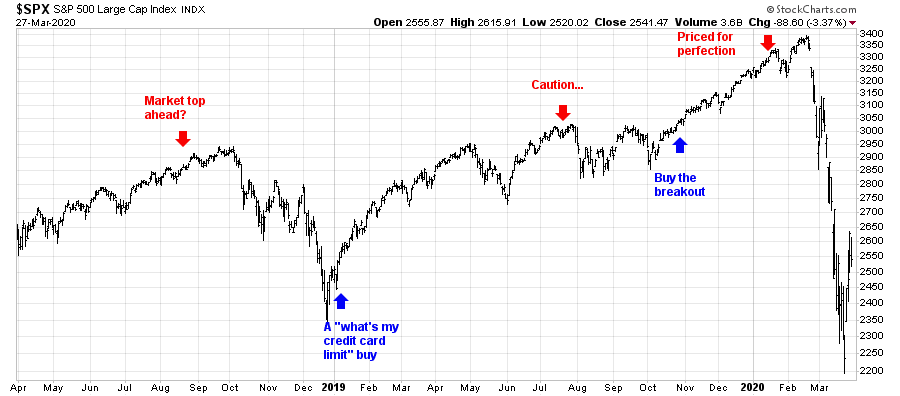
While I am not holding our breathes for a ZBT buy signal, the last one (see A rare “What’s my credit card limit” buy signal, published on January 7, 2019) managed to catch the market surge after the 2018 Christmas Eve bottom.
Still a bear market
So where does that leave us? My working hypothesis is this rally is a bear market rally. Bloomberg’s Canadian reporter Luke Kawa gave readers a history lesson last Friday when he compared last week’s market action to 1933:
Even foreigners — well, at least Canadians — learn what happened stateside during the Great Depression, from the duration and magnitude of the human suffering to the policy prescriptions to try to address it. So when financial markets start rattling off superlatives that end with “since 1933,” it’s time to think about what transpired back then and the results we’d like to avoid. Even when it’s tied to good news. On Tuesday, the Dow Jones Industrial Average posted its biggest one-day gain since March 15, 1933. The latter was the first session markets reopened following an extended bank holiday instituted by President Franklin Delano Roosevelt, because so many of them were failing in the midst of a bank run. In the interim, the Emergency Banking Act was passed. That created the Federal Deposit Insurance Corporation, effectively guaranteeing Americans could trust the banks with their savings. Thursday marked the culmination of the biggest three-day rally in the S&P since the period ending April 20 1933 — when FDR took the radical step of de-pegging the U.S. dollar from the gold standard. These were policy actions that succeeded in chopping off the left tail of systemic financial instability, much like the modern-day Fed’s increasing suite of programs to address liquidity and credit risk. In the 1930s, these measures were accompanied by expansive fiscal policy, as is expected today.
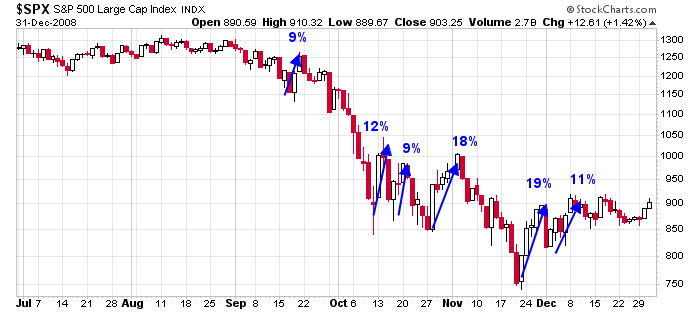
If last week’s market volatility was last found during the time of the Great Depression, it is difficult to believe that we have suddenly exited the shortest bear market in history. Daily index price swings of 3% and 5% simply do not occur in bull markets. This kind of market action is the signpost of a bear market. The 2008 bear market experienced numerous brief and sharp rallies of between 9% and 19% within the space of four months.
As well, any declaration of a new bull market has to tempered by the observation that the percentage of stocks above their 50 day moving average is only 1.8%, and above their 200 dma is 6.2%. Arguably, equity market strength could be explained by Fed action to establish dollar swap lines. The initiative sparked a decline in the USD which alleviated a lot of the tensions in the offshore dollar funding market.
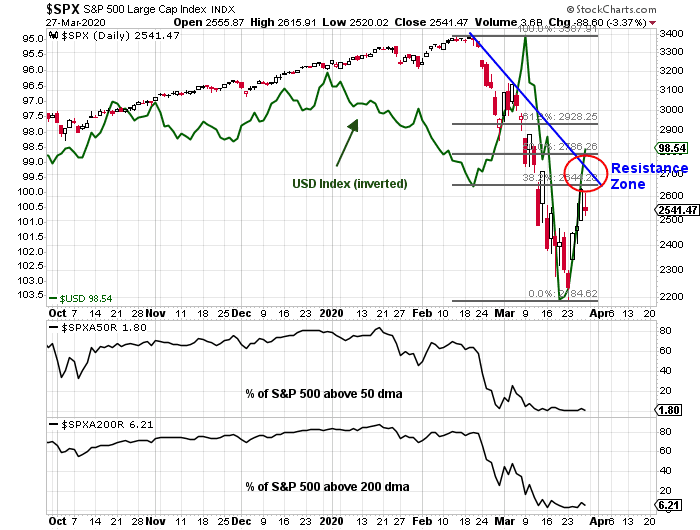
I would expect some choppiness early in the week, with a possible test of the resistance zone at the 2650-2700 zone next week. If the bulls are successful in breaking resistance, a test of the 50% retracement level at about 2800 should occur in short order. If the market were to weaken, a logical support level is the 50% retracement of the advance at about 2420.
Once the bear market rally subsides, my base case scenario calls for a retest of the lows in April. The bulls may not be able to hold the line, and the retest may not necessarily be successful. There are no guarantees.
My inner investor remains positioned in a maximum defensive posture. My inner trader is long the market, and waiting to see if the likely test of resistance at 2650-2700 is successful.
Disclosure: Long SPXL
My Tactical Factor research indicates this is a bear market rally, not the final low. Here is why.
I’ve done new research into Factors (Value. Growth, Small Company, Low Volatility) as they exhibit tactical behavior during the stock market cycle. In a recessionary bear market like the one we are in, the economically sensitive Factors fall further than the more resilient, as one would expect. The difference in performance widens as the economy weakens. Eventually at the bear market low, the Factors that have collapsed the most, turn up suddenly and outperform the more stable ones that went down much less. They keep on outperforming for a year.
The bottom in the current market did not see that action. All the Factors went up equally or in the case of many of the industries I monitor, the resilient Factor stocks went up more. That tells me that investors are buying this rally with safer stocks. That tells me the bear market low is in the future.
A simple way of monitoring this is comparing the Russell 2000 Small Cap ETF IWM to the Low Vol ETF SPLV. These two Factors differ the most in performance during times of economic stress/bear markets.
Thanks Ken.
Thanks Ken!
Ken
Would you be kind enough and post a link to IWM/SPLV graph that updates daily? I have used your graphs in the past and have found them to be very useful. Thanks so much.
Here you go D.V.
First a chart of the current ratio
https://tmsnrt.rs/2JpK0ok
Here is a sample of other bear market lows where you can see Small Cap outperforming Lo Vol after a low, not just for a few days but a long time.
https://tmsnrt.rs/2WSsXTF
Thanks, Ken.
I was a fool in 2008 to wait for PE ratio of S&P 500 to go into single digits. The US Fed laid my plans threadbare by intervening and arresting the S&P 500 from sliding from 666 to 300 circa March 2008.
I learnt the lesson that it does not pay to fight the Fed.
Second lesson I learnt was that the job of the Fed is to arrest deflation (or losses in the stock market, bond market and also in the real estate market and prop up zombie assets and asset holders like banks).
So, now the question is:
https://www.cnbc.com/2020/03/29/what-it-would-take-for-the-fed-to-start-buying-stocks-during-coronavirus-crisis.html
I had asked when the Fed would buy bonds and if so, of what duration in the last two weeks. We got the answer soon thereafter.
The question is if Fed starts buying stocks, would stocks sell off further (this is what happens when the Fed starts buying bonds).
Thanks for posting this article. Buying ETFs would be unprecedented.
Will it be fair if they only buy ETFs tracking S&P500 or some other large index? Shouldn’t they buy the whole market (Vanguard’s VTI)?
I think they or their proxies prefer to use the S&P 500 futures. I guess you could watch the spreads but by the time you figured it out you would already see the market screaming higher.
True. I normally invest in individual small- and micro-cap businesses. I guess I need to put some money in SPYs this time.
Thanks!
They are using BlackRock for bond ETFs so I think they would use them for equities too.
Interesting. The Fed is likely to use derivatives (options and futures) to buy into the equity markets, if it does so. Just a thought.
Japanese central bank has been buying equities for a while, now.
I believe that the Fed need a change in legislation in order to buy ETFs.
What can the and cannot the Fed buy?
Federally insured paper USTs and MBS, and munis with maturity of under 6 months.
Thanks. That leaves an ocean of assets that are outside this narrowly defined bracket, doesn’t it?
U.S. law currently limits Fed purchases to “any obligation which is a direct obligation of, or fully guaranteed as to principal and interest by, any agency of the United States.” That translates to buying U.S. government and agency debt and mortgages issued by federal housing agencies.
https://www.bloomberg.com/news/articles/2020-03-06/rosengren-says-fed-should-be-able-to-buy-a-wider-range-of-assets
Unable to read this article. Can you cut and paste?
That said, many (hard) assets like gold, and other precious metals, art work, farm land, collectibles, etc. remain outside the purview of the Fed. Are there other assets that are outside of this list?
The list I have mentioned here is the the “short” side of what is defined by the USA.
Are there assets that are yielding say 10% without debt, that are outside the purview of the Fed?
Because the assets listed by Cam are within the implied guarantee of the Fed, everything else is extremely undervalued, or at best fairly valued.
Here is the whole article, D.V.
Federal Reserve Bank of Boston President Eric Rosengren said policy makers should be allowed to buy a broader range of assets if they lack sufficient ammunition to fight off a recession with interest-rate cuts and bond purchases.
With 10-year U.S. Treasury yields notes already at record lows, Rosengren said typical quantitative easing may not work as it did during the 2008 financial crisis. Therefore, the Fed may need the flexibility enjoyed by policy makers in Europe and Japan.
“We should allow the central bank to purchase a broader range of securities or assets,” Rosengren said in a speech Friday in New York. “Such a policy, however, would require a change in the Federal Reserve Act.”
U.S. law currently limits Fed purchases to “any obligation which is a direct obligation of, or fully guaranteed as to principal and interest by, any agency of the United States.” That translates to buying U.S. government and agency debt and mortgages issued by federal housing agencies.
The Fed has traditionally maintained a strong internal resistance to expanding its purchases beyond Treasury securities because such activities are essentially credit allocation and leave the central bank vulnerable to criticism of favoritism if it’s investing in the bonds or stocks of specific companies.
“New deal progressives are not going to tolerate this unless the unemployment rate has risen sharply,” said Mark Spindel, a co-author of a book about Congress and the Fed.
During the financial crisis, the Fed bought agency-backed mortgage securities to help revive markets for housing debt. As of March 4, the Fed held $1.37 trillion of mortgage securities.
Fed Cut
Rosengren’s remarks came as yields on 10-year Treasury notes plunged to as low as 0.66% on concern the spreading virus would dent the world’s largest economy.
The Fed lowered its benchmark policy rate by 50 basis points in an emergency move Tuesday to a 1% to 1.25% range, with investors betting it will cut by a further half percentage point by the end of this month. Rosengren’s not a voter this year on the rate-setting Federal Open Market Committee.
“If the economic reaction to the coronavirus does result in the funds rate falling to its effective lower bound, this heightened sensitivity of the 10-year U.S. Treasury rate to adverse news raises the possibility that the 10-year U.S. Treasury rate could follow close behind,” Rosengren said. “There would be little room for the Federal Reserve to lower rates through large purchases of long-term Treasury securities.”
The comments come as the Fed is in the middle of a review of its policy tools and strategy — a process that has been somewhat overwhelmed by the sudden and stunning loss of policy space as longer-term yields decline and traders forecast another half-point cut at the March 17-18 meeting.
Rosengren said that if the Fed was permitted to broaden the scope of assets it buys, the U.S. Treasury should indemnify it against losses, while noting that fiscal policy should also shoulder a greater burden with interest rates already low. He also resurrected the idea of establishing a facility that could buy broader assets provided that Treasury insured the central bank against risk.
During the financial crisis, the Fed invoked “unusual and exigent” circumstances to create funds that bought assets from failing financial institutions. The bailout move was controversial with lawmakers.
All of these ideas point sharply to the fact that central bankers realize they are running out of room at a time when very few ideas have come out of the Trump administration to cushion the economy from coronavirus disruptions.
“Somewhat surprisingly, there seems to be little movement toward making automatic stabilizers more prominent, or preparing to invest significantly more in the sorts of public investment projects that yield positive returns,” Rosengren said at conference hosted by the Shadow Open Market Committee.
Larry Kudlow, President Donald Trump’s top economic adviser, said Friday that he wants “timely and targeted micro-measures” without giving many details.
Thanks Wally for the article.
To those who follow credit markets, how do the markets look now?
The ETFs are trading at slight premium to the underlying asset value – based on the link shared by Ken earlier. Thanks, Ken.
https://product.datastream.com/dscharting/gateway.aspx?guid=814feac1-10f9-44bc-924b-b12ffcd89bb1&action=REFRESH
https://fred.stlouisfed.org/series/BAMLC0A4CBBB
https://fred.stlouisfed.org/series/BAMLH0A0HYM2
Thanks, DV.
Dr. Doom has outdone himself this time.
https://www.project-syndicate.org/commentary/coronavirus-greater-great-depression-by-nouriel-roubini-2020-03
“The contraction that is now underway looks to be neither V- nor U- nor L-shaped (a sharp downturn followed by stagnation). Rather, it looks like an I: a vertical line representing financial markets and the real economy plummeting.”
“As such, the risk of a new Great Depression, worse than the original – a Greater Depression – is rising by the day.”
If we believed things will get as bad as Roubini would like we not only will be in a Depression by the end of the year but we will be at war with Russia, China and Iran.
https://www.cnbc.com/2020/03/29/mortgage-bankers-warn-fed-purchases-of-mortgages-unbalanced-market-forcing-margin-calls.html
I quote:
“Some lenders, the letter said, may not be able to meet their margin calls in a day or two”.
Who are these lenders? Where can I find this information from?
“But the Fed’s actions, amid a volatile market environment, helped add further strains that resulted in blowing up a widespread hedge that mortgage bankers use to protect themselves against rate increases, and now some lenders are facing margin calls that are eroding their working capital and threaten their ability to operate”.
What kind of hedge is being talked about? Where does one find the prices of such a hedge and where is the market for such a hedge? Thanks.
We’ve been worried about debt bubble for so long now. If this crisis isn’t the one to pop it then will it ever pop? Of course this depends how long covid19 will last and the aftereffects. Also, why isn’t the US copying UK’s stimulus plan of paying 80% of wages. It’s better than giving money directly to consumers because it incentivizes companies to keep their employees. If the whole world prints money to pay 80% of wages then naively speaking there shouldn’t be much change to the exchange rate of all currency pairs.
An interesting conclusion. Buy gold and commodities if this comes to pass.
https://www.marketwatch.com/story/selling-fatigue-has-set-in-but-stocks-may-not-have-hit-the-bottom-just-yet-ubs-says-2020-03-30?mod=home-page
Cam is on record about “seller exhaustion” and also mutual funds rebalancing in the latter half of March. We are now at end of March and, and both factors noted by Cam see to be playing out.
We shall now await whether the ZBT signal was triggered by end of this month or not.
Could it be running out of steam soon seeing that it’s now March 30?
Bending the curve in the Bay and Seattle Areas:
https://twitter.com/jonsakoda/status/1244348467956158476
https://twitter.com/ByMikeBaker/status/1244415096203296769
Someone recently mentioned death cross on several indices. Here are two studies:
https://www.fool.com/investing/2020/03/25/dont-sweat-the-dow-recent-death-cross-red-flag.aspx
https://quantifiableedges.com/90-years-of-death-crosses/
Thanks for that.
A large California pension has postponed their scheduled quarterly rebalancing. As the CA pensions are the thought leaders in the pension community, we think it is likely that others will either follow along in postponing or reducing anticipated rebalancing
https://twitter.com/LJKawa/status/1244690192935596032