Preface: Explaining our market timing models
We maintain several market timing models, each with differing time horizons. The “Ultimate Market Timing Model” is a long-term market timing model based on the research outlined in our post, Building the ultimate market timing model. This model tends to generate only a handful of signals each decade.
The Trend Asset Allocation Model is an asset allocation model which applies trend following principles based on the inputs of global stock and commodity price. This model has a shorter time horizon and tends to turn over about 4-6 times a year. In essence, it seeks to answer the question, “Is the trend in the global economy expansion (bullish) or contraction (bearish)?”
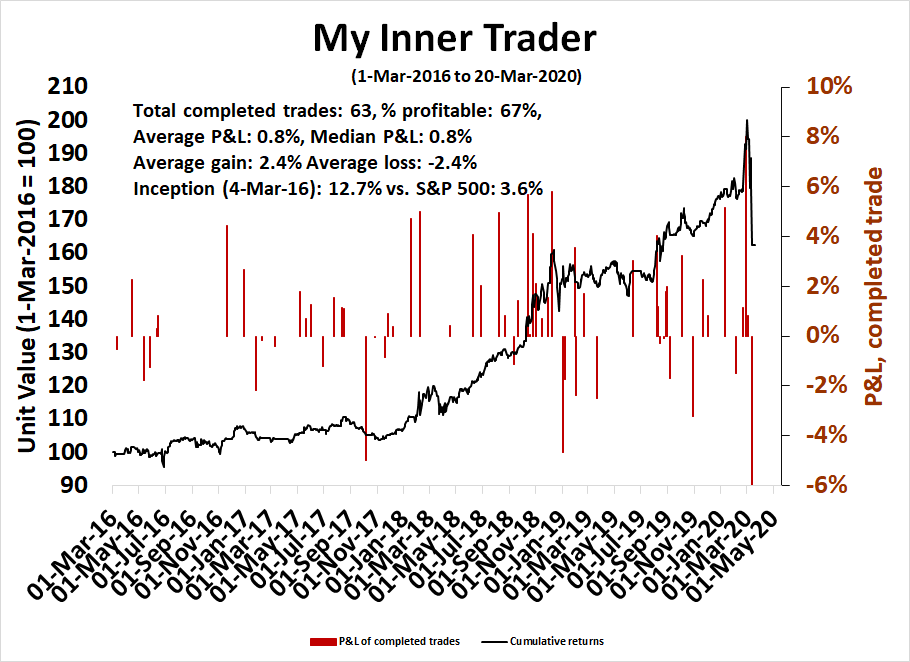
My inner trader uses a trading model, which is a blend of price momentum (is the Trend Model becoming more bullish, or bearish?) and overbought/oversold extremes (don’t buy if the trend is overbought, and vice versa). Subscribers receive real-time alerts of model changes, and a hypothetical trading record of the those email alerts are updated weekly here. The hypothetical trading record of the trading model of the real-time alerts that began in March 2016 is shown below.
The latest signals of each model are as follows:
- Ultimate market timing model: Sell equities
- Trend Model signal: Bearish
- Trading model: Neutral
Update schedule: I generally update model readings on my site on weekends and tweet mid-week observations at @humblestudent. Subscribers receive real-time alerts of trading model changes, and a hypothetical trading record of the those email alerts is shown here.
Where’s the rally?
For several weeks, I have been saying that a bear market rally could happen at any time, but the market keeps weakening. One of the challenges for the bulls is to put together two positive days, which they have failed to do. Another is to stage an upside breakout through the declining trend line.
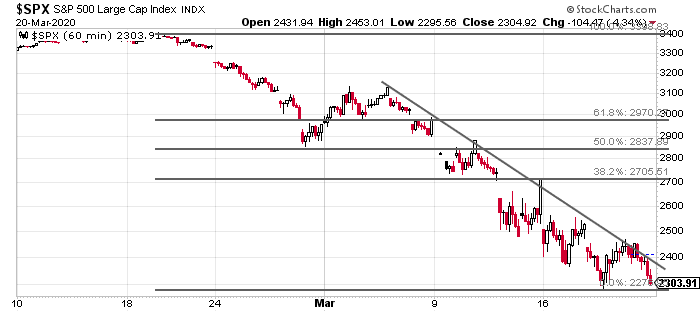
The market closed Friday in the red. One constructive sign that can be found in the above hourly chart is the index closed while testing a support level. Should it stage an upside rally from here, the logical first resistance level is the first Fibonacci retracement at about 2700, with additional resistance at the 50% retracement objective of about 2840.
This is insane! Where’s the bear market rally?
The bad news
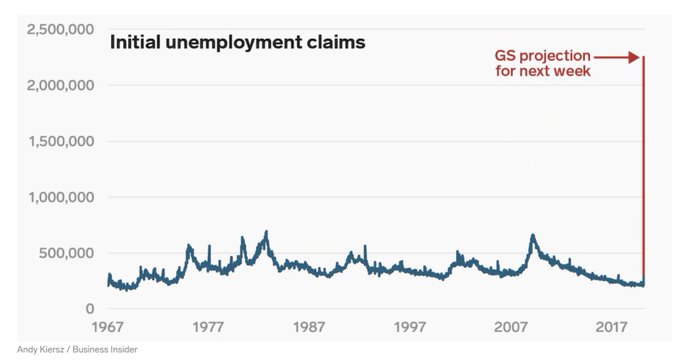
Let’s start with the bad news. There have been reports trickling out from the state level of a tsunami of unemployment claims due to the loss of service jobs from social distancing edicts. Consequently, the Street is now bracing for a moonshot-like surge of initial jobless claims next Thursday.
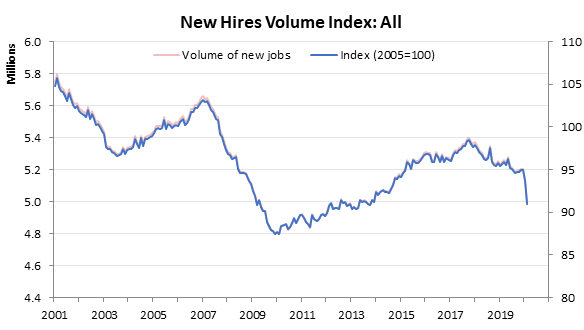
The reverse side of the unemployment coin is new hires. The Upjohn Institute reported that February new hires hit a brick wall:
Employers cut back even sooner than we thought: New hires fell over 200,000 in February, and that’s a 12-month moving average. In the raw numbers, we went from 5.59 million in February 2019 to 3.85 million in February 2020.
FactSet reported that the market is trading at a forward P/E of 13.9. which is below its 5-year average of 16.7, and 10-year average of 15.0. That sounds cheap, right? But there’s a catch.
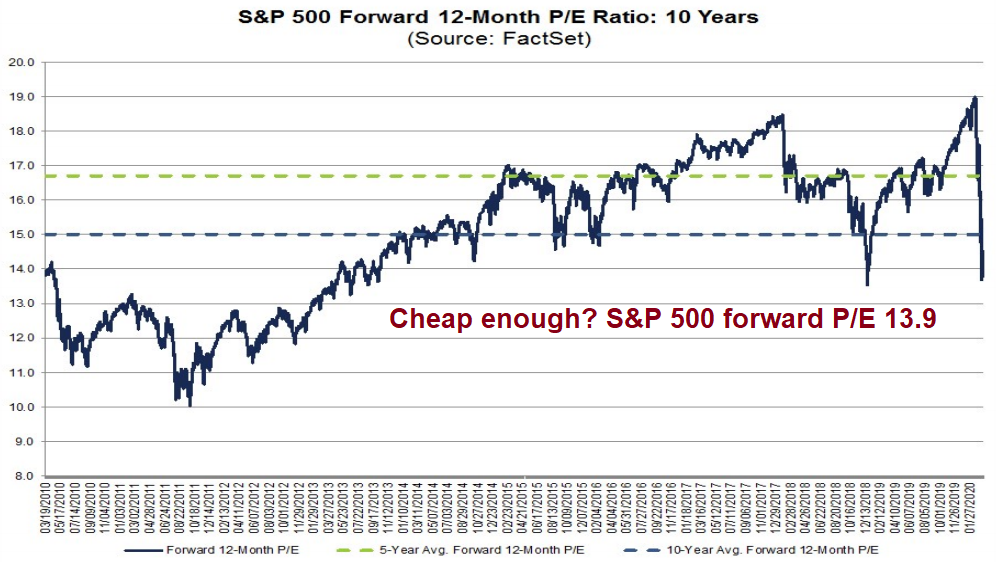
The E in the forward P/E ratio is only beginning to fall.
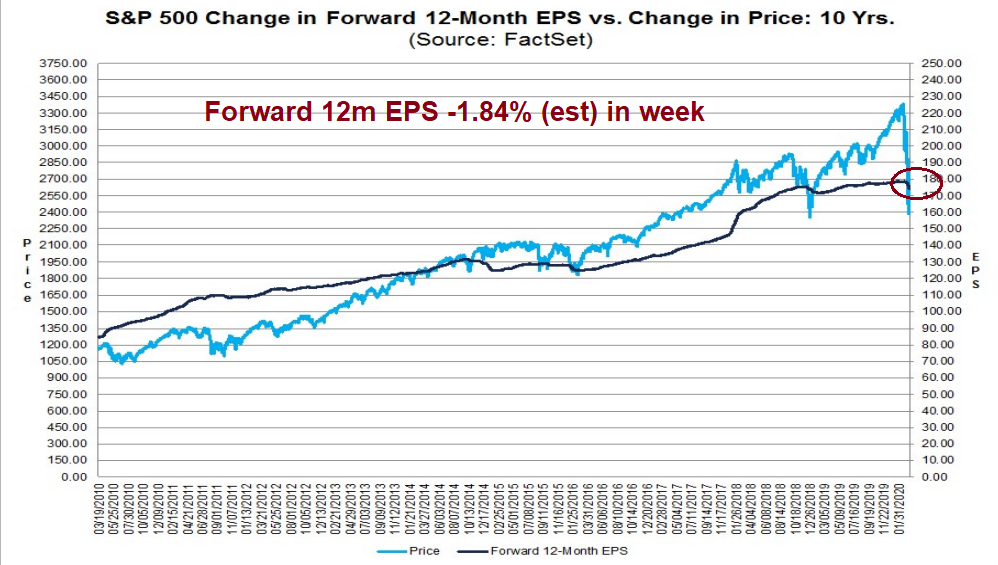
FactSet reported that companies are only just beginning to quantify the effects of COVID-19. Only 213 of 479 S&P 500 companies cited “coronavirus” or “COVID-19” in their quarterly earnings calls.
While many of these 213 companies discussed the current negative impact or the potential future negative impact of the coronavirus on their businesses, 76 companies (36%) stated during their quarterly earnings call that it was too early (or difficult) to quantify the financial impact or were not including any impact from the coronavirus in their guidance for the current quarter or current year. On the other hand, 58 companies (27%) included some impact from the coronavirus in their guidance or modified guidance in some capacity due to the virus.
In other words, only 58 companies in the index were able to give any guidance on the negative effects of the pandemic during their earnings calls. To be sure, some of these earnings calls occurred in January and February, before the full effects of the pandemic reached American shores. Have they given any additional guidance since then? The answer is not really.
Of the combined 134 companies that either stated it was too early to quantify an impact from coronavirus (76) or did include an impact from coronavirus in their guidance (58) during their quarterly earnings calls, only 13 companies have issued quarterly or annual guidance since their call with a revised impact from the virus. On the other hand, 11 companies have withdrawn, suspended, or not confirmed previous quarterly or annual guidance since their quarterly earnings call.
In other words, expect further wholesale earnings downgrades in the near future.
That’s the bad news.
Bearish exhaustion?
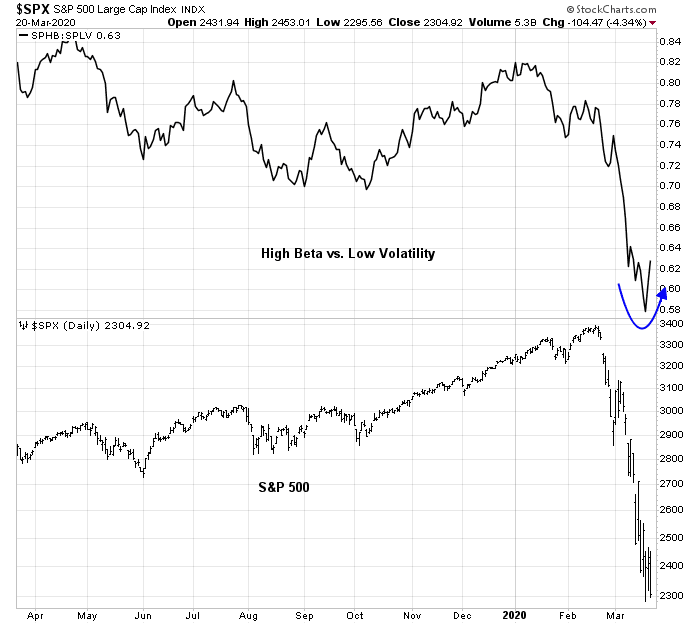
Here is the good news. The technical internals of the market are improving. As an example, the relative strength of the high beta factor compared to the low volatility factor is bottoming and turning up, indicating improving equity risk appetite.
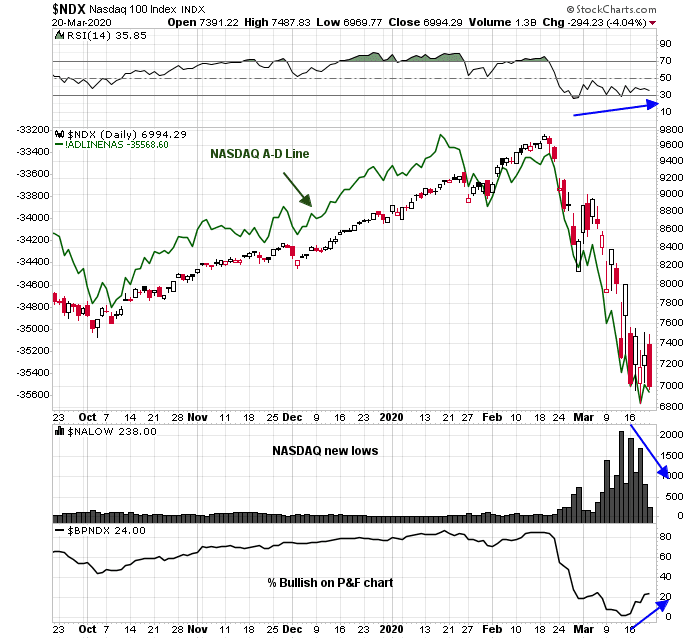
Other market internals are also improving The Advance-Decline Line is starting to bottom out and it is exhibiting a positive divergence. NYSE new lows are contracting, % bullish is improving, and 14-day RSI is showing a positive divergence. All of these signs point to bearish exhaustion.

The NASDAQ 100 chart tells a similar story. While the NASDAQ A-D Line is not exhibiting a positive divergence, the other three indicators are showing bullish divergences.
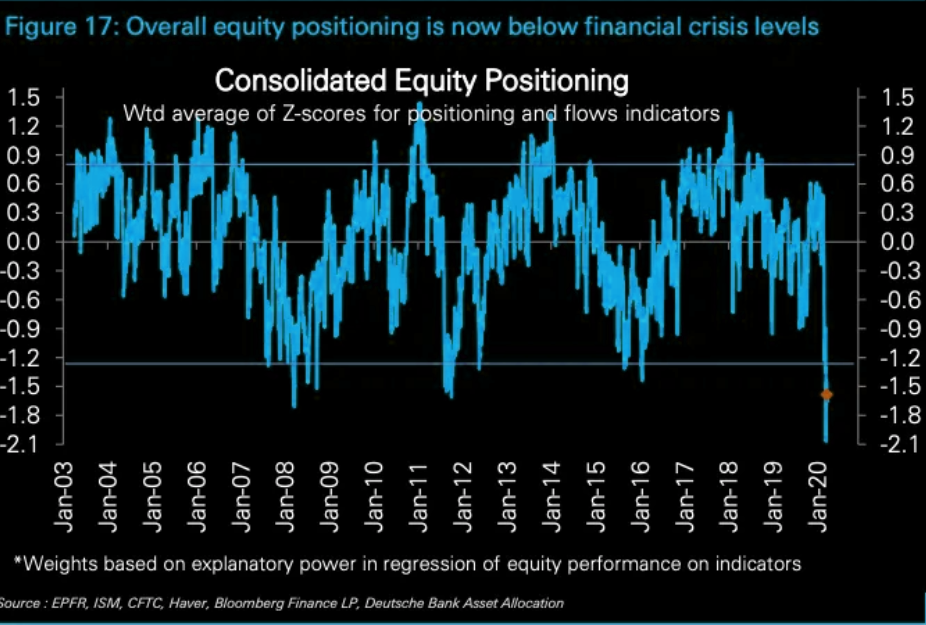
Deutsche Bank’s analysis of hedge fund equity positioning reveals an extreme crowded short position, which is consistent with our thesis of bearish exhaustion. Should any bullish catalyst appear to spark a rally, expect a short covering stampede to rapidly rocket stock prices upward.
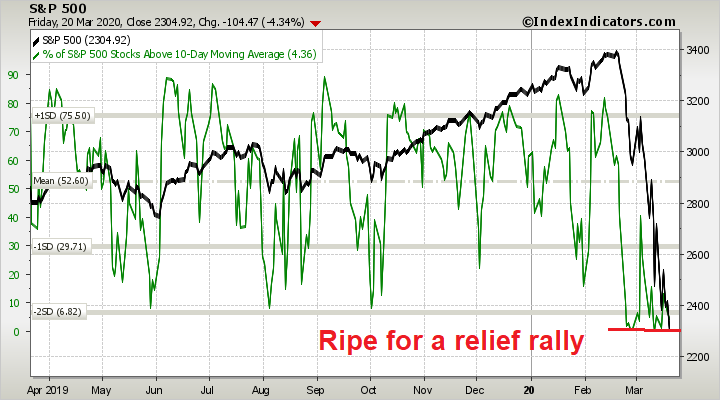
Short run breadth is currently oversold, and the market is ripe for a rally on Monday. Even if the market does rise, let’s just see if the bulls can muster market strength for more than one day.
My inner investor is positioned for maximum defensiveness. My inner trader is on the sidelines. He is waiting for signs of a relief rally before jumping in on the long side.
I quote Cam:
“FactSet reported that the market is trading at a forward P/E of 13.9. which is below its 5-year average of 16.7, and 10-year average of 15.0. That sounds cheap, right? But there’s a catch”.
The above implies a 165 $ ES for 2020 (10% haircut from 177 $ EPS; this is from Cam’s previous post). Let us cut another 10% from EPS to 150$ per share. This may be 1-2 quarter phenomenon, but the rolling average of 4 quarter may be close to 165$ when all is said and done, in effect making the PE ratio somewhat inaccurate tool. At 150 $ EPS, at 1800 S&P 500, we would be at a PE of 12, and yes we could get there quickly.
The real question is when do cases in NYC plateau out? If curfew in NYC started last week, and the incubation period it 5 days, we should see flattening of the curve by end of this week.
“The median incubation period was estimated to be 5.1 days (95% CI, 4.5 to 5.8 days), and 97.5% of those who develop symptoms will do so within 11.5 days (CI, 8.2 to 15.6 days) of infection”.
https://annals.org/aim/fullarticle/2762808/incubation-period-coronavirus-disease-2019-covid-19-from-publicly-reported.
This is theory. Let us see if it works out that way or not.
FWIW, VIX is starting to drop.
Increasing testing will show more people affected (that we did not know about). 80% of these will get a mild disease. Many of these 80% have already had the disease and are now recovered, unbeknownst to them.
So, why did this virus rear its ugly head? We can speculate, certain unique environmental conditions (or mutations), may have give such an agent ideal conditions to spread. How long can such ideal conditions last? Most likely such conditions are statistically unlikely to last for a very long time (see history of MERS, SARS, H11N1 flu). These agents came and went away and never came back.
Bottom line, we may see a very rapid flattening of the curve. If this were to happen, smart money is likely to be buying well ahead of the “news”.
On the other hand, US government is trying to put together an aid package, at time of most need. Furloughed workers are the ones that are the intended beneficiaries. This will have its desired effect, with IRS postponing the deadline to file taxes, Fed has cut Fed funds rates, is supporting the Muni market, has started a QE.
To be sure, health officials are likely to err on the side of caution and quarantine may last longer than estimated. That said, Wall Street is the one to watch, here.
Let us watch the technicals. Thanks Cam for the technicals.
EPS estimates are a little bit more complicated than that, but you have the right idea. I am calculating a forward 12m EPS. Since we are in late March, you take roughly 3/4 of 2020 and 1/4 of 2021.
According to FactSet, consensus 2020 EPS is 169.73 and consensus 2021 is 190.59. I make several observations:
1) 2020 estimates are likely to fall dramatically, I have seen top-down (FactSet is bottom-up) of 140-150
2) 2021 is the big question. The consensus calls for a V-shaped recovery, so the 190 estimate may not come down that much.
3) Fast forward 3 months from today, which will be the depth of this bear. The big question is how much does 2021 come down, because a forward 12m EPS is 1/2 2020 and 1/2 2021.
That’s why I only took 10% off the forward 12 estimate. It is 173.87 today. Forward 12m in three months time at 160 is entirely plausible because of an expectation of 2021 rebound. While the rebound may not may not happen, that will still be the consensus data point that we will use.
Thanks Cam for discussing the idea of time averaged mean EPS, over several quarters/year(s). That said, technicals, that you are focussed on are likely to give a better insight into bottom and double bottom.
I would like to believe that we may see a bottom somewhere close to where we are, have a counter trend rally and then perhaps a double bottom. Hard to say, whether these events unfold in one of four quarters from today.
If what I have speculated is true that the virus is a creation of some very unique environmental factors, such factors may nor persist, and a recovery may be much faster than anyone expects.
I think it is almost silly to estimate 2020 EPS with so many unknowns and slapping a P/E multiple on that. Using that method in steady environment may yield some value but still with a wide range of outcomes. The 2020 EPS will be abnormal. It is like using the earnings of a commercial property on Fifth Ave that has been vacant for 6 months to determine the asset value of the property.
The value of an asset is the sum of present value of discounted future cash flows. If the cash flow for a year is impaired, the total sum should not go down as much.
Using fundamentals, technicals, historical comparisons and quantitative models seem quite useless in the current environment. As several knowledgeable investors remarked on the previous post, we are in a credit and liquidity crisis. How that unfolds will determine the bottom.
If many small businesses stay closed for more than a couple weeks I suspect many of them will not have the cash to re-open, especially if their margins were slim. Will this just mean larger businesses will get more business or does it mean the recovery will be slow and jagged?
Another thought I have is that even if the virus is mostly squashed it might take months or longer to totally get back to normal. In fact, many things may have changed permanently. Could this mean the stock market may NOT have a near term recovery? Might the market trade in a narrow range near the bottom for months or longer? It’s worth considering since this is not your normal recession/recovery episode..
And, the military has prepared itself to step in should the White House, Congress and SCOTUS start becoming incapacitated from disease. Plans code named Octagon, Freejack, and Zodiac were created after 9/11 and would call upon various military units in Washington DC, North Carolina and eastern Maryland to defend government operations and take over executive functions if there is a total breakdown. Another plan – code named Granite Shadow – lays out the playbook for extraordinary domestic missions that involve weapons of mass destruction.
Most of these plans have already been quietly activated during presidential inaugurals and State of the Union addresses in the event of a mass casualty attack on the government,
So far, two Congressmen and Senator Ron Paul have announced that they have tested positive for the Wuhan Virus.
The thesis of the lockdown will reduce the numbers by the end of the week seems a bit unlikely:
https://www.worldometers.info/coronavirus/#countries
and
https://gisanddata.maps.arcgis.com/apps/opsdashboard/index.html#/bda7594740fd40299423467b48e9ecf6
where the trends are currently asymptotic.
Consider Italy which has had serious lockdowns in place for several weeks:
https://www.bbc.com/news/world-europe-51810673
with no letup in cases apparent as yet
I would imagine until greater indication of the virus coming under control occurs, the markets will only do dead cat bounces rather than relief rallies. I can easily be wrong. Time will tell.
Glad to see Bloomberg doing its bit to earn clicks by throwing gasoline on a burning house.
https://seekingalpha.com/news/3554047-u-s-unemployment-may-surge-to-30-feds-bullard-says
Futures limit down (again), going to be another crazy week…
https://www.yahoo.com/news/why-nobel-laureate-predicts-quicker-210318391.html
https://www.yahoo.com/news/italy-sees-signs-hope-651-virus-deaths-201654253.html
Thanks for posting this.
Based on the Michael Levitt article, Italian deaths were complicated by the concomitant flu season and a culture of anti flu vaccination (In the US, annual flu vaccination is common; seems like in Italy it is the opposite, based on the article).
“Bear markets never end on good news.” – Larry Williams (Technical Analyst)
Means bear markets go down on bad news, bottom on bad news, and then that the new bull market starts up on bad news as it climbs the proverbial Wall Of Worry.
There is plenty of worry for it to climb.
As Economic Toll Mounts, Nation Ponders The Trade-offs
The cost of confronting the pandemic is millions of jobs and trillions in wealth lost to save potentially millions of lives
“WE CANNOT LET THE CURE BE WORSE THAN THE PROBLEM ITSELF,” President Trump said in a tweet Monday morning. He went on to suggest he might dial back a federal push for the nation to practice social distancing for 15 days. “AT THE END OF THE 15 DAY PERIOD, WE WILL MAKE A DECISION AS TO WHICH WAY WE WANT TO GO!”
https://www.wsj.com/articles/as-economic-toll-mounts-nation-ponders-the-trade-offs-11584970165?mod=hp_lead_pos1
The Virus is holding the gun and demanding your job or your life.
It is more like the Virus is holding the gun and demanding your job or someone else’s life.