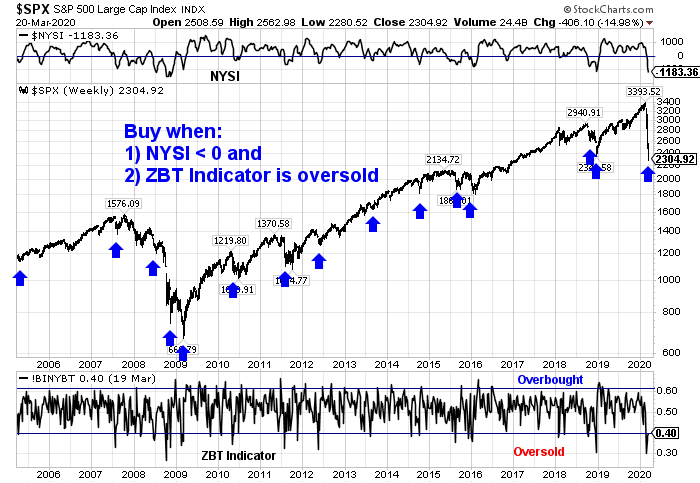
There is little question that the stock market is wildly oversold. My intermediate term bottom spotting model has been flashing a buy signal for over a week. This signal is based on the combination of an oversold signal on the Zweig Breadth Thrust Indicators, and the NYSE McClellan Summation Index (NYSI) turning negative. In the past, this model has shown an uncanny ability to spot an intermediate bottom, but stock prices have continued to fall despite the buy signal.
Where’s the bottom?
Insiders are buying
There are a number of constructive signs that equities are starting to look interesting from a fundamental perspective. The most important of which is the appearance of an insider buying cluster (via Open Insider).
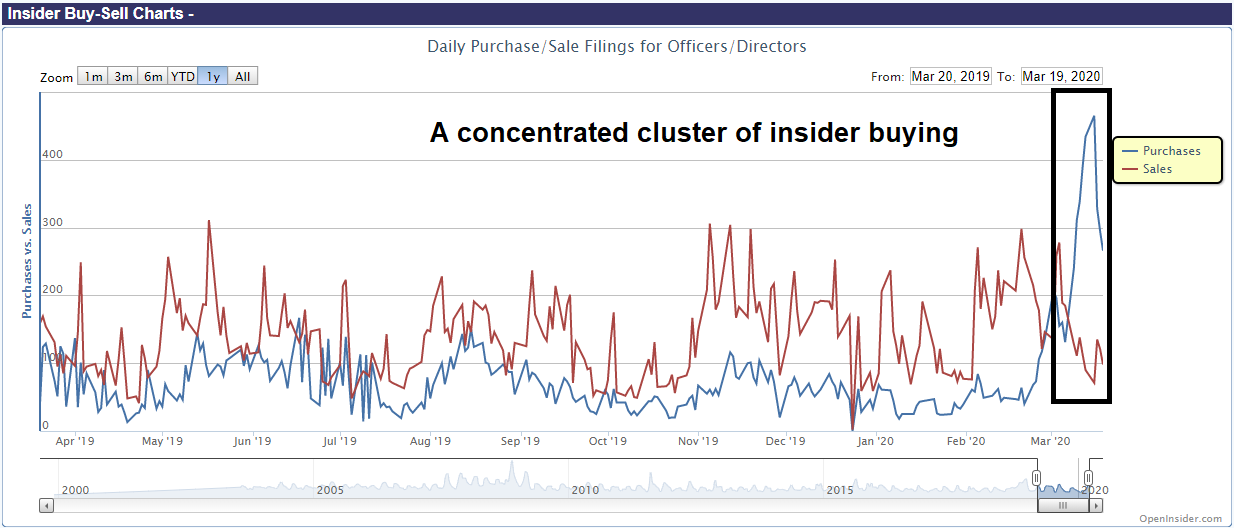
I would warn, however, that insider buying is an inexact fundamental signal. A study of past insider buying signals since the data set began in 2004 tells the story. Consider, as an example, how this group of “smart investors” behaved in 2008. They began buying heavily as the market skidded in October 2008, but the ultimate low did not occur until March 2009, when prices were 30-35% lower than when they began buying.

Insiders were more timely buyers in 2011, when the market convulsed over the prospect of the combination of a budget impasse in Washington, and the prospect of the breakup of the eurozone over the Greek Crisis. The 2011 episode was marked by a buy signal that coincided with a period of low downside risk.

Insiders were early to buy into the initial decline in 2018. To be sure, they bought heavily in a second cluster as the market reached the Christmas Eve bottom.

This brief study shows concentrated insider buying can be a useful signal for long-term oriented investors to start edging into stocks. However, this group of “smart investors” seem to focus mainly on valuation, and they behave like the classic value investor, who tends to be early in their investment decisions.
Cheap enough?
The S&P 500 peaked in January at an astounding forward P/E ratio of 19.0, but index has deflated considerably since then. Are stock prices cheap enough to be buying?
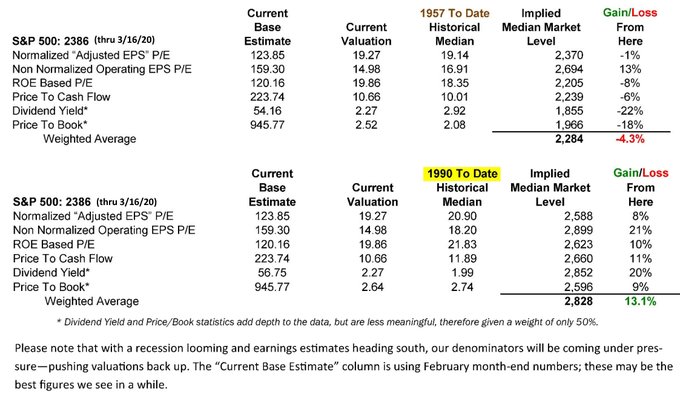
It depends on how you define cheap. The Leuthold Group analyzed valuations o n several metrics using two lookback periods. They considered historical valuation from 1990 to present, and 1957 to present. They found that the market is undervalued based on the 1990-2020 time frame, but overvalued on the 1957-2020 time frame. I interpret this analysis as the market nearing fair value, with the caveat that markets tend to overshoot to the downside in a bear market.
How far can it overshoot? Josh Brown highlighted analysis by BAML’s Savita Subramanian:
PEs are pretty useless: wide range At prior bear market troughs, trailing Price to Earnings (PE) multiples have ranged from 11x to 18x (today’s is 15x) and forward (NTM consensus) PE multiples have ranged from 10x to 15x (today’s is 16x). But historically, the market has troughed at an average PE multiple of 13x to 14x actual trough earnings, a posteriori. Applying this to our recently introduced 2020 recession EPS forecast of $138 yields a floor (worst case scenario) on the S&P 500 of 1800. But note that this is a much lower outcome than applying the typical peak-to-trough bear market decline of ~35% to February’s S&P 500 peak of 3393, which would yield a floor of 2200 (still below today’s levels). Our year-end 2020 target for the S&P 500 remains 3100.
Brown concluded that the estimated range of 1800-2200 is extremely wide.
Savita notes that if we go by the typical bear market decline of 35% peak to trough, then 2200 makes sense. If we go by Merrill’s new S&P 500 recession earnings forecast, and apply a PE at the midpoint of the above mentioned range, we’re talking more like 1800.
Regular readers will recall that I have a ballpark estimate of 1600-2160. This range was based on reducing peak forward 12-month EPS estimates by -10% (which is consistent with the 1982 and 1990 recessionary experience), and applying a 10 P/E multiple (2011 bottom) and 13.5 multiple (2018 bottom) to forward EPS.
My range of 1600-2160 is even wider than BAML’s 1800-2200. Since no one knows the level, depth, or length of disruption COVID-19 will impose on the economy, investors will have to live with the wide range until we can see a greater level of certainty.
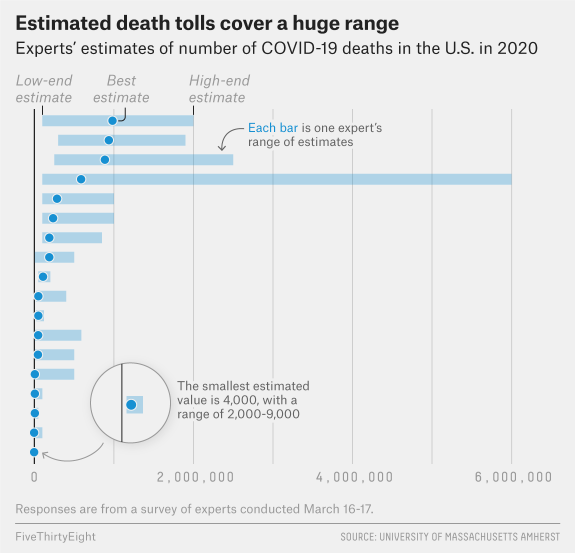
To illustrate my point, FiveThirtyEight surveyed a number of infectious disease experts about the likely effects of the COVID-19 epidemic in America.
Collecting responses in this form captures both the best-guess estimate from each respondent and the uncertainty surrounding it. It also lets the people in charge of the survey — Thomas McAndrew and Nicholas Reich, both biostatisticians at the University of Massachusetts, Amherst — convert the responses to a probabilistic consensus forecast,1 something that can answer questions like, “According to these researchers, what is the probability that we will have 50,000 reported cases by March 29?”
Expert consensus forecasts give you what a model does — a forecast that gives a measure of its uncertainty — without being overly reliant on just one way of thinking about a problem. In this instance, each expert has their own assumptions about how likely the virus is to spread or to be fatal, as well as assumptions about the ways humans might try to mitigate its damage
The estimates vary wildly, and so are the ranges of each expert’s estimates. In other words, everyone is only guessing.
If the healthcare experts don’t know anything, how can the rest of us possibly hope to estimate the economic effects?
Technical analysis: More downside?
From a technical analysis perspective, I see more downside for stock prices before a long-term bottom can be seen. The market’s weekly Percent Price Oscillator (PPO) reached -3 last week. This extreme level was seen at the 2011 Greek Crisis bottom, and the 2018 Christmas Eve panic bottom, but PPO never even reach this level during the Russia Crisis. That said, sub -3 PPO readings were seen during the post-NASDAQ Bubble bear market, and the 2008 market crash.
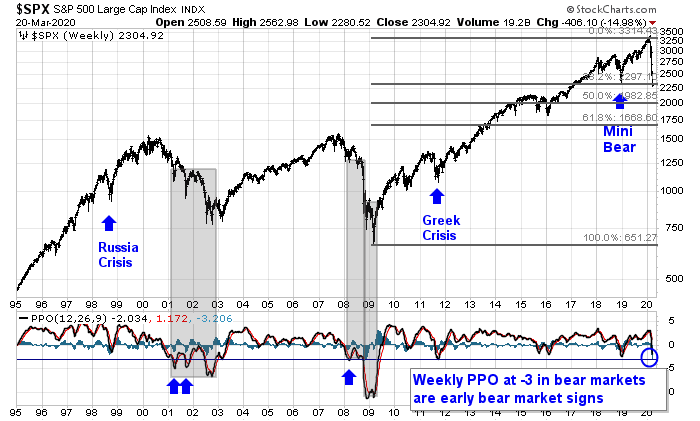
The moral of this story is that sub -3 PPOs mark panic bottoms during corrections in bull markets, but may only mark the start of a decline in bear markets. As we are in the middle of a recession induced bear market, there may be further downside in the future. As well, the above chart shows that the index is now testing the first Fibonacci retracement support level. Additional support can be found at the 50% retracement level of 2000, and 61.8% retracement of about 1670.
That said, short-term indicators are off-the-charts oversold, and a relief bear market rally can occur at any time. I recently reviewed a series of past bear market bottoms, starting from the Crash of 1929, and found that the stock market generally either came back down to retest the initial bottom, or formed a complex W-shaped bottom. The retest may not always be successful (see 2020 bounce = 1987, or 1929?).
In summary, it is difficult to know when and where this bear market will bottom. My review of fundamental and technical factors comes to two conclusions. While the market can bounce and stage a bear market rally at any time, the historical record indicates it will return to retest the previous low, and the retest may not be successful. Until we can estimate the full extent of the damage caused by the pandemic, it is also difficult to estimate a level the market is likely to bottom. Estimates based on top-down fundamental estimates and technical analysis range from a 1600 to 2160.
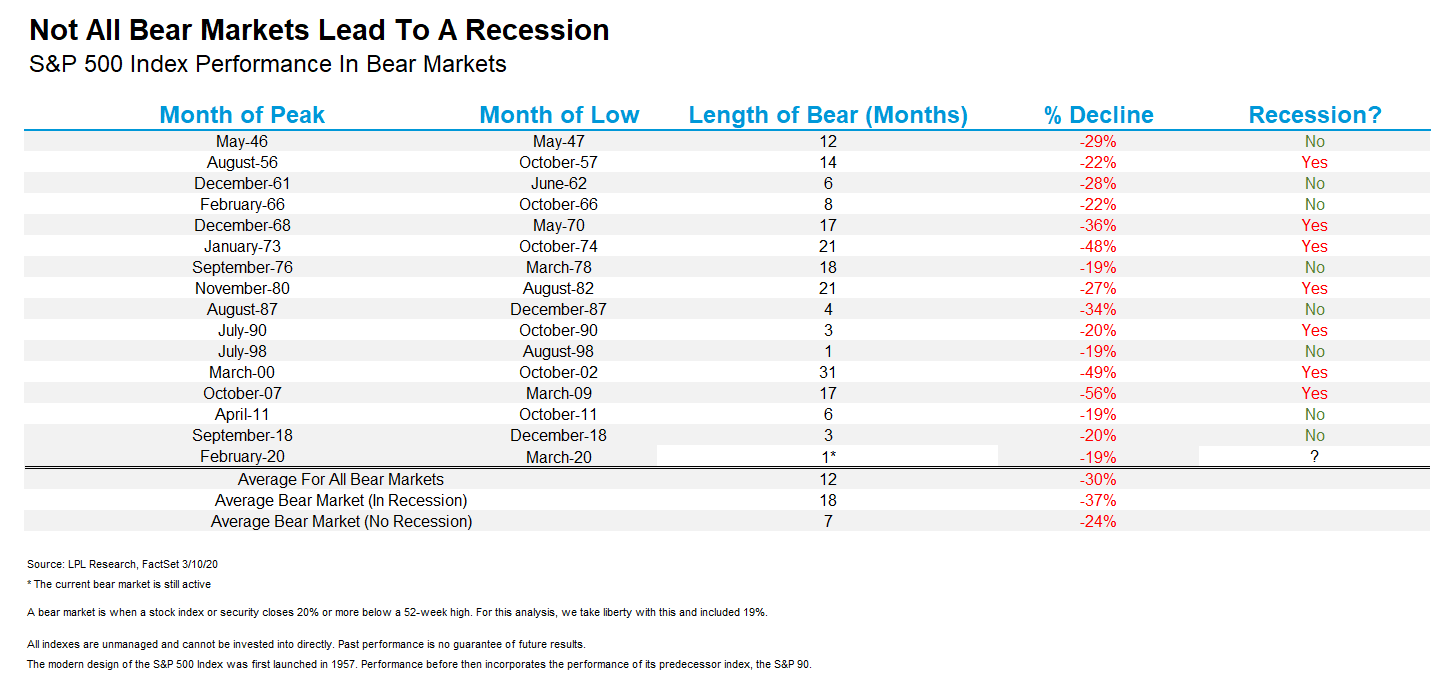
Be prepared for further downside risk, and for longer than the consensus expectation of a V-shaped recovery. As Ryan Detrick of LPL Financial has shown, recessionary bear markets last for an average of 18 months, compared to 7 months for non-recessionary bears.
Financially we are oversold, no doubt about it, but this is an economic problem caused by an invasion of a pathogen. Though the death rate is small, it has paralyzed normal everyday functions. There have been many small oversold bounces already, they lasted about a day. A meaningful rally may occur if a few thing happen first. In no particular order: a change in the infection growth rate, an effective prophylactic, or a vaccine is in test stage. Until then this appears to be dam break and the reservoir of unknown size is not empty.
Agreed. Are things getting better or stabilizing, or worse? Surely most people would go for the latter.
Investors are thinking the virus problem and its economic effect is the reason for the stock market decline and expect when the virus is controlled the stock market will recover. They think the decline is way too much for the temporary damage from the virus. They would normally be right. But the problem is something else.
But we are not in normal in the corporate world, we are in a crazy corporate debt bubble world. All major Central Banks plus international agencies like IMF and World Bank have warned of the ramping up of corporate debt plus the last few years it getting junkier. Last May, a research paper from the Fed said that the mounting corporate debt would be a problem if there was a recession. Well here we are with a sudden, Black Swan virus recession.
Note also that after markets went down in the last quarter of 2018, the Fed panicked and dropped rates rather than the planned increases. They were obviously worried about the corporate debt bubble.
The corporate debt market is now broken. Here is a chart of BBB yield spreads over treasuries. BBB is the lowest rung on the investable quality level for institutions.
https://fred.stlouisfed.org/series/BAMLC0A4CBBB
You can expand the time line and see previous recessions and the 2018 situation. It’s obvious something bad has happened. Very bad.
Here is something that literally shocked me this week. Normally arbitrage traders keep ETFs very close to there net asset value NAV. With bond ETFs the normal premium or discount is 0.25% or less. Here is a chart I made of the last few weeks for Long Term US Treasury ETF TLT, High Grade Corps ETF LQD and the general US Bond Index AGG. It shows the closing premium or discount versus the closing ETF price.
https://product.datastream.com/dscharting/gateway.aspx?guid=814feac1-10f9-44bc-924b-b12ffcd89bb1&action=REFRESH
Over the last few weeks the discount was as high as 5% and usually several percent. That says the bond trading desks are illiquid and broken. If Treasuries are illiquid, that is another many levels of bad higher.
This disruption is having many negative effects. Right now, no corporate new issues of bonds can be done. Companies that have bonds maturing can refinance. Even if they could issue new bonds, the yield would be very much higher. Also, all corporate bond prices are falling especially junk. This makes bond ETFs and mutual fund prices fall which is causing a run on selling them by nervous investors. This causes lower prices and we could see it become a flood.
In my mind, the corporate bond bubble was like a house of cards and the virus shook it. It may come tumbling down. Hopefully, the Fed can quell the situation and markets will recover after the flu recedes. It’s hard to put Humpty back together again. The yield spreads and the bond trading desks must return to or at least head back towards normal before we can have a firm bear market low. If they don’t, expect the “D” word to enter the news media as markets stay in turmoil.
There can be rallies along the way but a real low will happen when corporate bond markets heal. I will be hugely bullish when that happens. I am not a perma-bear. I am tactical.
BTW, keep the links. They update nightly.
Sorry, I meant “Companies that have bonds maturing can’t refinance.” not “can”. Big difference.
This leads to a much greater default risk along with profits declining (or losses) for indebted companies due to flu disruptions.
Thanks for the clarification; there is a huge difference between can and can’t; I was wondering the same when I first read your message.
Ken, your datastream link has been very useful, thanks for that. I use it together with a few other guides to see how liquidity is evolving in the markets. The situation is in my opinion pretty dire: not only have we seen some European bond hedge funds get into trouble (H2O the most notable one), we have also seen big arbitrage funds (Citadel, Renaissance) incur heavy losses. Looking at the scramble for dollars on a global level this is far from over in my opinion and much more systemic than main stream financial press seem to write on.
This is one of the ramifications of Dodd-Frank. There has been a continuous warning about the depth of the market. The roll of dealers has shrunk a lot. Now you see the liquidity problem. Fed has come to rescue last week.
So, the Fed has taken pace of the “dealers”. Government should have never intervened at the first place during GFC, by some metrics, and we are now seeing the aftermath of such largesse.
There was private capital during GFC that was waiting to buy assets. Such private capital would have come with better financial managers and fired the managers who were responsible for GFC. . All of that was laid to nought by our Government.
Normally there is a close inverse relationship between the index and the VIX. There is now a big divergence. Case of smart money not hedging while the dumb money is still panicking? Does anyone have a perspective on this?
Hedging level is still high but decreasing quickly. Check Accum/Dist of TLT, UVXY, TVIX. But surprisingly HYG is being accumulated until last week. This is a highly manipulated market environment. So indicators are for reference only.
Let’s observe the roll yield of Spot-F1 of the vix term structure. If and when it goes positive, then it is a first sign of short-term bottoming. But we would like to have a flattening of 10dma of spx as a precursor for a rally.
This bear market is different as it is caused by the economic effects caused by the reaction to a virus of which no expert agrees how dangerous it will be. The reaction is mainly caused by government shut downs and to a lesser degree by individuals voluntary adaption. Governments and central banks have announced enormous stimulus programs largely to mitigate their own shut downs. This will probably avoid a financial crisis, but will do little to avoid a recession or even a depression if the shut downs continue fo a long time. The end to this is very difficult to forecast as we will have to forecast government actions. How will they resolve the choice between mass unemployment and an overwhelmed health care system. Death or depression as one dramatic headline in a Swedish newspaper framed it today. A possible way out for governments beside efficient treatment or vaccine, could be a realisation that the fatality rate is much lower than believed. A large testing of antibodies could give that result as they hope to do in the UK. Anyhow, a change away from large scale shutdowns is needed to stop the economic collapse otherwise we are in for a downturn of unknown magnitude.
The last week of October is 38.2 years from August 13, 1982.
I read a story yesterday that made a strong case for the mortality rate to actually be around the 0.8% area instead of 2 or 3 percent. Also, there are some treatments like the Ebola treatment that seem to have some validity. This could kick in a couple weeks to also lower the death rate. And, with the start of spring we may see the contagion rate level off and decline in a month or so. All of this could create a ‘rip your face off’ rally in April or May lasting into summer if people start returning to work.
Then the reality will kick in. Even if workers start returning to work the economy will struggle to reclaim it’s glory. As Ken points out, corporations will struggle to finance their expansions back to normal and by October/November the virus will be back. A vaccine, if we can even make one that lasts, is still months away. The market will then probably dive to new lows.
Anyway, that’s how I see it playing out.
Sorry, not the Ebola treatment but the Malaria treatment that is proving effective. But I’ve read that this is a temporary solution and the virus will eventually develop a resistance to it.
So, the Fed is starting to buy Munis (and prices collapsed!).
The Fed could well start to support the Corporate Bond market by buying Corporate Bonds. If it does so, it would be interesting to see which slice of the bond market do they buy (investment grade or below investment grade and duration). After all the Fed did buy the worst possible instrument in 2008 (CMBS), the most junkier junk, if one has to call it.
Fed has promised to be innovative and short of being outright in the negative rate territory (which is what they have denied), who would have thought the Fed would dip its toes in the Muni bond market. in a similar vein, why should one be surprised if they would start to buy Corporate bonds!
One thing is for sure, the Fed does not want this to end in a Financial crisis and to their credit, they are doing everything possible.
The US government on the other hand is thinking of innovative ways to directly help the rank and file citizen through this time of distress.
So, it is a barbell approach, lining the pockets of Joe six pack with money, and keeping the plumbing of financial supply lines flowing and somewhere in between, keeping American businesses afloat.
Unlike the European Central Bank, the Fed by law cannot but corporate bonds of any type. The Congress has to pass a law to allow that.
They were able to get around that in the GFC by giving money to banks to buy them and then take them as collateral for guaranteed no-risk (to banks) loans.
So, can they do that again? Can they ask banks to buy corporate bonds and then take them as collateral for guaranteed no-risk (to banks) loans?
Anything is possible. The job of the Fed is to keep asset prices afloat!!
Thanks Ken. The President is desperate to get re elected and the Fed seems to be doing his bidding by certain metrics. So, anything is possible. What can I say.
When we know the extent of the potential damage (as mentioned in your article) the bottom will already have occurred. The uncertainty now is what makes valuations compelling. We will get through this much faster than anyone thinks and the market will rip back. Everyone is waiting on a vaccine but there are already promising treatments coming forth daily as evidenced in below article on new trial.
https://www.sciencedirect.com/science/article/abs/pii/S0924857920300996
These options will provide clarity and let everyone come out from lockdown.
Proper drug trials take much longer and are much broader in scope than what is described here in a small number of patients (yes, such papers can form the basis of a formal trial). We are talking years for a proper trial.
Any comment on why VIX went down with the broader market on Friday? Also what about the VIX term structure? Thanks.
Is it possible we are now at the stage where all the regular hedges stopped working and only cash is secure?
Vix term structure gives us some hope. If Spot-F1 goes contango, then probability goes up for short-term bottoming. Fri is quad-witching day, dealers been busy flipping all day (including premarket) to render both in the money put and call options worthless. This has resulted in correlation of movement much lower, hence lower vix.
It is not that hedging is not working. First it is damn expensive. Then you have to worry about dealers working against you, like on Fri. This has been going on a few weeks now such that many players have decided to just go to cash. This is not to say dealers are flush with profits. They are bloodied too. Just show you when volatility is this high, no player wins. So we need vix to come down. First step is Spot-F1 goes contango.
Hi Ingjiunn, any good website to follow these parameters ?
Thanks for the reply!
https://www.cnn.com/2020/03/21/politics/fda-coronavirus-test/index.html
A rapid 45 minute, point of service test would be God sent. This company received an Emergency approval and will start sending the kits next Friday.
My understanding is this is quick-screening, not full test which needs PCR, a 1-4 day event. Taiwan does 15-min screening at airport. Those shown positive are isolated and undergoing further testing. Some of these quickly fell ill and need treatment.
80% of infected individuals will not develop a serious illness. The rest 20% seems to be at risk of falling really sick.