Preface: Explaining our market timing models
We maintain several market timing models, each with differing time horizons. The “Ultimate Market Timing Model” is a long-term market timing model based on the research outlined in our post, Building the ultimate market timing model. This model tends to generate only a handful of signals each decade.
The Trend Asset Allocation Model is an asset allocation model which applies trend following principles based on the inputs of global stock and commodity price. This model has a shorter time horizon and tends to turn over about 4-6 times a year. In essence, it seeks to answer the question, “Is the trend in the global economy expansion (bullish) or contraction (bearish)?”
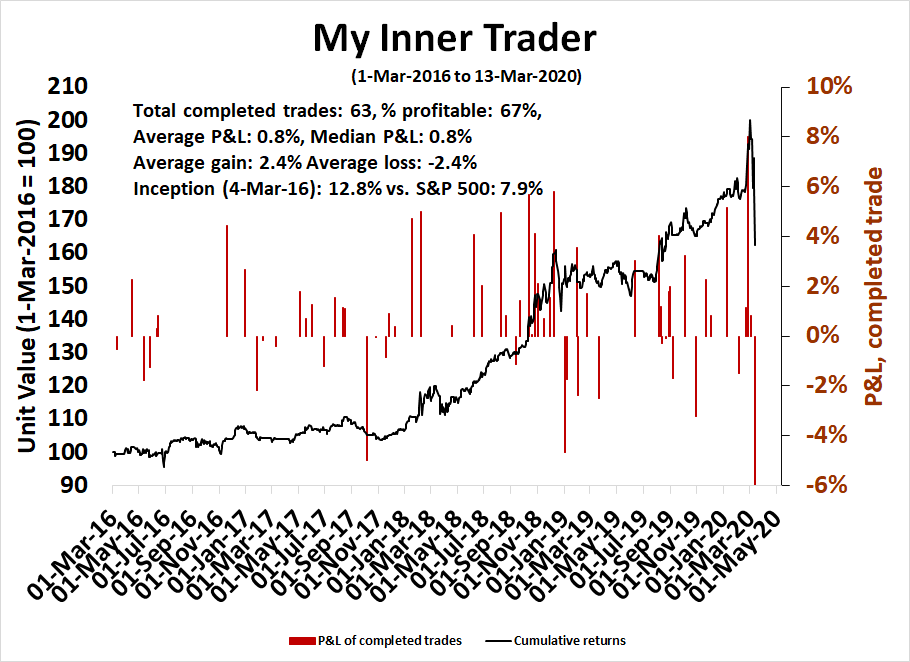
My inner trader uses a trading model, which is a blend of price momentum (is the Trend Model becoming more bullish, or bearish?) and overbought/oversold extremes (don’t buy if the trend is overbought, and vice versa). Subscribers receive real-time alerts of model changes, and a hypothetical trading record of the those email alerts are updated weekly here. The hypothetical trading record of the trading model of the real-time alerts that began in March 2016 is shown below.
The latest signals of each model are as follows:
- Ultimate market timing model: Sell equities
- Trend Model signal: Bearish
- Trading model: Neutral
Update schedule: I generally update model readings on my site on weekends and tweet mid-week observations at @humblestudent. Subscribers receive real-time alerts of trading model changes, and a hypothetical trading record of the those email alerts is shown here.
The long awaited bounce?
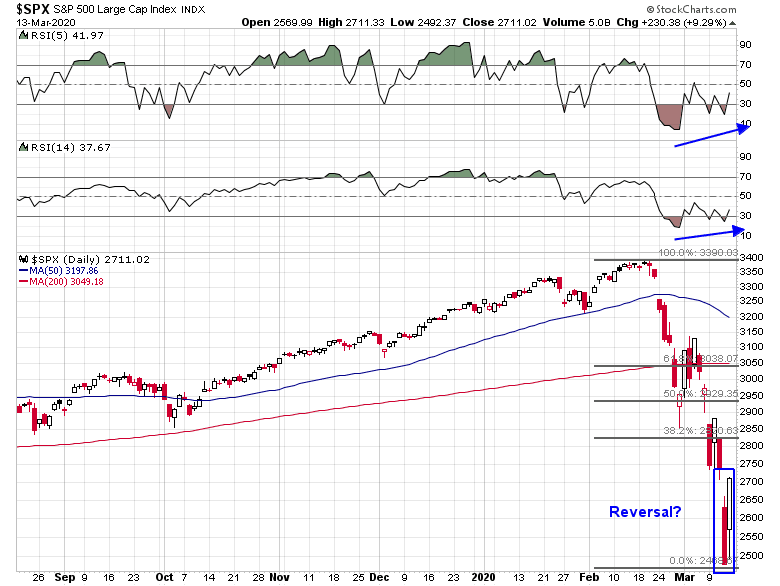
Is this the long await bounce for the stock market? The SPX traced out a strong bullish reaction to Thursday’s ugly action while exhibiting positive RSI divergence. If this is the long awaited bounce, the most logical resistance level is the 50% retracement, which is also the site of the 200 day moving average.
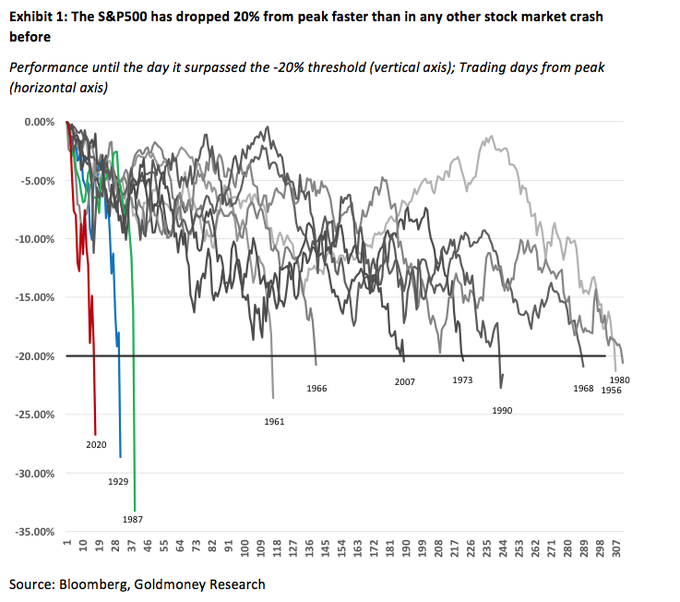
This retreat into bear market territory, as defined by a -20% decline, was the fastest in market history, even compared to the Crashes of 1987 and 1929. Bear in mind that if this was the capitulation low, the market bounced at the initial low in 1929, and in 1987. Each had very different results. Both were market crashes, one went on to mark the start of the Great Depression, the other was just a blip in a continuing economic expansion.
A review of market history
A tour of market history of past market bottoms and crashes is in order. Let’s start with some past market crashes.
The market reaction to the crash of 1929 was a relief rally. The Dow pulled back after the initial bounce, but the old 1929 low was not tested and broken until over a year later. The rest, as they say, is history.

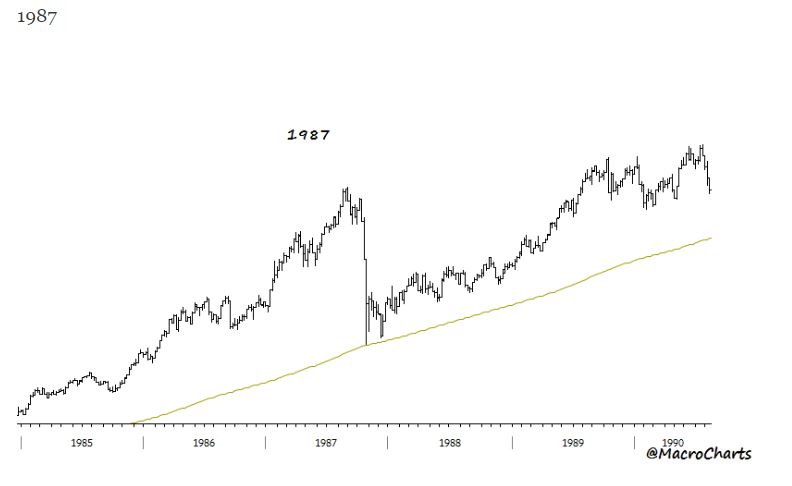
The crash of 1987 saw the market bounce, followed by a re-test within a few weeks. The market continued to advance after that event as the market crash did not spark a recession.
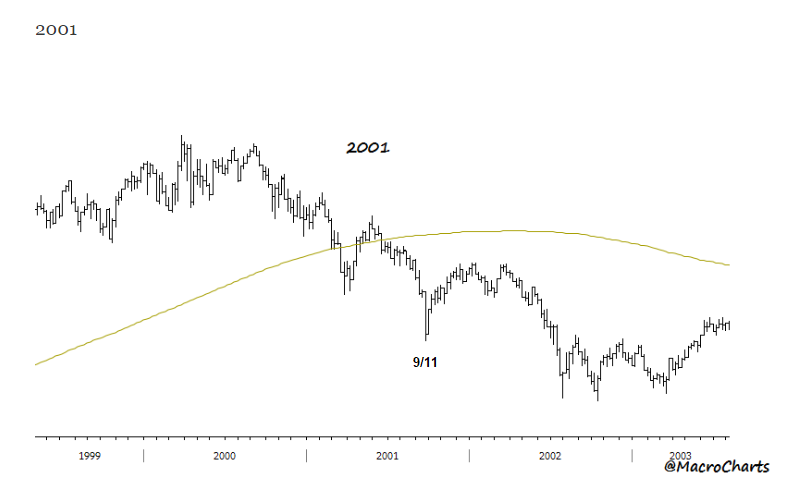
The shocking events of 9/11 was a special case. The economy was already in recession. The market bounced after 9/11, but it weakened after the bounce and made a new low in 2002. The 2002 bottom was a classic bounce-and-retest bottom.
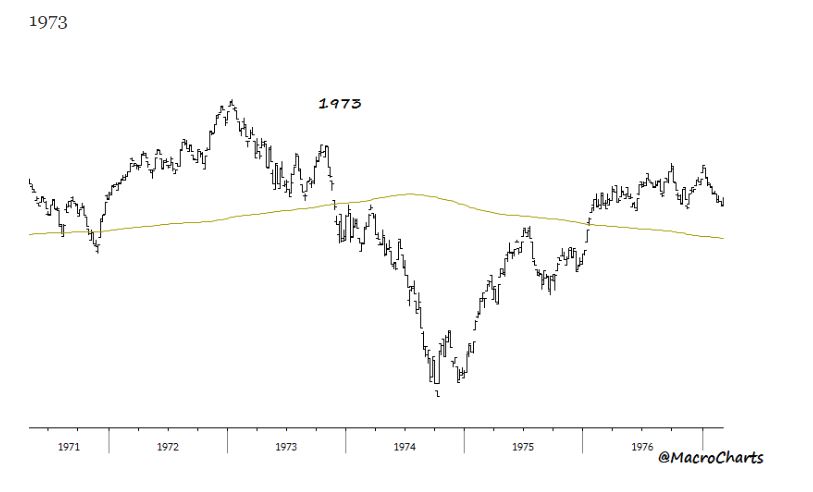
Here are some other examples of market bottoms that occurred in recessions. The ugly 1974 bear market was another bounce and retest bottom.
The market bottom of 1962 was marked by an initial low sparked by the Cuban Missile Crisis. The market was already falling owing to the “Kennedy Slide” because of the administration policies on steel. The market bounced, and saw weakness and a near retest of the Cuban Missile Crisis bottom a few weeks later.

The bottom in 1982 is best described as a complex W-shaped choppy low.

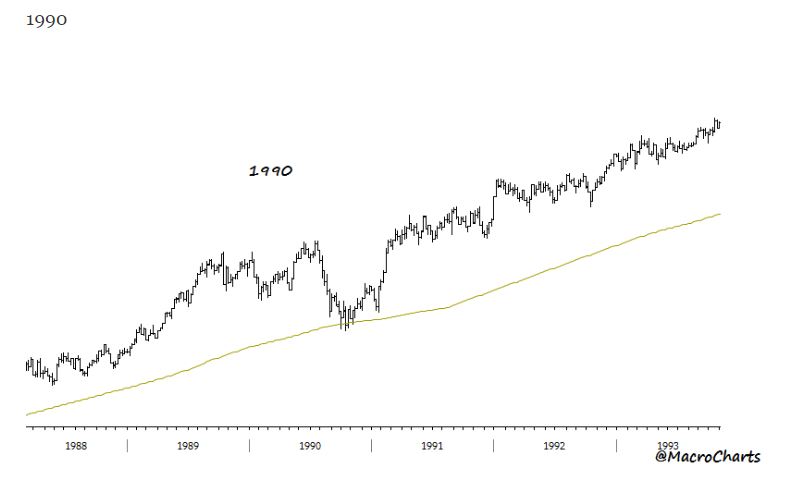
The recession low of 1990 was also a complex W-shaped bottom.
Here are the lessons of this stock market history review. After an initial bottom:
- The market either forms a W-shaped choppy bottom, or a bounce and retest
- The retest may not necessarily be successful. Failures of retests have usually occurred when the economy was in recession.
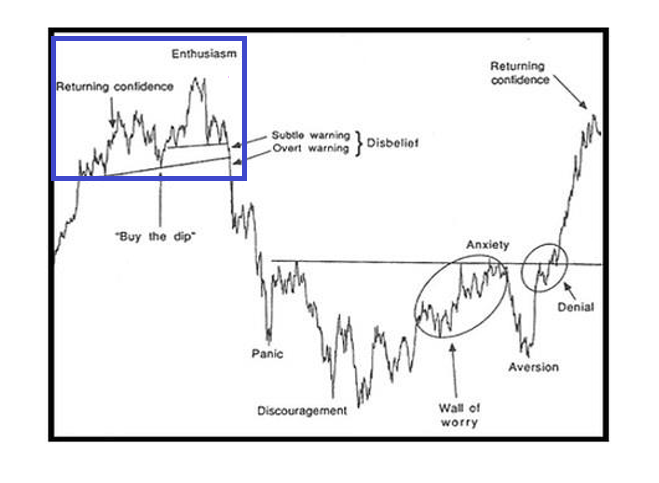
Sentiment cycle supportive of a bottom
Where do you think we are in the sentiment cycle?
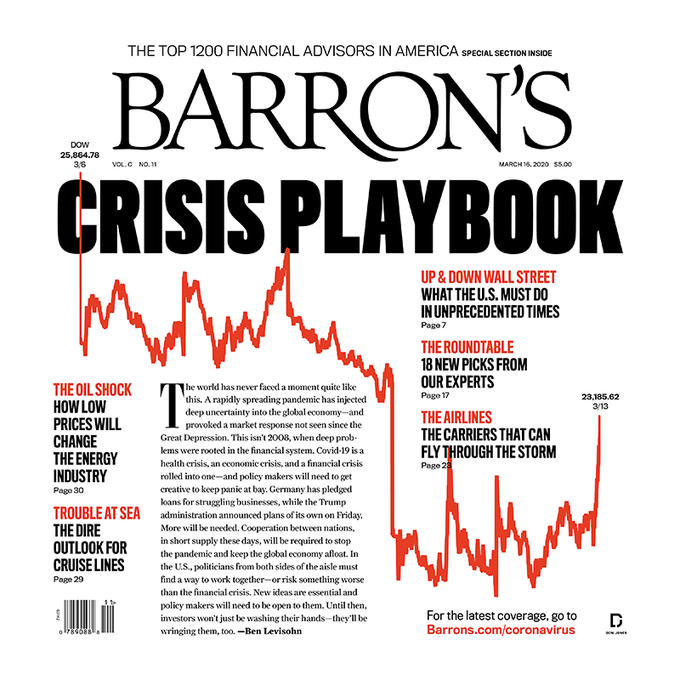
My personal assessment is we hit unbridled panic last week, based on the comments on my social media feed. Consider how the tone of Barron’s covers have changed in a few short weeks, as a classic example of the contrarian magazine cover sentiment indicator. A few weeks ago, Barron’s was constructive in the face of the market weakness.

This week, they are *ahem* less constructive on the markets.
We will see confirmation early next week whether last Thursday represented the first low of this sell-off.
A low, but THE LOW?
We saw the initial low in the market last week, was it the bottom, or a level at which investors can start buying?
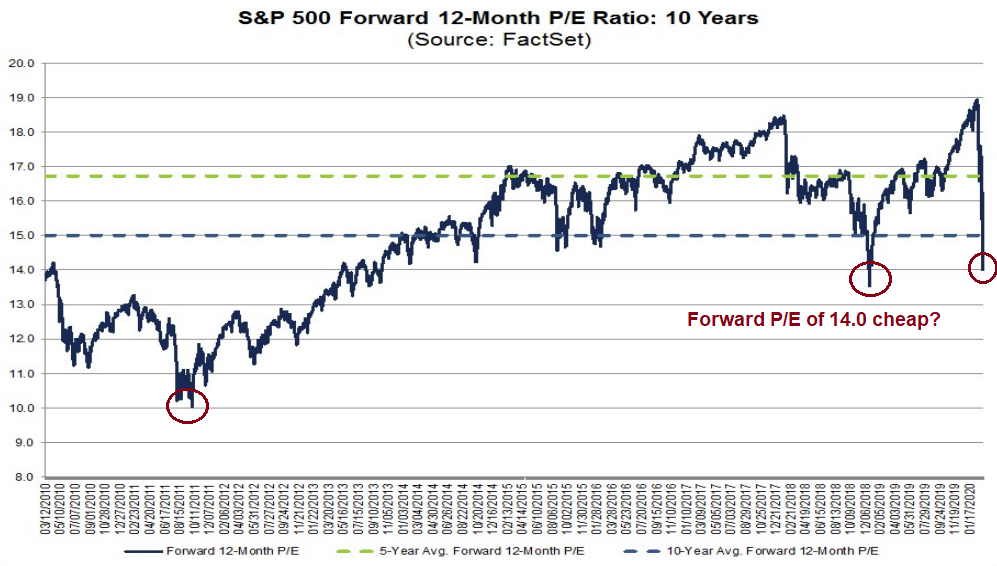
Here is the bull case. FactSet reported that the market’s forward P/E ratio fell to 14.0, which is below the 5-year average of 16.7, and 10-year average of 15.0. A 14x multiple is close to the multiple achieved at the Christmas Eve bottom of 2018.
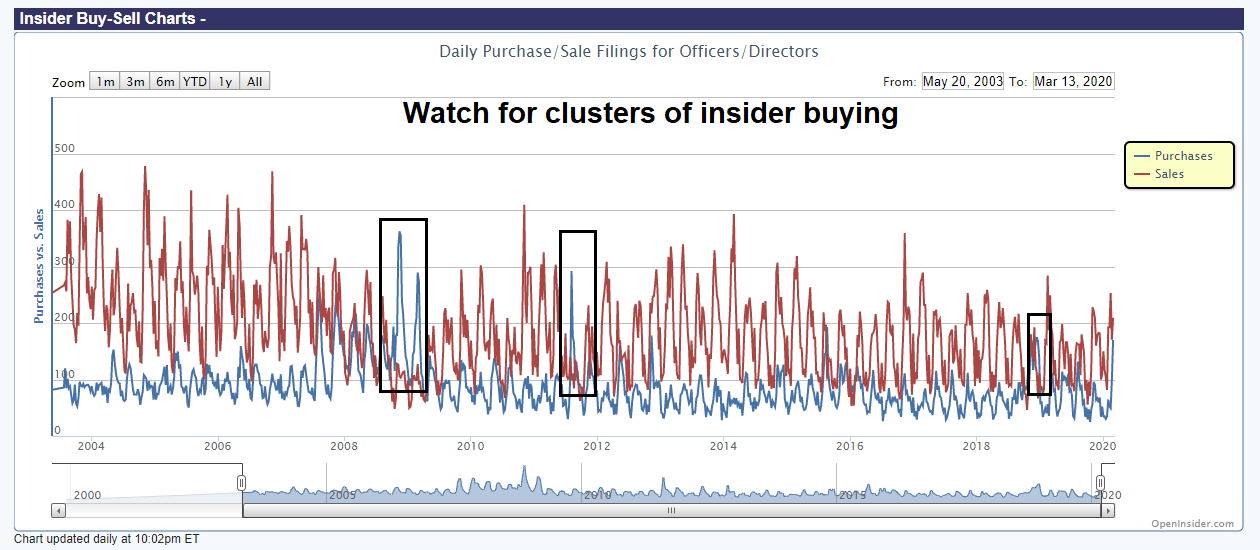
Moreover, insiders are buying.
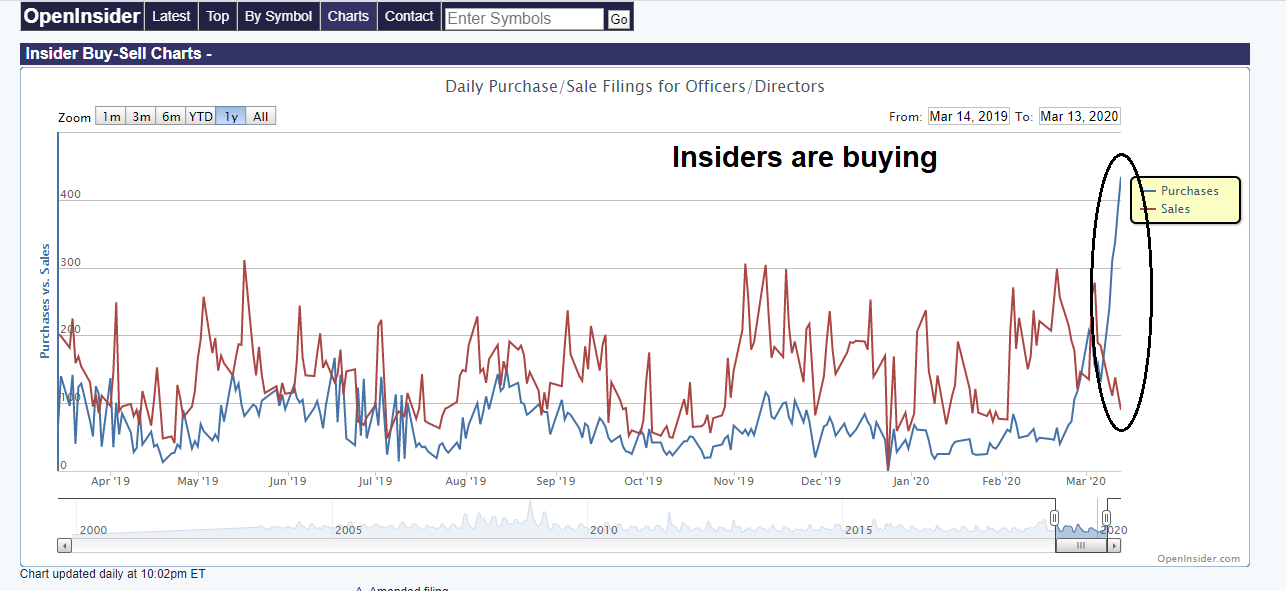
The market is starting to look cheap, and insiders are buying. What are you waiting for?
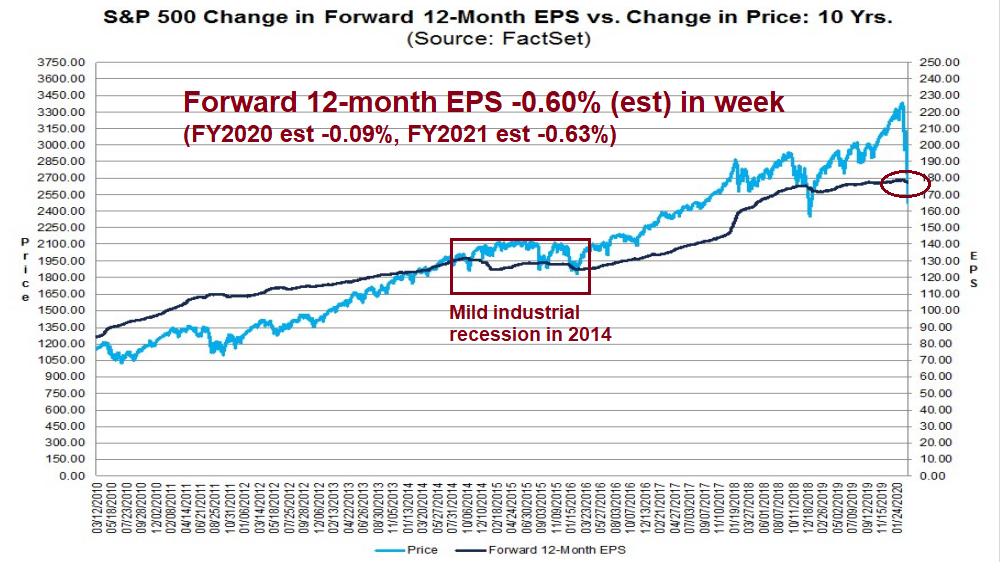
Not so fast, say the bears. This was the fastest market decline in history. Past market bottoms were characterized by slower and gradual weakness. The estimated E had no chance to catch up with the rapid deterioration of the P of the P/E ratio. Forward 12-month EPS had been mostly flat since late 2019, and they have only begun to fall. The weakness in forward EPS is nowhere nearly as negative as the experience of 2014-15 when the economy experienced a shallow industrial recession.
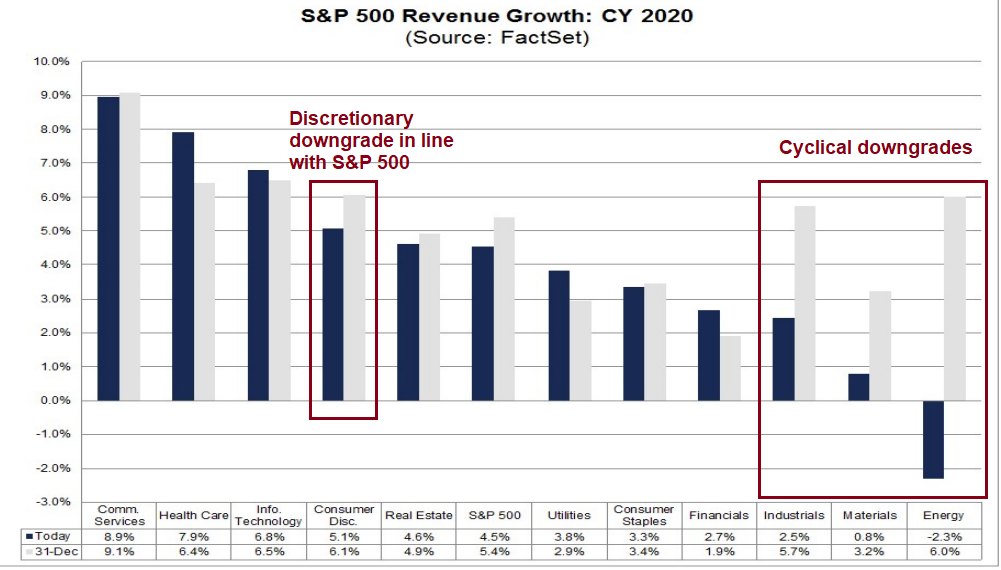
A more detailed analysis of sales estimates tells the story. The softness in estimates is concentrated in the cyclical part of the market, industrials, energy and materials, which is reflective of the weakness emanating from China and oil price war. Consumer discretionary sales downgrades are only in line with the market. The discretionary stocks are likely to be most affected by the demand shock that hits the economy as the COVID-19 epidemic spreads in the US. In short, EPS downgrades have a lot further to go because they have not fully reflective of the damage from the coronavirus epidemic.
While the signs of insider buying can be viewed as constructive, we have not seen the kind of concentrated insider buying clusters that have marked durable bottoms in the past. In addition, insider buying is not an actionable buying signal. While they may be necessary conditions for a long-term bottom, insiders signals are often early.
Here is how I estimate a range where the S&P 500 may bottom. If we were to throw out the recessions that began in 2000 and 2008 as finance sparked recessions, the recessions of 1982 and 1990, which are more classic recessions experienced in the post-war period, saw forward EPS decline by about 10%.

If we apply a -10% discount to S&P 500 forward EPS we get roughly $160. The market bottomed out in 2011 at a forward P/E of 10, and in 2018 at a forward P/E of 13.5. Apply those multiple to the discounted forward EPS of $160, we arrive at a target range of 1600 to 2160, which represents downside potential of -20% to 40%.
I would add that a -10% haircut on forward EPS is a conservative estimate. The consensus top-down earnings downgrade is in the high teens, and possibly as high as 20%.
If last week was the initial panic low, don’t expect the retest to be successful. Under a recession scenario, there is more valuation downside potential.
Recessionary bear
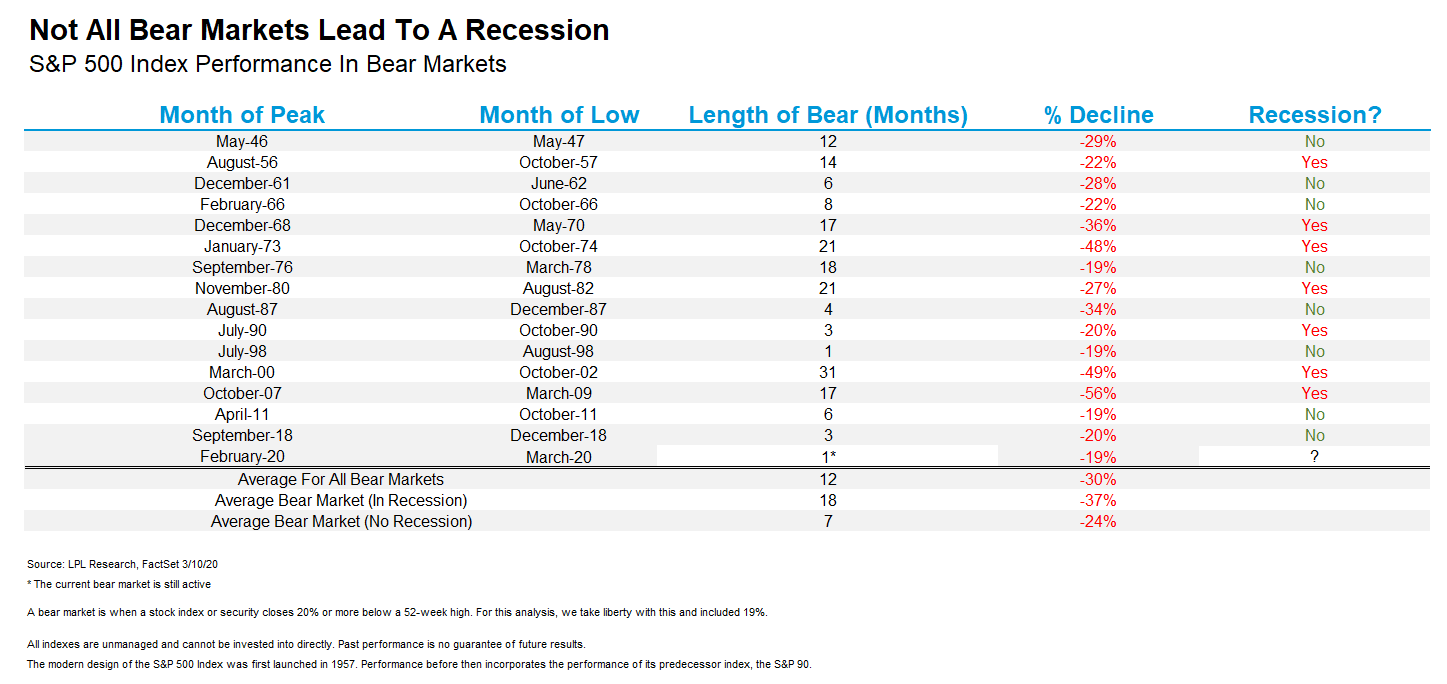
This is a recessionary bear market. Recessionary bear markets last longer and prices decline more than non-recessionary bears. Investors should act accordingly and be in a position of maximum defensiveness/ My inner investor was already at his minimum equity weighting entering the week. The decline in equity prices put him below target, and in light of a possible bounce, he will re-balance and buy so that he is at his minimum equity target.
Ryan Detrick of LPL Financial pointed out that recessionary bear markets last longer and see deeper pullbacks than non-recessionary bears. Investors need to respect that lesson from market history.
My inner trader got stopped out on Thursday’s panic sell-off and he therefore missed Friday’s recover. Traders should pay special attention to the high degree of market volatility and size their positions accordingly. The FOMC is meeting next week, and the Fed’s decision could be a source of volatility.
Even if last week’s low was not the final panic low, the odds does favor a bounce in the very near future. An analysis of stock/bond relative performance shows that stocks have dramatically underperformed bonds. As we approach quarter end, we should start to see equities to be bid as institutional re-balancing programs kick in.

My inner trader is on the sidelines, but he is poised to return to trading by dipping his toe in on the long side. He just needs some price momentum confirmation that the bottom is in.
Well done, Cam
Cam, Would you please change the font of your emails to a larger size. The size on your posts that show on your website is fine but your email font size shows as way smaller than all my other emails.
Hi Cam, I hope this comment finds you well! In your latest update, you stated the following:
If we apply a -10% discount to S&P 500 forward EPS we get roughly $160. The market bottomed out in 2011 at a forward P/E of 10, and in 2018 at a forward P/E of 13.5. Apply those multiple to the discounted forward EPS of $160, we arrive at a target range of 1600 to 2160, which represents downside potential of -20% to 40%.
I would add that a -10% haircut on forward EPS is a conservative estimate. The consensus top-down earnings downgrade is in the high teens, and possibly as high as 20%.
If last week was the initial panic low, don’t expect the retest to be successful. Under a recession scenario, there is more valuation downside potential.
At the end of your post you mention waiting for price momentum to get better to give you confidence that a “bottom” is in. I assume you mean a near term tradeable bottom, and not the final valuation bottom that you speak of when discounting S&P EPS -10% putting us in that 1600 to 2160 price range?
Thanks
Mike
Yes you are correct. Watch for signs of a tradable low.
Fed announced Fed funds rates to be cut to zero and 700 million $ QE. Sure enough, S&P futures are down triple digits. Here comes the lower low!
The Fed takes out bazooka to quell the markets. And the S&P futures are down in triple digits?
I don’t get it. The Fed has thrown open the monetary spigots and the US congress has many fiscal bills in the pipeline to mitigate the pain of affected individuals and businesses. The state and local governments are taking actions allover to stop the spread of the disease. The same is happening in Europe and many other countries.
Isn’t all of this good after many weeks of denials and dithering?
The Fed doesn’t know more than the markets do. Aren’t these just the preemptive actions taken by the Fed to ensure smooth functioning of the markets? Why are the futures down?
Watch the BBB and CCC spreads over treasuries on St. Louis Fed site. Just Google these terms and you should get these graphs and will know what is happening in the junk and the near rated bond universe.
2. The Fed is ensuring that the financial plumbing of the US is working without blockages. It pumped up the repo market last week by 175 Billion $ to ensure that market works smoothly.
3. We are going to have bankruptcies in the Energy patch, and the Fed is making sure that capital keeps flowing to these companies FWIW.
4. Historically, after every QE and cut in Fed funds rate, stocks dropped and bond yields soared (money fled out of stocks and went into bonds). We are seeing the same tonight. However, stocks did rally thereafter. For now, there is pervasive fear. CDC has advised no more than 50 people gather at one place for eight weeks. Of course it is going to cause a hair cut in EPS as outlined by Cam.
Hope this explains the backdrop.
Thank you for your response. The last point was very helpful.
=> Historically, after every QE and cut in Fed funds rate, stocks dropped and bond yields soared (money fled out of stocks and went into bonds).
I assume you meant “bond yields dropped.”
Here are two links that update daily on the CCC and BBB from the St. Louis Fed.
Note how the spreads dropped sharply in early 2019 when the Fed changed from raising to dropping rates. That is the sign that well.
https://fred.stlouisfed.org/graph/?graph_id=582384&rn=562
https://fred.stlouisfed.org/series/BAMLH0A0HYM2
Yes, agree with you; bond prices soared and yields dropped. A QE indicates something drastically wrong with the market, hence the counter intuitive reaction of the market.
This is a great time to borrow money, refinance higher interest rate debt.
Ken, thanks for these graphs. Is there a place where the spot yields on these bonds can be looked up? The St. Louis Fed side gives spreads based on closing prices.
I do see that JNK and HYG that may be proxies for Junk bonds are selling off quite heavily today.
Cam
Are we at the “buy the dip” phase in the blue box? Thanks.
or at the “panic” state?
¯\_(ツ)_/¯
Watching what happens on Monday. Sunday night futures are notoriously unreliable as guides to what happens on Monday.
Yes, agree, Sunday may be a thinly traded market, causing large price swings. That said, gold rallied 55$ in the futures market, but at 6 AM EST is showing only a 10 $ rise. Same for US treasuries, after a whipsaw move up, ten year treasury is not at the bottom of the yield spectrum. Sure, to your point, the initial prices on gold and treasuries on Sunday may have been non representative.
Cam,
To arrive your bear case target price on SPX, why do you think we must get to 10-13.5x PE ?
Given that 10-year yield is near historical lows, even if we assume equity risk premium (ERP) rises to recession levels, shouldn’t PE be higher as a result?
For example, say I assume 6% ERP and 0.5% risk free rate, we arrive at 15.4x PE.
I am not bullish/bearish the market but just would like to know your thought process there. Thanks !
There is a phenomena within a recession where the PE goes up dramatically at the bear market low. This is because many companies report losses rather than profits.
We are going to see this soon with the energy subindex. At its low point, the PE could be infinite as the profit per share of the index will be a negative number. Being in Canada, I’ve seen the whole general market index go this way.
When you are in that type of recession where many sectors are in a net loss position, PE is a bad guide for value. In other words if a well run airline stock goes from YOY earnings of $5.00 a share to temporary low earnings of YOY 50 cents and the stock has gone from $75 (15 PE) down to $30 (60 PE) it may be a screaming bargain.
The more the number of stocks within a given index that have this hit to earnings, the less reliable is a PE of the index.
This is most prevalent in indexes like my Canadian general market index with cyclical companies. American investors never really see this since normally their index is weighted to stable corporate earners.
This virus might just shock the entire 500 shares in the S&P for a quarter or two. Don’t let a high PE prevent you from buying at a once in a lifetime low if that happens.
I agree with your analysis on P/E, but only on either reported or trailing P/E. Wall Street is always more optimistic, and forward P/E ratios tend to be more stable. That’s why I focus on the forward 12m P/E ratio in my analytical framework.
Exactly
The Monday AM futures are near Thursday’s lows. If the following article gains traction, we could be at or near the bottom: https://www.jpost.com/HEALTH-SCIENCE/Israeli-scientists-In-three-weeks-we-will-have-coronavirus-vaccine-619101
A vaccine would be terrific news, but it will still take about a year to be widely available. It sounds like they are still in the lab stage. As I understand it, here are the steps to approve any new drug:
1) Animal tests to see if has the effect (looks like it was done, maybe)
2) Human tests to see if it’s safe (no adverse reactions)
3) Human tests to estimate dosage
If they can jump through all those hoops, you have to go into mass production, which also takes time.
There are several vaccines being worked on. Here is another one
https://www.oregonlive.com/coronavirus/2020/03/coronavirus-vaccine-trial-starts-monday-in-seattle-but-process-could-take-more-than-a-year.html
Plus, if (when) the virus mutates they have to start all over for the new strain. That is why we don’t have a vaccine for the common cold.
Actions by the Fed so far:
1. Fed cut target Fed funds rate by a historic 100 basis points, helping the mortgage, financing markets, and Treasurys.
2. The Fed committed to buy $500 billion in Treasurys and $200 billion in mortgage backed securities.
3. It set much easier terms for foreign exchange swap lines so countries like the UK and Switzerland can obtain dollars more cheaply.
4. Repo market: Fed pumped in 175 Billion last week and 500 Billion in the repo market today.
5. The Fed eliminated reserve requirements for banks, which is unprecedented. Banks are normally required to hold 10% of their assets (i.e. loans) at the Fed. This is expected to free up money for banks to make loans. Furthermore, this move will help banks from meeting reserve ratios as losses mount on Bank Books (hopefully this is temporary, hence elimination of Reserve requirement, for now).
6. The average headline will call this throwing in the proverbial kitchen sink.
First round of layoffs happening in my town. Mostly retail, restaurant/entertainment, and service industry at the moment. I wouldn’t be surprised if the unemployment rate doubled (3% to 6%) in the last week.