Preface: Explaining our market timing models
We maintain several market timing models, each with differing time horizons. The “Ultimate Market Timing Model” is a long-term market timing model based on the research outlined in our post, Building the ultimate market timing model. This model tends to generate only a handful of signals each decade.
The Trend Asset Allocation Model is an asset allocation model which applies trend following principles based on the inputs of global stock and commodity price. This model has a shorter time horizon and tends to turn over about 4-6 times a year. In essence, it seeks to answer the question, “Is the trend in the global economy expansion (bullish) or contraction (bearish)?”
My inner trader uses a trading model, which is a blend of price momentum (is the Trend Model becoming more bullish, or bearish?) and overbought/oversold extremes (don’t buy if the trend is overbought, and vice versa). Subscribers receive real-time alerts of model changes, and a hypothetical trading record of the those email alerts are updated weekly here. The hypothetical trading record of the trading model of the real-time alerts that began in March 2016 is shown below.

The latest signals of each model are as follows:
- Ultimate market timing model: Sell equities
- Trend Model signal: Bearish
- Trading model: Bearish
Update schedule: I generally update model readings on my site on weekends and tweet mid-week observations at @humblestudent. Subscribers receive real-time alerts of trading model changes, and a hypothetical trading record of the those email alerts is shown here.
A factor review
The past few weeks have seen much market volatility and confusion among market participants. One way of cutting through the noise is to see what market factors are leading and lagging.
Our primary tool is the Relative Rotation Graph (RRG). As a reminder, Relative Rotation Graphs, or RRG charts, are a way of depicting the changes in leadership of different groups, such as sectors, countries or regions, or market factors. The charts are organized into four quadrants. The typical group rotation pattern occurs in a clockwise fashion. Leading groups (top right) deteriorate to weakening groups (bottom right), which then rotates to lagging groups (bottom left), which changes to improving groups (top left), and finally completes the cycle by improving to leading groups (top right) again.
The chart of recent factor leadership is shown below.

Leaders and laggards
Here is the relative performance chart of the leaders, as shown in the top right leading group quadrant. The winners consist of FANG+, and large and small cap growth. Bringing up the rear among the leadership group is price momentum (bottom panel).

The following factors that had shown some strength, but they are now rolling over.
- High beta;
- Russell 2000 small caps;
- Shareholder yield; and
- Small cap value.
The remainder are the laggards, which never really gained much traction.
- Low volatility;
- Dividend Aristocrats;
- Large cap value;
- Quality; and
- Buybacks.
Do you notice a pattern here? Growth stocks, and large cap growth in particular in the form of FANG+ names, have been the leaders. Not much else has worked as a factor selection technique in the past few weeks. In particular, the difficulty shown by the high beta factor even as the market advanced is worrisome.

A stylistic warning
A recent warning came from a Marketwatch article highlighted analysis by Style Analytics, which found notable differences when it looked at past bear markets and rebounds.
Style Analytics, a research firm based in Boston and London, has studied both the crash and recovery, and compared them to other crashes — the global financial crisis, the dot-com bubble and the 1987 crash.
The COVID-19 crash was similar to the crashes from the global financial crisis and 1987 in how stocks of various styles and factors reacted.
But the recovery hasn’t been.
“The only factor to beat the overall market in the current rally is momentum, indicating that investors are doing little more than chasing returns (mostly in tech stocks),” the firm says.
In other words, there has been no change in leadership.
By contrast, value and small cap — normally two of the most outperforming factors in recoveries — are the two worst underperformers during the current rally.
“While this may partially be explained by the fast cash stimulus propping up previous winners, it raises questions about whether the recovery has begun or whether this rally is part of an overall larger market decline yet to materialize,” they write.
The leadership of the Big Three remains unchanged. US over global stocks; Growth over value; and large caps over small caps. This kind of market action suggests that the latest rally is a bear market rally, instead of a rally off a sustainable bottom. Market leadership usually changes during bear markets, and new ones emerge in the fresh bull. That’s not the pattern we are seeing today.

Before everyone gets overly bearish because of the market’s narrow breadth, Goldman Sachs found that typically these periods of narrow breadth lasts a median of three months, and as long as 27 months during the Tech Bubble in 1998-2000.

Sentiment: Bullish or bearish?
Sentiment models are flashing mixed signals. Short-term AAII (mostly day and swing traders) sentiment is normalizing off a bearish extreme, which is constructive for stock prices.

Investors Intelligence sentiment is normalizing in a similar fashion. %Bears is receding off a crowded short level, but readings have not returned to neutral yet.

On the other hand, Mark Hulbert worried that newsletter writers were far too quick to jump on the bullish bandwagon. He concluded that the latest rally is likely to be a bull trap.

My assessment of sentiment concludes that it is a mixed picture, characterized by short-term positive momentum but at risk of a significant reversal. Hedge fund CTAs are roughly neutrally positioned. Retail traders are recovering from an extreme, which is bullish. The BAML Fund Manager Survey shows global institutions are defensively positioned with high cash and low equity weights, but managers have piled into the US equities as the last source of growth.
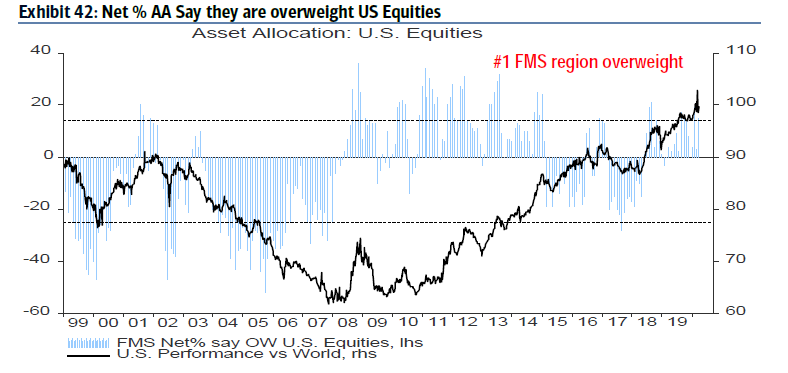
From that perspective, the US market’s narrowing leadership, and crowded global manager long position indicate a market that is at risk of a reversal. In that case, the retail momentum players could be seen as late to the party, and trying to pick up pennies in front of a steamroller.
Interpreting sentiment is more an art than science. I would point out there are different sentiment indicators that measure different parts of the market. Sentiment is not monolithic. Here are just a few examples:
- Retail investor sentiment (AAII asset allocation survey, done monthly, BAML)
- Retail swing/day trader sentiment (AAII weekly sentiment survey)
- Advisor sentiment (II, NAAIM)
- Global institutional (BAML Fund Manager Survey, monthly)
- US institutional (Barron’s Big Money, quarterly)
- Institutional positioning (State Street)
- Hedge fund, which can be further broken down into different groups, such as market neutral, long short, global macro, etc. (e.g., COT, option data, JPM’s Kovanovic)
- Insiders, whose signals are generally useful at bottoms and not at tops
The sentiment of all these groups don’t all move together, and keep in mind each group has its unique investment time horizon. Institutions are the elephants. Their moves are glacial, but when they shift, the fund flows are relentless. Hedge funds have turnover rates that can be an order of magnitude higher than institutional investors, and they can really move markets in the short run. Retail sentiment is becoming less important, but retail investors can be important at the margin.
Survey data is less reliable than positioning data because surveys only tell you how a respondents feel about the market, and do not tell you anything about what they are actually doing with their money. Some surveys, such as the BAML Fund Manager Survey, address that problem by asking how the managers are positioned. Others, such as the weekly AAII sentiment and Barron’s Big Money, do not.
Possible bullish exhaustion
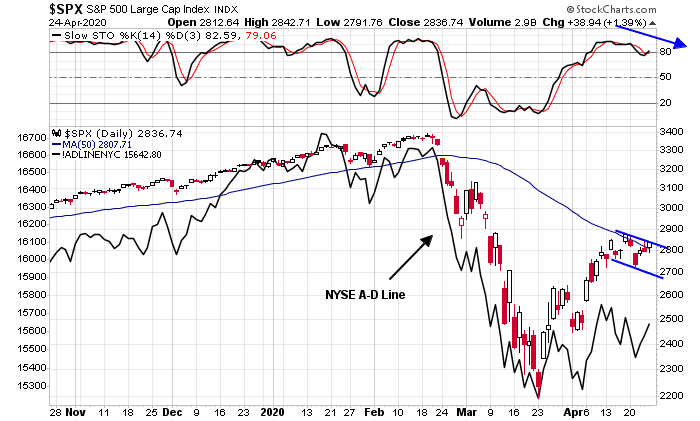
There are signs that the market is experiencing bullish exhaustion. The S&P 500, DJIA, and NYSE Composite broke down through rising trend lines just as the indices approached their 50 dma from below.

The one major exception is the NASDAQ 100, which broke out above its 50 dma and remains in a rising channel.

The week ahead
Looking to the week ahead, the short-term outlook presents a mixed picture despite the weight of intermediate term bearish evidence. The bulls can highlight a possible bull flag that is forming, and about to break up. The bears can point to the negative divergence from the NYSE Advance-Decline Line, as well as a daily stochastic that is recycling from an overbought condition, which is a sell signal.
The analysis of the top five sectors presents a picture of narrow but bullish leadership that is exhibiting positive momentum. As a reminder, the top five sectors comprise nearly 70% of index weight, and the market cannot significantly move up or down without the participation of a majority of these sectors. Three of the five sectors, Technology, Healthcare, and Consumer Discretionary, are either in bullish relative uptrends or they are staging relative breakouts. These three strong sectors represent 48.3% of index weight and their strength cannot be ignored. However, the Consumer Discretionary chart (bottom panel) is reflective of the strength of AMZN. The equal weighted relative performance line (in green), which discounts the weight of AMZN, is far weaker than the cap weighted chart.

From a longer term weekly perspective, last week was an inside week, indicating that a big move may be coming. RSI momentum has been falling, and appears to be rolling over.

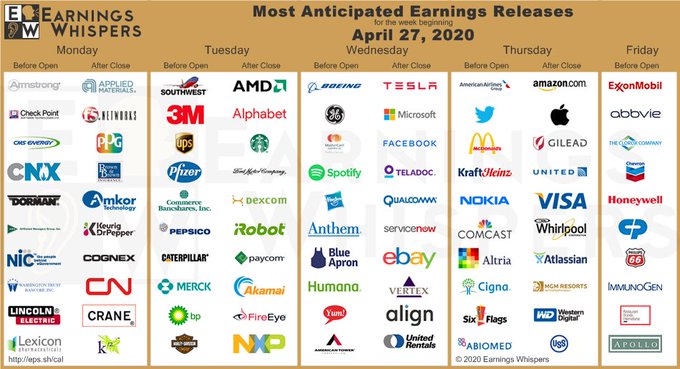
In other words, much depends on the earnings reports the FANG+ stocks next week of Facebook and Microsoft (Wednesday), and Apple and Amazon (Thursday).
In conclusion, signs are growing that the bulls are starting to lose control of the tape. Despite my longer term reservations about this market, this does not necessitate an immediate retest of the March lows. Any bullish break could resolve itself with a period of sideways and choppy consolidation. If I had to guess, I would assign a 30% chance of an immediate downdraft and retest in the next month, and 50% chance of choppy consolidation, and 20% chance that the bulls will push prices higher.
My inner investor’s portfolio is in a position of maximum defensiveness. A discussion with a reader led to an interesting idea of writing a collar, where the investor sells a call option to finance the purchase of a put option to guard against the possible retest of the March lows. My inner trader remains short the market, but he is keeping an open as to different possibilities.
Disclosure: Long SPXU
Cam, collar for an un-sophisticated investor is tad too much complex. For a layman, do you think it may be better to buy treasury bond or Gold ETF for downside protection?
With regard to Hulbert’s newsletter survey, if I’m reading the chart correctly, the average recommended equity exposure of newsletter writers is about 13%. That doesn’t seem wildly bullish to me. I get Hulbert’s point, that it isn’t so much the absolute % but rather the recent spike upwards, but still …. He has a very good reputation and track record, so I’m probably just nit picking.
Another of Hulbert’s observations is the lead time between the point of maximum pessimism and the market’s ultimate low. In the case of his newsletter survey, it’s about 34 days. The YTD low for the HSNSI occurred on 4/1/20.
Interesting. Do you have a link for the report? I wasn’t able to find it, assumed is was behind a pay wall.
Cam, really appreciate you weighting the various potential outcomes in your conclusion, understanding anything can and often does happen!
Venerable analyst Tom Kurlak (Urban Carmel) published an interesting article about bull markets and narrowing leadership. Cam had quoted this circa last 12 months of writings.
His conclusion was that narrow leaderships are common in bull markets.
See Goldman study of narrow leadership that I cited.
This is hardly a bull market. We just hit a sudden stop in the global economy. Bull markets don’t swing 2% and 3% on a daily basis. Bear markets do.
Thanks.
Hey folks, I sent out a recommendation to subscribe to Cam’s newsletter to 150 people last week. I think I’m doing them a bigger favor than for Cam.
Do your friends a favor and tell them about Cam’s valuable advice especially at this critical time in investing history. How would you feel if you missed a life-changing market decline with Cam’s advice and your friends and family didn’t?
Ken – I appreciate the support.
http://thepatternsite.com/Blog.html#P27
I find The Bulkowski blog full of statistics and quite interesting. Here are his tips for the upcoming week (posting this for traders). The following is simply based on chart patterns, nothing to with fundamentals, hundred year one of storms like a war or pandemic or financial crises like the GFC.
Swing Traders: Pivot Points
Index S2 S1 Pivot R1 R2
S&P500: Daily 2,773 2,805 2,824 2,856 2,875
Weekly 2,669 2,753 2,811 2,895 2,953
Monthly 1,949 2,393 2,636 3,080 3,323
S&P 500 closed at 2837 as a reference to the above Support (S) and Resistance (R) levels.
Here are general considerations based on the above levels (Even if you are not a trader, pay attention to #6);
1. Seekinger doesn’t look at the range of S2 to R2 as support and resistance levels. Rather, he considers them oversold (S) and overbought (R) areas.
2. S2 to R2 range of values across daily, weekly, and monthly periods: If two values are close together then they lend more significance to the area.
3. If the market trends on day 1, the odds rise tremendously that the market will be range bound between daily S1 and daily R1 the next day.
4. In a quiet market when traders are waiting for an important earnings announcement or economic report, look for daily R1 and S1 levels to hold and for the market to return to the daily pivot.
5. A move outside of daily R1 or S1 usually does not mean a breakout.
6. The odds suggest that the entire week’s price action will remain between weekly R2 and S2.
7. Avoid going long when the market moves above weekly R2 (it’s overbought) and avoid going short when price moves below weekly S2 (oversold).
8. Consider going short at weekly R1 or long at weekly S1 with a profit objective of the weekly pivot.
9. Consider going long at weekly S2 or short at weekly R2 with a profit objective of weekly S1 or R1, respectively.
The R2-S2 band remains very wide, reflecting the underlying heightened volatility. That said, there was a post about flattening volatility in the previous post that I am posting here;
Ingjiunn says:
April 25, 2020 at 8:27 pm
First step to normalization, if you can call that, is for vix spot-F1 to go contango. After a big drop for vix on Fri, it happened. The futures term structure has much smaller backwardation now. Let’s hope spot vix continues downward move and causes much flatter term structure, eventually into full contango. A lot of implication here. Chief among them is the correlation of movement rapidly decreasing. This will gradually reduces the chances of retest. Translation into stock markets is range bound with small upward slope overall, and into real life economy a slow gradual pickup overall and small setbacks here and there but together not enough to derail the recovery. As we move along we become more experienced and adapt better and push the recovery faster.
Perhaps someone will reflect more on the Volatility term structure and its implications, as this is not an area (VIX) that I have studied much.
That’s an interesting site. What I’ve found useful is Medved trader. It charts about anything you want and indexes and stocks are real time with free data from Yahoo. Both daily (or longer) and intra day. It only costs $20 a month if you keep using it. It also backfills data if you start a new chart or don’t start it right away in the morning. It also has quite a few generic indicators but the best part are the fib line options and the multiple comparative indexes you can put on a chart. It also shows news headlines (late of course) and has a quote screen that charts what you have there with a click.
It is the best deal for the money for realtime charting I’ve ever seen. Works great for what I do.
Thanks.
One thing though is that it isn’t very intuitive. It takes a while to get everything the way you want it. I even had to visit their forum to find out how to change a couple things.
One bear market (within the context of a secular bull) that isn’t often studied is the Summer of ’98. I was mainly trading AMAT at the time. If the Winter of 2020 ultimately crashes and recovers as quickly, then what’s missing right now is the level of despair I recall experiencing back then. I almost capitulated on the stock in October ’98 – several of my colleagues did – after which the price promptly doubled over the next six months.
I think we had a great deal of fear/anxiety in March. A durable low might require an extended period of despair.
Cam, I feel there is something missing in our analysis of the markets and that is how the Fed action and Congressional stimulus are affecting prices. I think we can agree that Fed and Congressional action are what has kept the economy from imploding and the market from making disastrous new lows.
Here is what we are missing – an analysis of Fed and government money that is finding its way into the market to hold it up. And how does that money compare to previous actions by the Fed and Congress to support the economy and the markets. In other words, how much action historically has keep markets from falling and historically has the market ever been able to buck the Fed.
I know some of this Fed and government action is pretty much unprecedented by but has history ever told us that we should fight the Fed and sell the market in the face of monetary stimulus?
Wally,
1. Bear markets usually do not end so quickly (time factor). Let us pay attention to the looming earnings recession (Earnings factor). We are still awaiting the numbers, starting with AWS on Thursday (see Cam’s comments last post).
2. I do not think we have seen portfolio liquidations from mom and pop investors that usually accompany bear market bottoms (Sentiment or fear factor).
3. Dazzling countertrend rallies are common in a bear market, and so far that is what we may have on hand based on what Cam has written today, and recently. Waiting for a confirmation may be too late.
4. Finally, we have no clue if we get a second Corona wave. We are still far far away from vaccines and treatments (I am talking years here).
5. US government is presuming a “Pandemic light” scenario; what if that is not true?
6. Is the market cheap for long term, durable bottom at PE ratio of 19 for 2020?
Wally,
1. Bear markets usually do not end so quickly (time factor). Let us pay attention to the looming earnings recession (Earnings factor). We are still awaiting the numbers, starting with AWS on Thursday (see Cam’s comments last post).
2. I do not think we have seen portfolio liquidations from mom and pop investors that usually accompany bear market bottoms (Sentiment or fear factor).
3. Dazzling countertrend rallies are common in a bear market, and so far that is what we may have on hand based on what Cam has written today, and recently. Waiting for a confirmation may be too late.
4. Finally, we have no clue if we get a second Corona wave. We are still far far away from vaccines and treatments (I am talking years here).
5. US government is presuming a “Pandemic light” scenario; what if that is not true? That is what I am watching on CNN (Austan Goolsbee), that come early summer, the virus backs off (!).
6. Is the market cheap for long term, durable bottom at PE ratio of 19 for 2020?
7. Fed stimulus takes time to work (yes, it eventually does). After Lehman bankruptcy circa fall of 2008, it took till March 2009 and significant percentage decline (20-25%) thereafter for a bottom.
8. Despite some bullish factors, despite a steep countertrend rally, equal weighted indices are not reflecting that. Cam and Ken have not bought my arguments for a bullish case (Lol).
Thanks, D.V. You are always a virtual fountain of information.
You are very kind Wally. Thanks.
There are no simple answers, but here is a quick-and-dirty yardstick. If you are fighting the Fed, you are long USD and short EM.
How are USD and EM doing?
Cam, are you talking about EM currencies or markets? If currencies, I’ll have to find me an index basket to watch.
Both. For EM currencies, take a look at CEW. For EM equities, take a look at the EEM to ACWI ratio.
Also keep an eye on FM (frontier markets, high beta EM) to ACWI ratio.
And EMB to IEF ratio (EM bonds to duration-adjusted UST price ratio).
Great! Thanks, Cam.
Wally’s question can even be widened. A trillion dollars is a lot of money, and the only way of finding money like that is to print it. According to Ray Dalio this will lead to inflationary debt devaluation. (Debtors fail, creditors eat inflation-induced losses, real estate is liquidated, etc.)
We therefore need to consider whether we have given enough weight to the limited alternatives of investing in stocks. This piece by Ray Dalio is long but instructive and seemingly relevant: (https://www.linkedin.com/pulse/money-credit-debt-ray-dalio/?published=t).
So, what is the Ray Dalio’s conclusion? He talks about change of world order. To what new order are we going to change to?
He has been saying this for a while now.
Louis, I read most of the highlited parts of Dalio’s explanation. I’m not sure Dalio explained the concept of printing money satisfactorily. The government can either borrow money to finance things like the stimulus Congress passed or it can print the money. In the last few decades they have chosen to borrow the money by selling treasuries. This is much less inflationary than just printing the money. The Fed prints money when they expand their balance sheet. The premise is that they plan to pull that money back from the banks eventually so it isn’t inflationary in the long run. As long as the people believe we can borrow money and the Fed can pull back the money they print then inflation shouldn’t become a problem. If the public loses faith in that ability then inflation expands and may destroy the currency. Think Zimbabwe. Of course, there are other problems given our debt and deficits that could rear their ugly heads.
Interestingly, we used to tie our currency to Gold at $35 an ounce. One could convert our currency into gold at the treasury at that price. The idea was to control currency inflation. Unfortunate, the government printed more money than we had gold to back it. France’s De Gaul figured this out and started cashing in his dollars for gold. That’s when Nixon broke the link between the dollar and gold and we started having bouts of inflation like the 70’s. I think that is about the time the government decided not to print more money but to borrow it instead.
Of course, money can be created by borrowing at banks. Long story short, the Fed controls this with interest rates and reserve requirements.
Yes, De Gaulle took advantage of the apparent USD weakness to accumulate gold reserves for the Banque de France. But did that do much for the French economy throughout the 70’s?
Did it make France a superpower, or dominate global finance?
Oh…never mind.
LOL!
Wally, you have the broad picture, but here are some quibbles: Yes, the Fed ‘prints money’ and as a reflection its balance sheet expands (with liabilities, by book entries). When the Fed buys bonds etc. in QE from the banks, it is supplying liquidity and targeting other aims for the benefit of the economy. The Treasury similarly obtains money from the Fed for the stimulus. Stimulus money can ultimately be removed by taxation (see MMT), but Trump is not going to ever do that, and the new money will debase the currency, although inflation will develop slowly. MMT says the money doesn’t even have to be returned, except for the inflation angle. (Money printing is never admitted or spoken about in those terms, to avoid alarming everybody, and there is the slippery slope consideration.)
Do not dismiss Dalio lightly – if you have the stamina, read Principles for Navigating Big Debt Crises.
FED actions come in two types, the small raising and lowering of FED Funds rates to nudge the economy and then there are the huge operations when the small adjustments don’t work. It’s never good to fight the big moves. They always turned the economy around. The latter usually happen after a few small nudging moves. Nowadays FED rates are so low going into this recession, that they can’t drop rates hugely so they are bringing out QE and helicopter money. This has never been tried. Plus it’s happening BEFORE the recession is experienced by investors. Hence the market is only down a little. Investors are blind to the damage that the FED foresees and only see the medicine.
This is all so unprecedented that I expect old rules of thumb are risky to employ.
So, your conclusions are to raise cash and sell equities?
Yes.
Cam – I liked that you discussed of odds of different scenarios in this post. That is very helpful from portfolio management perspective. I hope you’ll include that in your future posts.
Thank you!
Just take those probabilities with a grain of salt. They are only guestimates.
Understood. It still provides more clarity to your thinking.
Agree!
A good thread on USD.
The Dollar Wrecking Ball:
https://twitter.com/RaoulGMI/status/1254110879479746562
Mr Brandt expects USD to rally 15%. That’ll hurt emerging markets.
https://twitter.com/PeterLBrandt/status/1254172507764121602
Sanjay
A 15% strengthening in the US $ will be massively bearish for all asset classes, including gold. At a minimum, it will indicate a ($) liquidity squeeze. It will propel the US $ to historical highs. The Fed has kept the printing presses running and so far no liquidity squeeze ($ shortages). It will be accompanied by all kind of bankruptcies, if it happens.
We have discussed this on this platform, but not lately.
Thanks for bringing this to the attention of this group.
Yes, I see the coil pattern breaking upwards. This is not good (we are still below the previous high of 103 on the $ index based on the long term coil).
Will check the CCC and BBB St. Louis Fed market action.
https://fred.stlouisfed.org/series/BAMLH0A3HYC
https://fred.stlouisfed.org/series/BAMLC0A4CBBB
A $ rally does put the chill up my spine. I have not been paying attention.
What we have seen lately is that events that will obviously cause economic problems during this crisis atmosphere and are being dealt with by the FED or Congress in brand new ways. These folks see the wreck coming and change course. It’s the aftermath of unintended consequences from these experimental moves that will hurt when the panic is behind us.
In support of Ravindra’s view re the decision to reopen the economy sooner rather than later:
https://thehill.com/opinion/healthcare/494034-the-data-are-in-stop-the-panic-and-end-the-total-isolation
https://www.youtube.com/watch?v=xfLVxx_lBLU&feature=youtu.be
https://www.bloomberg.com/news/articles/2020-04-26/citigroup-s-elevator-quandary-shows-struggle-to-reopen-offices?sref=czMsybAf
It has to start. If you let egghead experts make the final call, we will all be dead. If you claim this is fighting a war, then you need to accept that victory is never 100% clean. Even when American soldiers and De Gaulle were parading down Champs-Élysées, snipers were still trying to take him out and cause chaos among troops.
Our problem in today’s society is trying to be perfect, setting goal at 100%. An analogy is quest for equality. It is a noble goal and we should be striving to achieve as much as possible. But 100%? Look at how twisted our society becomes today.
Going back to reopening. A lot of caution is warranted and we need healthcare professionals’ help. But a thorough review process is mandatory as we adjust and go forward.
The old Utopian Society on Earth. LOL Maybe by 1984 – Oh wait…..what year is this?
The problem with announcing reopening is that it gives people the impression that social distancing and exercising precautions are no longer needed.
Already seeing many examples in my locale of people not wearing masks or practicing social distancing.
In my city, I think a second wave may be inevitable.
An interesting story about how San Francisco handled the 1918 Spanish Flu and what happened.
https://www.nbcnews.com/politics/politics-news/san-francisco-had-1918-flu-under-control-then-it-lifted-n1191141
Curious about Ed Yardeni’s take. He is suggesting the Fed’s actions will limit any downside in S&P and that the low is in. Projected 2900 SPX this year, 3500 2021. I generally like Yardeni’s perspectives but wondering is this a permabull stance?
Cam, great analysis as always! Many subscribers here also had so many excellent inputs and insights. You guys are awesome.
On a side note I checked Singapore’s average temperature with US’ average temperature during summer which is 87 F. Singapore has a stable annual temperature of around 85-88 F. Not implying anything just saying.
So why is this not a “survival of the fittest” market? FT reported last week that Netflix was able to obtain relatively low-yields in credit markets, while European companies like Adidas or Daimler had to pay higher rates because US banks were getting less eager to lend to them. The large US technology companies are the prime winners of the current environment as they are benefitting from the central-bank credit market “backstops” and can lend at very low rates to fund additional investments and/or shareholder returns in the future.
Cam, is there specific level or some important indicators that you’re looking at now that will change your inner trader to neutral or bullish? Just trying to define my risk with my short trade. Thanks.
Yes. If the S&P 500, DJIA, and NYSE Composite all breach their 50 dma, that’s a signal to step aside.
It would appear we are almost there if I understand your comment correctly, Cam. You also posted earlier that only a vaccine would mitigate your SPX probability of a second downleg to 2000 +/-.
Does your analysis still support a retest ofthe March lows or are you moving away from that scenario?
From a fundamental and valuation perspective, it is difficult to see how we could avoid a retest of the lows in the absence of a medical breakthrough. The only question is what happens in the short run.
“Step aside”?
Are you implying if the market breaches 50 DMA to the upside, then give up on the bearish stance or sell into strength?
Cam, can we draw analogy with 1918 pandemic? The market also fell about 35%, but bounced back. There was no retest. How is the market different today vs. 1918, beyond the obvious stuff? Have you considered this analysis?
https://www.marketwatch.com/story/market-behavior-a-century-ago-suggests-the-worst-could-be-over-for-stocks-if-not-for-the-coronavirus-pandemic-2020-03-19
It depends on your time horizon. Using the 1918 analogy may be useful from a trader’s perspective.
From an investor’s viewpoint, do you think that buying the S&P 500 at 19x forward P/E, with the E falling rapidly, is a good idea?
Before you ask, Urban Carmel showed that there is no discernible relationship between rates and valuation.
http://fat-pitch.blogspot.com/2014/11/are-low-rates-responsible-for-high.html
Thanks Cam for pointing this out. Urban Carmel has done a huge favor to the investing community by publishing his research online. I would recommend his entire blog to my fellow members.