I suppose I should be used to it by now. Last week’s initial jobless claims spiked to 6.6 million, and the March headline Non-Farm Payroll printed at a dismal -701K. The unemployment rate would have been even worse had the participation rate not fallen and depressed the size of the labor force. My desk has been flooded with bear porn.
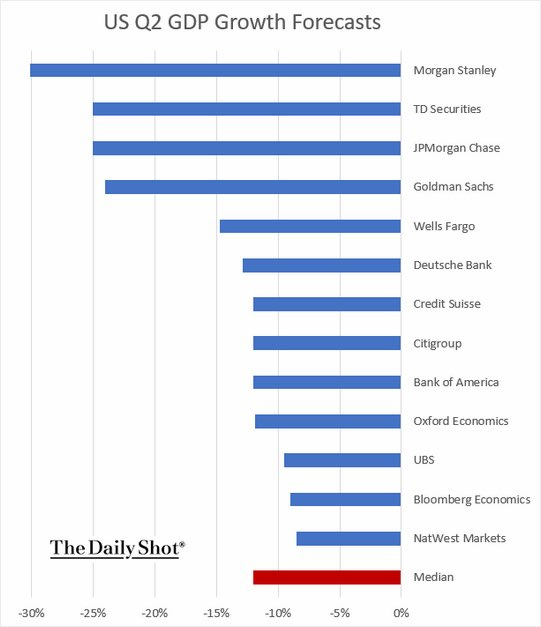
Wall Street economists are racing to downgrade their Q2 GDP growth forecasts. Among many, Goldman Sachs last week reduced their already downbeat forecast to an annualized -34% from -24%, and unemployment to reach an astounding 15%.
Even more astonishing is the latest White House announced goal of reducing the number of COVID-19 deaths to a range of 100,000 to 240,000.

Rather than just wallow in more unnecessary bearishness, a more useful exercise is to consider how the economy might evolve from BC (Before Coronavirus) to AD (After the Disease). What will the recovery look like? There is a wide continuum of recovery shapes from V to L.
Unemployment at 32.1%?
While the 6.6 million in initial jobless claims translates to an unemployment rate of roughly 10%. unemployment is likely to be headed into the teens. However, I did not expect St. Louis Fed economist Miguel Faria-e-Castro to pen a “back of the envelope” Q2 unemployment estate of 32.1%.
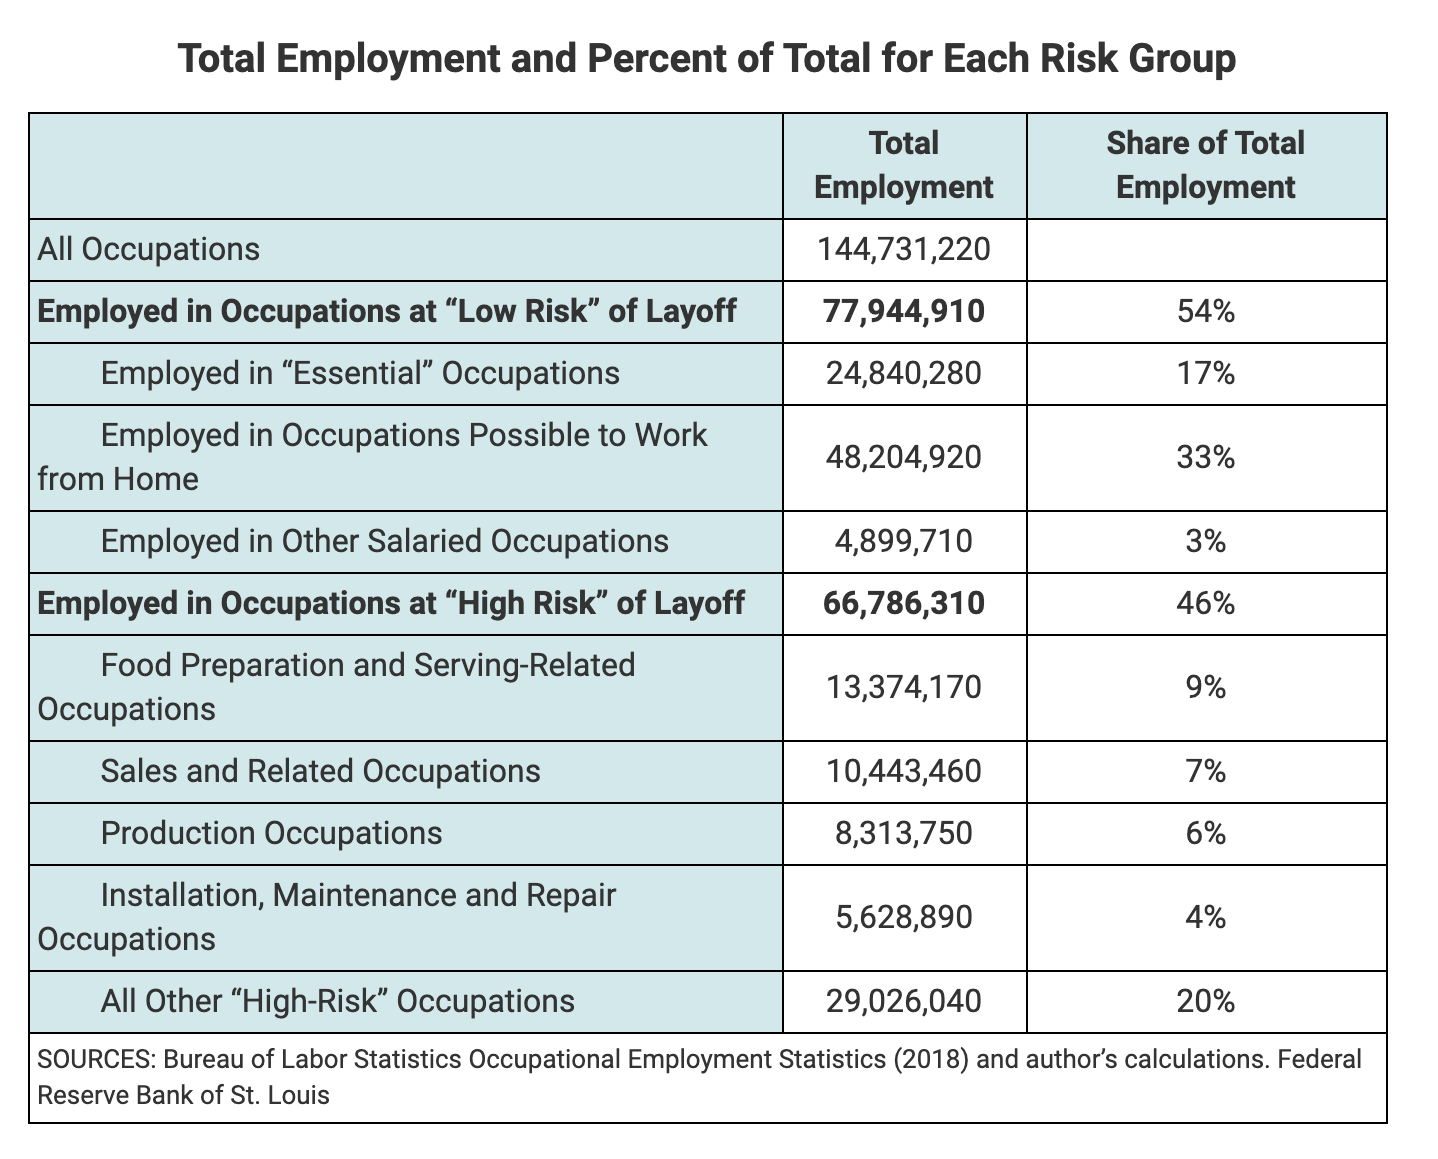
The estimate comes from two sources. The first is from a blog post from St. Louis Fed economist Charles Gascon, who identified 66.7 million workers in “high risk occupations” that are most exposed to layoffs.
“In another recent blog post, Matthew Famiglietti, Fernando Leibovici and Ana Maria Santacreu combined individual-level data from the 2017 American Community Survey with information on occupational contact intensity from O*NET to determine how many people work in occupations that require the worker to perform tasks in close physical proximity to other people.” Their estimate came to 27.3 million workers.

Miguel Faria-e-Castro then arrived at his estimate by averaging the figures from the two papers, and arrived at a potential unemployment rate of 32.1%. This simple “back of the envelope” exercise just shows how bad the COVID-19 disruptions can become.
Length matters more than depth
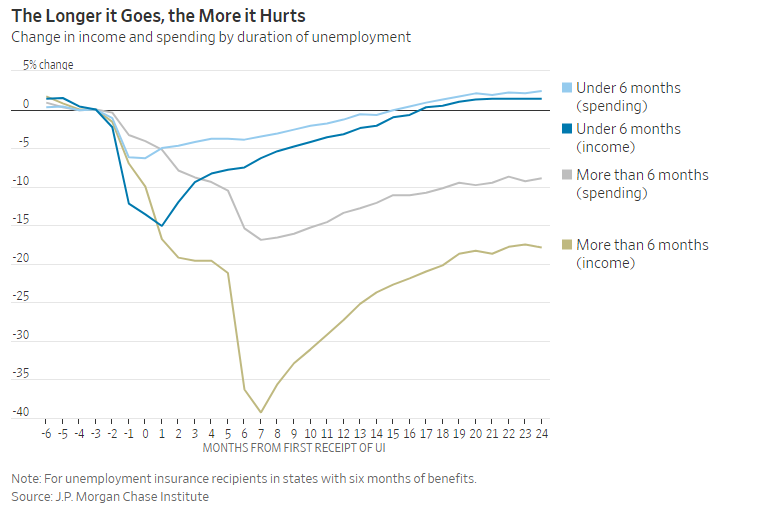
While Wall Street economists and strategists have busily modeled the depth of the recession, I would argue that it is the length of the downturn that matters much more to investors.
Greg Ip at the WSJ made that precise point in a recent article. The longer it goes, the more it hurts.
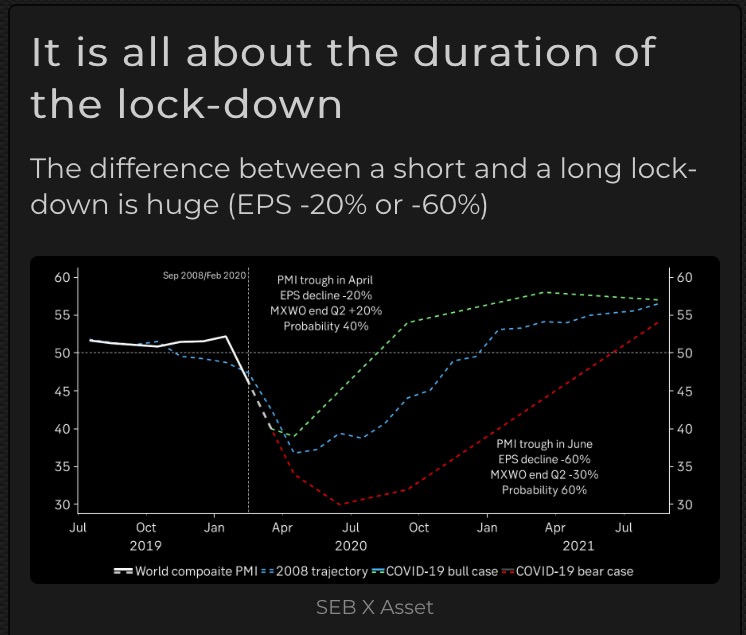
SEB-X modeled the EPS impact of a short and long lockdown, and the difference is enormous. The gulf between a two-month difference in PMI trough changes EPS growth from -20% to -60%.
Under these circumstances, the key questions for investors are how long before the economy troughs, and what’s the shape of the rebound?
A continuum of outcomes between V and L
McKinsey recently modeled a matrix of economic recovery scenarios based on two factors, the effectiveness and knock-on effects of fiscal and monetary policy (x-axis), and the virus spread and the effectiveness of the public health response (y-axis), Each outcome led to a different shape of economic recovery. This framework does offer a useful framework for thinking about how the US and global economy might emerge from this crisis.

Pandemic history lessons
While G7 fiscal and monetary authorities have uniformly gone all-in in their own fashion to combat the economic effects of the recession, the public health response have varied, and some lessons from history may be useful for investors.
A New York Fed study of the Spanish Flu found that, contrary to popular belief, there is no trade-off between non-pharmaceutical intervention (NPI) measures such as social distancing and economic growth.

With respect to the economic effects of the pandemic, we find that more severely affected areas experienced a relative decline in manufacturing employment, manufacturing output, bank assets, and durable goods consumption. Our regression estimates imply that the 1918 Flu Pandemic led to an 18 percent reduction in manufacturing output for a state at the mean level of exposure. Exposed areas also saw a rise in bank charge-offs, reflecting an increase in business and household defaults. These patterns are consistent with the notion that pandemics depress economic activity through reductions in both supply and demand (Eichenbaum et al. 2020). Importantly, the declines in all outcomes were persistent, and more affected areas remained depressed relative to less exposed areas from 1919 through 1923.
In fact, NPI measures helped growth, not hurt.
Comparing cities by the speed and aggressiveness of NPIs, we find that early and forceful NPIs did not worsen the economic downturn. On the contrary, cities that intervened earlier and more aggressively experienced a relative increase in manufacturing employment, manufacturing output, and bank assets in 1919, after the end of the pandemic.
Our regression estimates suggest that the effects were economically sizable. Reacting ten days earlier to the arrival of the pandemic in a given city increased manufacturing employment by around 5 percent in the post-pandemic period. Likewise, implementing NPIs for an additional fifty days increased manufacturing employment by 6.5 percent after the pandemic.
The study made parallels to the modern era. The positive effects of NPI acted to avoid the tail-risk of severe growth crash effects of a uncontrolled pandemic running through the population.
Anecdotal evidence suggests that our results have parallels in the COVID-19 outbreak. Governments that implemented NPIs swiftly, such as those in Taiwan and Singapore, have not only limited infection growth; they also appear to have mitigated the worst economic disruption caused by the pandemic. For example, economist Danny Quah notes that Singapore’s management of COVID-19 has avoided major disruptions to economic activity without leading to a sharp increase in infections through the use of forceful, early interventions. Therefore, well-calibrated, early, and forceful NPIs should not be seen as having major economic costs in a pandemic.
A Bloomberg article summarizing the economic effects of the Black Death during the second half of the 14th Century documented a period of economic upheaval. As the epidemic killed off roughly 60% of Europe’s population, it was no surprise that real wages rose afterwards.

Rising wages sparked a consumption boom.
The change in behavior was more stark. “The Black Death created not just the means for wider parts of the population for excessive consumption – but the traumatizing experience of sudden decimation in the earthly life also triggered the impetus to enjoy it to the fullest, while still able to,” Schmelzing notes.
Products that hadn’t been for mass consumption earlier — such as linen underwear and glass panes in windows — became more widely available as cheap capital rushed to satiate the growing desire to consume, according to “Freedom and Growth,” historian Stephan Epstein’s review of states and markets in Europe between 1300 and 1750. Sumptuary laws that, among other things, sought to limit the height of Venetian women’s platform shoes were the state’s way to rein in conspicuous consumption; eventually the mad spending ended and savings went to bond markets. A republican ethos was born.

Today’s governments have enacted extensive income and wage supports to buttress their economies against collapse, but history has shown that such deficits have not been followed by rising cost of debt. In fact, real rates fell.
The borrowing costs for large monarchies fell to 8% to 10% by the early 16th century from 20% to 30% before the Black Death, according to Epstein. Florence, Venice and Genoa as well as cities in Germany and Holland saw rates slump to 4% from 15%. Surprisingly, the drops coincided with large increases in sovereign debt to boost military preparedness.
A recent study of economic history by Jorda, Singh, and Taylor found a similar effect of falling real interest rates after pandemic episodes. This paper examined the history of 12 pandemics that experienced at least 100,000 deaths.

There was a significant decline in real rates 20 years after the event, though the magnitude of the effect varied by country.

Not surprisingly, real wages rose after pandemics because of a shift in the labor to capital ratio.

The key conclusion is, expect low rates to persist to as far as the eye can see, with the caveat that these historical studies occurred when hardly anyone survived to old age:
If the trends play out similarly in the wake of COVID-19—adjusted to the scale of this pandemic—the global economic trajectory will be very different than was expected only a few weeks ago. If low real interest rates are sustained for decades they will provide welcome fiscal space for governments to mitigate the consequences of the pandemic. The major caveat is that past pandemics occurred at time when virtually no members of society survived to old age. The Black Death and other plagues hit populations with the great mass of the age pyramid below 60, so this time may be different.
These studies also imply that, for long-term investment planning purposes, there will be shifts in inequality as returns to labor will rise and returns to capital will fall. Bond yields will stay low, and the equity risk premium is likely to compress.
A difficult 2020
From a tactical perspective, my base case scenario calls for a difficult 2020, and perhaps 2021 for the global economy, and equity returns. Using the McKinsey framework, we simply have no idea of the nature of the virus spread, nor the effectiveness of the public health policy response. However, we can make some educated guesses based on the path set by China and other Asian economies.
I would expect that the mitigation strategies adopted by the industrialized countries in Europe and North America to be largely successful in bending and flattening the curve in April and May. As the northern hemisphere enters summer, there is some evidence that heat will retard the progress of the virus. We should see some confirmation of that effect as the southern hemisphere enters their fall and winter seasons. South Africa is already in lockdown. I am monitoring South America to see if the pandemic flares up, and if there is an echo spike in cases in Australia and New Zealand. If so, expect a second peak in the northern hemisphere later this year, which will change the shape of the economic recovery from a V to a W.

Investors are also well advised to watch China based on the first in-first out principle. Since China was the first to be afflicted with this pandemic, the evolution of its growth pattern will offer clues about the future of the economies of the West. China is slowly returning to work, and both the hard data and anecdotal evidence suggests that the economy is only operating at 60-70% of pre-pandemic capacity, and not all is well with the consumer.
As well, Wuhan re-imposed its lockdown after a brief period of relaxation, which indicates that the infection is not fully under control. Nearby Singapore announced late last week that it was tripping coronavirus “circuit breakers” by closing schools and essential workplaces after briefly relaxing its social distancing edicts.
The analysis of Hong Kong’s February retail sales offers some clues. Spending was concentrated on food, supermarkets, and fuel, while virtually all other categories tanked.

Bloomberg has reported that a global consumer default wave may be starting in China.
The early indicators from China aren’t pretty. Overdue credit-card debt swelled last month by about 50% from a year earlier, according to executives at two banks who asked not to be named discussing internal figures. Qudian Inc., a Beijing-based online lender, said its delinquency ratio jumped to 20% in February from 13% at the end of last year. China Merchants Bank Co., one of the country’s biggest providers of consumer credit, said this month that it “pressed the pause button” on its credit-card business after a “significant” increase in past-due loans. An estimated 8 million people in China lost their jobs in February.
“These issues in China are a preview of what we should expect throughout the world,” said Martin Chorzempa, a research fellow at the Peterson Institute for International Economics in Washington.
A “square root” recovery
Even if the lockdowns in Europe and North America were to be successful over the next two months, the consumption pattern from China and Hong Kong leads me to believe the recovery will sputter. While some consumer spending will revive, households are likely to be focused on repairing their balance sheets rather than splurging on restaurants, leisure, and travel. As well, many small businesses will have either failed, or be near failure, and will require additional support. In the US, state budgets are already under severe stress and will also need federal aid.
Investors should monitor the evolution of earnings estimates, especially for Q3, Q4, and into 2021. If the Street is expecting a V-shaped revival, it faces the risk of disappointment. In that case, watch for a market rebound in the coming months, followed by a retest of the old lows, and quite possibly lower lows if further fiscal stimulus is believed to be insufficient.
In summary, there are many moving parts to my forecast, which depend on the nature of the virus spread, and the effectiveness of public health policy.
- A relief equity rally to begin in the next 1-2 months on the expectation that governments have “flattened the curve”.
- An anemic rebound by the household sector, dragged down by SME failures, and rising defaults.
- A second leg down in stock prices, sparked by a possible fall and winter spike in infections, and the evidence of an anemic recovery.
- Further announcements of fiscal support. Governments will have to spend until it hurts, and then spend even more.
This is a recessionary bear market. Recessionary bear markets take more time to resolve than anyone expects. Fed watcher Tim Duy characterized the shape of the likely recovery best as a “square root” in a Bloomberg Op-Ed, in which he lamented that hiring freezes will exacerbate the downturn just as employment tanks.
Assuming virus-related concerns will persist over the next year or longer, we might expect a “square root” type of recovery. After an initial jump of hiring that follows the first phase of recovery begins, a less-than-full resumption of activity and uncertainty about future shutdowns threaten to restrain the pace of hiring long into the future;
It’s not a V or L recovery, but a square root. Richard Nixon famously said that “we are all Keynesians now”. In this crisis, we are all geeks and nerds now.
Please stay tuned for our trading commentary, which is scheduled to be published tomorrow.
Cam – can you explain what a √ recovery looks like? Not sure I understand, especially in relation to the nine McKinsey & Company scenarios you showed above. Thanks
To quote Tim Duy:
“After an initial jump of hiring that follows the first phase of recovery begins, a less-than-full resumption of activity and uncertainty about future shutdowns threaten to restrain the pace of hiring long into the future;”
I think Tim Duy meant the (new) hiring to look like a square root (an initial jump of hiring and then flat). He unfortunately equated to the economic recovery but that need not be the same.
The economy recovery may follow a different route than hiring.
The statement with the most impact in terms of implications might be ‘Wuhan re-imposed its lockdown after a brief period of relaxation.’ It tells that a complete end to social distancing won’t be in place until we have a vaccine.
I don’t know what you can believe coming out of China about Wuhan. Some are saying the slowdown never happened and there have been 42,000 deaths in Wuhan alone so far.
Cam, would you expect the market to now prepare the bottom for the recovery you are talking of 1-2 months ? Since Q1 earnings are starting and US are just at the beginning of the lockdown/contamination, I would that is kind of hard to see a risk on market just now…
I address a lot of these issues when I discuss valuation tomorrow. Please stay tuned.