Mid-week market update: After yesterday’s downdraft and red candle, the bears must be disappointed that there was no downside follow through. Yesterday’s pullback halted at support, which was a relief for the bulls, but I would warn that the current environment is very choppy, and traders should not depend on price trends to continue.
At a minimum, the bulls should not press their bullish bets.
Normalizing from panic
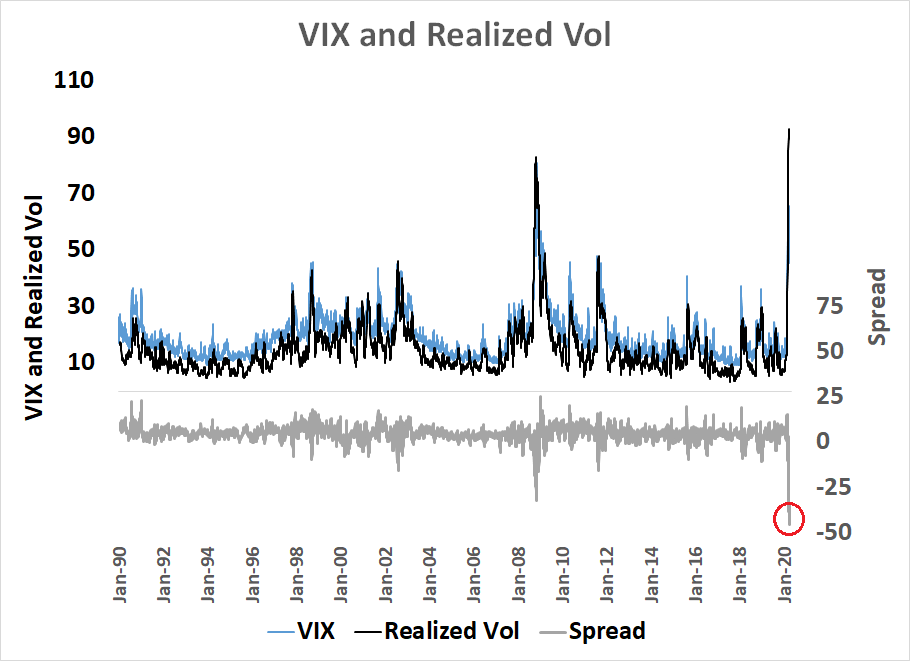
The current environment can be characterized as a normalization from blind panic. This chart of the spread between the VIX Index and realized 30-day volatility tells the story. In normal times, VIX trades at a slight premium to realized vol, but we are now seeing an off-the-charts spread between the two. The last episode of such a large spread occurred during the bear market of 2008, when market fear levels receded after the initial shock of the crisis.
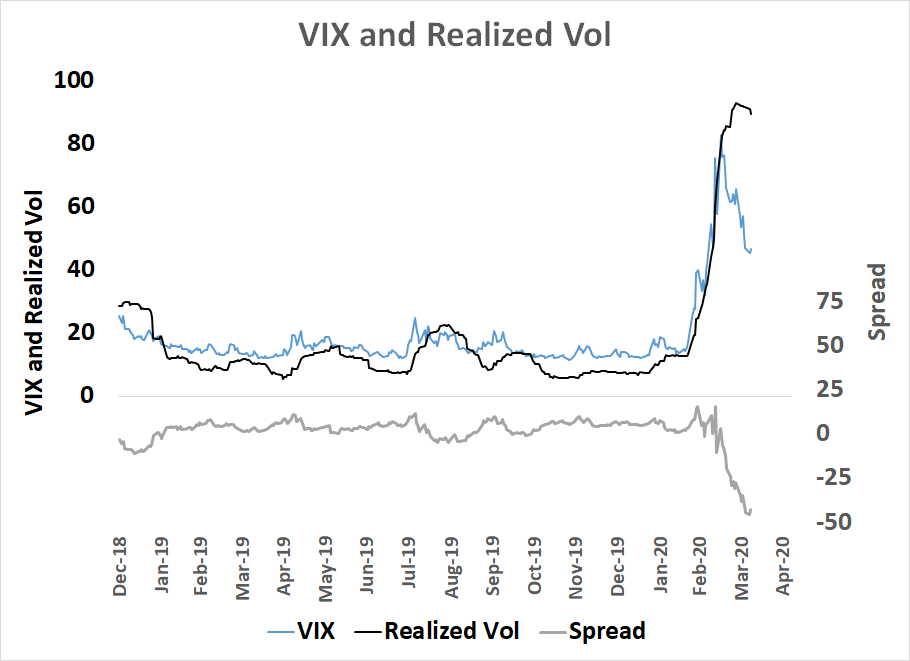
Here is a close-up look. Both realized and implied volatility are rolling over, but implied volatility (VIX) is falling faster than historic realized volatility.
The analysis of other market based volatility indicators tell a similar story. The top panels show that both VIX and TYVIX, which measures bond market volatility, are falling. As well, VXN, which measures NASDAQ volatility, usually trades above VIX because of the riskier nature of NASDAQ stocks, recently fell to a discount to VIX, indicating that VIX may be trading too high and needs to fall further, which is equity bullish.
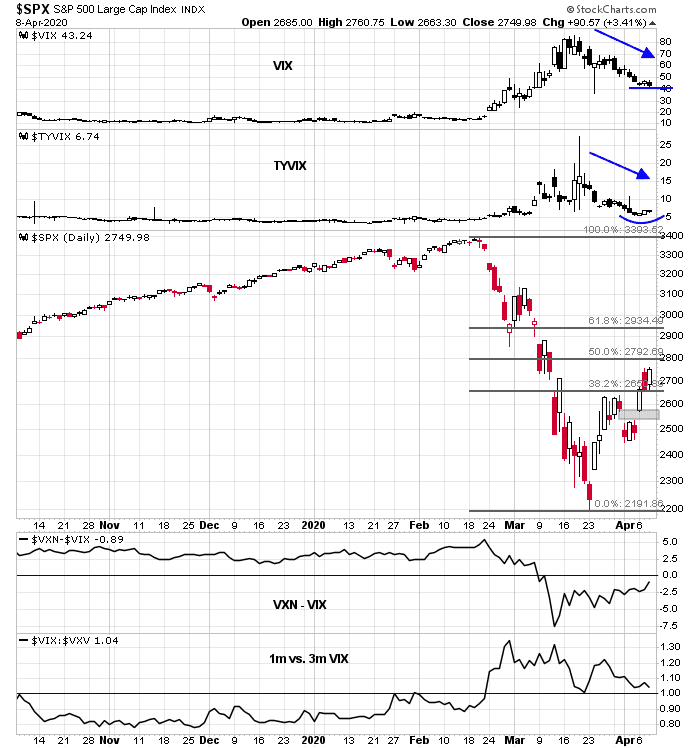
The bears can argue that both VIX and TYVIX seem to be finding a floor. Moreover, the term structure of the VIX (bottom panel) remains inverted, indicating elevated fear levels.
A look back at 2008 yields some clues on how to navigate the current environment of normalization from a panic. While I could not discern any signals from the behavior of VIX and TYVIX during that period, the combination of VXN-VIX and VIX term structure were more interesting. The shaded areas show periods when then VXN-VIX spread was negative, indicating elevated fear levels. During these episodes, rising VIX-VXV spreads, which indicated strong inversions of the VIX term structure, were equity bearish. The two occasions when the the VXN-VIX spread normalized back to positive were equity bullish.
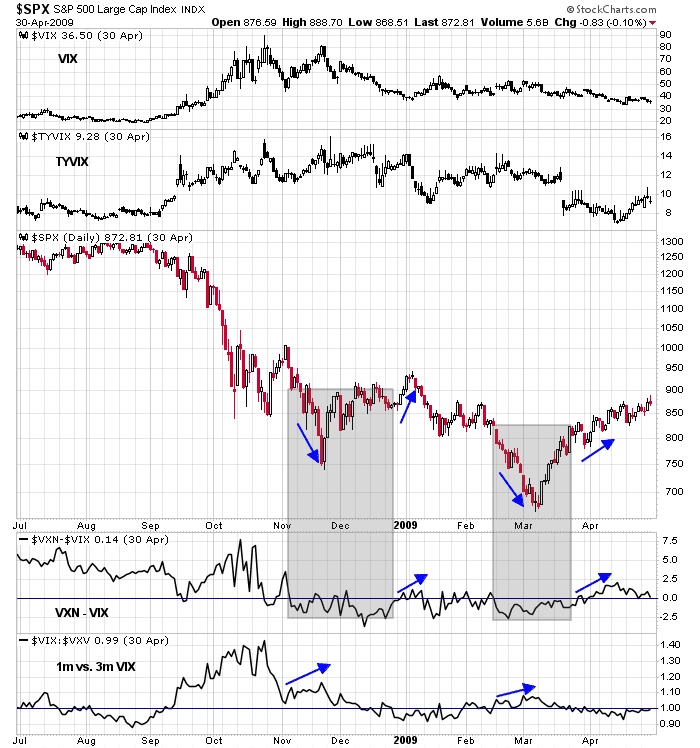
Neither of those signals are in play today.
Playing the odds
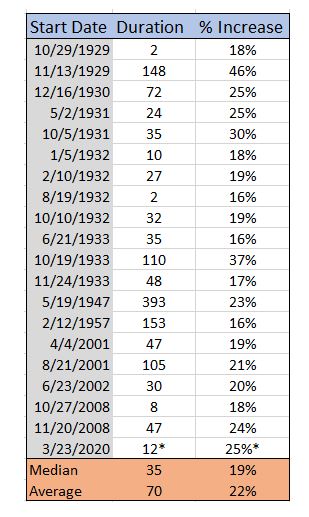
From a tactical perspective, here are a couple of reasons why you shouldn’t press your long bets, even if your are bullish. First, Alex Barrow at Macro Ops compiled a list of past bear market rallies and found that “median bear market rally lasted 35 days and rose 19%”. The latest rally lasted 12 days (as of yesterday’s close) and the market is up 25%. While there is wide dispersion in the historical results, this study study suggests that the current bear market rally is living on borrowed time.
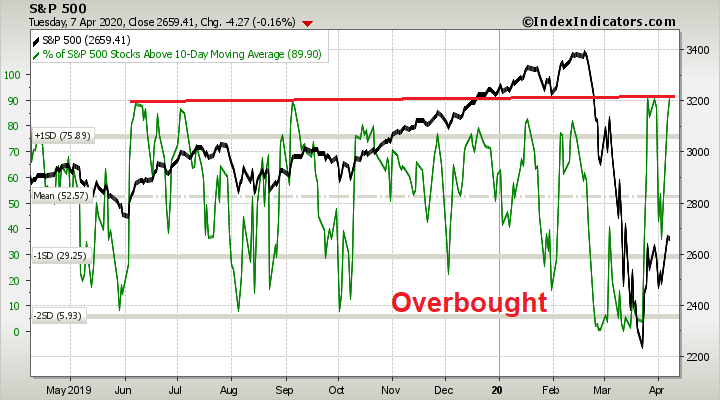
short-term breadth is already overbought, based on Tuesday’s night’s close. While overbought markets can become more overbought, do you really want to play those odds?
The S&P 500 is nearing resistance at its 50% retracement level of 2780. What’s the short-term upside potential in light of these overbought conditions?
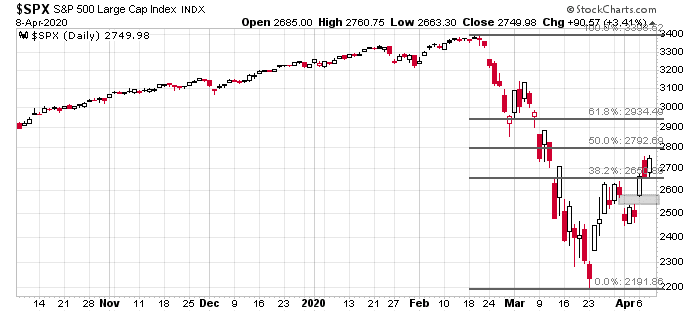
The NASDAQ 100 tested that level yesterday, and stalled.

My inner investor is at his maximum defensive position. If he had not been, he would be taking advantage of this rally to lighten up on his equity positions. My inner trader believes that the short-term risk/reward is tilted to the downside, and he is holding on to his short position.
Disclosure: Long SPXU
They are saying Russia and the Saudis are close to a deal to cut oil output leading to a rise in oil prices and the resulting rally. And Bernie Sanders concession speech was the excuse for the late day surge. I’m still holding my short trading position but the pain is excruciating.
Another possible catalyst for more upside would be an agreement by EU politicians on how to handle the rising sovereign debts. It seems wall street does not want to repeat the mistakes of late 2018 and during the lows of the trade-war. The reaction to the jobless claims and employment reports last week (or better the lack of a real negative reaction) however should have been a warning. What the early days of this week had in common was a lack of real meaningful economic data, this is going to change on Thursday with another jobless claims report coming up and more meaningful data from China and the US next week.
Thank you for the update, Cam. I’m comfortable being partially short here, for the reasons you describe. My nagging doubt, however, is that the one rule I never get right is “don’t fight the Fed” (or occasionally, “the PBOC”) and my worry is that this rally is one of those liquidity fueled events that don’t stop for the likes of overbought breadth or overhead resistance levels. We shall see.
A little quick analysis is telling me that if we break above Monday’s highs we might see another 1500 Dow points or 150 S&P 500 points to the upside. I’ll exit my shorts if we make that break and look for a better entry point. A slew of weak earnings reports could help stall the rally in addition to tomorrow’s Initial Claims.
“Mind-boggling. .. I absolutely think this could be the best treatment we have for the next few months.” – Aaron Tobian, pathologist at Johns Hopkins
https://hub.jhu.edu/2020/04/08/arturo-casadevall-blood-sera-profile/
Purely from a common sense perspective:
(a) There will be major downward revisions in earnings and earnings estimates. The shortfall will continue for longer than most companies and analysts are now able (or willing) to visualize.
(b) Sheltering in place and/or social distancing will continue far longer than a few weeks, and in fact much of the behavior will persist for years.
(c) Life post-crisis will differ in unanticipated and unexpected ways – and the uncertainty will cause investors to place lower multiples on earnings.
All of the above will ultimately lead to far lower stock prices – but the lows are likely still weeks or even months away.
I think without herd immunity, it’s quite likely we will get 2nd-wave or even 3rd-wave scenarios once people go back to work.
Maybe that shock would lead to much lower stock prices.
Thanks for the update.
Feels like Ground Hog Day to me. Not Easter.
At resistance pre-market.
Opened a short position – no leverage this time at 2883.
Correction, 2783.
“Following this rally into a right shoulder high (2790 to 2950 zone), S&Ps could decline toward 1,500 to match the correction in 2018.”
https://twitter.com/PeterLBrandt/status/1248048058400727041
Interesting….
Noticed this quote in that link, Sanjay:
“David Tepper the greatest hedge fund manager of our time said he doesn’t understand this rally bc every company he talks to is going broke, the credit markets are a mess and unemployment is headed to 20%.”
I am nervous about tweet of Urban Carmel: https://twitter.com/ukarlewitz/status/1247981257197154304
NYSE UP VOLUME 2 DAYS – 90%
With consensus of retesting the low just about everywhere we read, we have to allow the possibilities of: bottom already in.
Reasons:
1. Fed balance sheet ballooning
2. Fed backstopping everything
3. Fed buying securities
4. New virus cases trending down
5. Most importantly, systematic algos releveraging given vol trending down
Even prior to Covid-19, investors were prepared for a pullback due to overvaluation – the bullish take was that earnings would surprise to the upside.
Now expectations for earnings have cratered, yet the SPX is off just -17% from its all-time high. That’s an example of what psychologists might refer to as cognitive dissonance.
The problem is markets are filled with illogical movements that go on longer than any of us anticipate. The SPX may in fact make its way down to 1500, but it won’t be an immediate move, and it’s likely to inflict maximum pain on both bulls and bears on the way down.
rxchen2, I think the rally comes down to the trillions in stimulus that is being pumped into the economy and markets. The Fed just announced an additional $2.3 trillion this morning. INHO I think this is the only reason we have recovered 50% of the decline. The question is, how long can they keep plucking that much money from the money tree?
I just read the Fed announcement, including all the pdfs. Am I reading this right? Fed is now providing the financing for the Treasury to buy:
1. Short term notes from States, Counties, and Cities.
2. Loans from small and mid size businesses.
3. Junk bonds if downgraded after March 22nd.
On top of these, the Fed is leveraging the Treasury equity at 10 to 1. Are we fighting the Fed now?
If you are still short, like I am, you are fighting the Fed. A foolish move?
Let’s all go to the window and shout, “I’m mad as Hell, and I’m not going to take it anymore!” LOL
To quote Keynes:
“Markets can remain irrational longer than you can remain solvent.”
Inflationary expectation is the new byword. The Fed’s action today changed the name of the game. None the less will hold shorts to EOD.
There’s an old adage that I have personally experienced more than once…….”not til the last short covers doth the bull surrender”. Alas!
All holding SPXU have greater intestinal fortitude than I do. Left at the beginning of the week – may regret it. At $17.80 might actually be a buy if we are now at an SPX high…
Mark Hulbert’s take-
https://www.marketwatch.com/story/stocks-will-revisit-their-coronavirus-crash-low-and-heres-when-to-expect-it-2020-04-09?siteid=bnbh
Good article, rx. Exactly what Cam has been telling us.
I had my finger on the button to cover my shorts at the breakout high at 12:30 CST but two of my intermarket indicators said the bull move didn’t look right so I held on. There is nothing more depressing than covering a short at the day’s high. Been there, done that.
https://www.cnbc.com/2020/04/09/fed-fires-an-even-bigger-bazooka-expands-its-shopping-list-to-include-junk-bonds.html
So, as we navigate these uncertain and choppy waters, we learn that the next asset class the US Fed is buying is junk bonds. What is more junkier than junk bonds are stocks. So the next question is when would the US Fed start buying stocks?
Let us be no ones fool and accept that the job of the US Fed (and other central banks) is to keep assets from falling too much and keep prices afloat.
https://www.marketwatch.com/story/heres-a-breakdown-of-the-feds-rescue-programs-to-keep-credit-flowing-during-the-pandemic-2020-03-20?mod=home-page
One more time of caution about holding 3x shorts longer than necessary: you will lose money even if spx is trending down. You are losing money even faster now when you are fighting the Fed. Even when spx is grinding up, you cannot make money in 3x shorts (even 1x shorts) unless you can have daily price multiplier consistently over 1.0. This only happens during extreme end of days scenario like past March. Other than that you are voiding math as a branch of science. Now vix is calming, 3x shorts should be high on your risk control list.
For current market movements, this is a replay of 2008-2009 except that Fed is more skillful this time. The goal is to keep markets floated and let economy catch up for as along as it takes. Back then Financials and REIT suffered near fatal blow. This time is about the same although Financials fared a little better. During GFC, as I remember, C and BAC dropped to one dollar range. Certain group of people make tons of money by buying very cheap out of money call options. Within a year BAC rose to $14. Sure their counter parties lost big time. This time around big money can be made in these two sectors as well, now that Fed has come to rescue.
One more point. When money base is expanded this dramatically like now every asset class (including stocks, but hard assets particularly) will be inflated proportionally. Look at gold. A lot of REITs will be really big winners coming out this crisis. They can reduce their interest expense to almost zero and can refi covenants at incredible low rates, plus asset inflation.
“Even when spx is grinding DOWN ….”
You make good points about not fighting the Feds. Your points about opportunities in the beaten down sectors are well taken. To your point here is what Nick Colas from Data Trek Research suggests buying at market bottom.
https://datatrekresearch.com/cyclical-recovery-what-works-best/
We’ve talked a lot about the 2008 Playbook in the last month to highlight how things can still go wrong for risk assets; today, let’s look at what worked best from 2009 – 2010, the initial period of recovery after the Financial Crisis.
First up: annual total returns for a variety of major asset classes:
2009:
MSCI Emerging Market Equities: +79.0%
US High Yield Corporate Bonds: +57.5%
MSCI EAFE (non-US developed economies): +32.5%
Russell 2000 Small Caps: +27.2%
S&P 500: +26.5%
US Investment Grade Corporate Bonds: +5.9%
2010:
Russell 2000 Small Caps: +26.9%
Emerging Market Equities: +19.2%
US High Yield Corporate Bonds: +15.2%
S&P 500: +15.1%
MSCI EAFE: +8.2%
US Investment Grade Bonds: +6.5%
Takeaway #1: a little incremental risk exposure can go a long way to boosting portfolio returns when markets finally turn higher. Even slight shifts in portfolios’ weightings in late 2008 to riskier asset classes like EM or even high yield bonds delivered dramatic results in 2009. And if you missed the 2009 moves, the same was still true in 2010.
Takeaway #2: asset classes feed off each other on the way up as much as the way down. For example, US Small Cap companies are often unprofitable so high yield corporate bond spreads are an important indicator of their access to/cost of capital. When high yield markets rallied in 2009 and spreads declined, this had a positive knock-on effect for small caps.
Takeaway #3: Crisis lows can make for some unexpectedly strong asset class returns in the subsequent upturn. In 2009, US High Yield Corporates beat every equity asset class except EM. In 2010, they bested the S&P 500 and EAFE equities. Not bad for a bond fund…
Next: S&P Large Cap Sector (only those that outperformed):
2009:
Technology: +61.7%
Materials: +48.6%
Consumer Discretionary: +41.3%
Real Estate: +27.1%
S&P 500: +26.5%
2010:
Real Estate: +32.3%
Consumer Discretionary: +27.7%
Industrials: +26.7%
Materials: +22.2%
Energy: +20.5%
Telecomm: +19.0%
Takeaway #1: most of these sectors are classic early-cycle groups (Discretionary and Materials especially so). Real Estate features prominently because of the declining interest rate environment in 2009 – 2010, of course.
Takeaway #2: Financials are usually the textbook early-cycle group, but the Financial Crisis and its aftermath meant this sector underperformed in 2009 (+17.2%), 2010 (+12.1%) and even during the Greek debt crisis in 2011 (-17.1%). The group did then finally outperform in 2012 (+28.8% vs +16.0%), 2013 (+35.6% vs. +32.4%) and 2014 (+15.2% vs. +13.7%), but that was out of its usual cyclical pattern.
Takeaway #3: the best single result listed above is Tech’s 62% return in 2009 as markets finally relaxed a bit and valuation multiples expanded, but… Keep in mind that Tech actually underperformed in 2010 (+10.2%), barely kept pace in 2011 (+2.4% vs. +2.1% for the S&P) and lagged in 2012 (+14.8%) and 2013 (+28.4%).
Final thought: the big winners in a cyclical upturn are often the asset classes and groups that were most unduly ill-treated on the way down. While you know our views about the potential for further losses, if you disagree (i.e. are much more optimistic than we are), then history says Technology should be one group that bounces back first.
Source:
Excellent visualizations of annual returns: https://novelinvestor.com/sector-performance/
Thanks for the lists and the link, D.V.
https://www.marketwatch.com/story/starbucks-us-declines-are-deeper-than-some-analysts-expected-others-fear-customers-wont-spend-the-way-they-used-to-2020-04-09?mod=mw_latestnews
The article above states that consumers will not spend as they always did. Well, history says otherwise.
Any thoughts on this? https://twitter.com/WalterDeemer/status/1248345033159380993
High probability. I think most people forget that modern-day market structure is dominated by algos. They do price-insensitive selling (deleveraging) when their VaR criteria are met (most of them tied to vol; when it is going up), like last month, and do price-insensitive buying (releveraging) when their VaR models tell them to, most likely when vol is trending down.
This creates self-reinforcing loops in both directions.
thank you.
Wally Deemer has put the possibility of a breadth thrust buy signal by Monday. While the hurdle is relatively low,, it’s still not a done deal.
I offer a slightly different viewpoint from my former Merrill Lynch colleague and technician Fred Meissner, who also called this rally perfectly:
“Daily charts are overextended, with many in sell mode on their stochastics, while weeklies are in buy mode. That implies a pullback from this area – and how the market takes that pullback will be important. People should not chase stuff here – and buy the pullback if it occurs.”
thanks Cam!
Cam – you sound more optimistic here now than a few days ago.
“…and buy the pullback if it occurs.”
I am just quoting Fred Meissner.
BTW, Fred has a downside target of 220 for SPY, so he’s not bad bullish.
On one hand we have this unprecedented Federal Reserve stimulus and the fiscal support from the Congress. On the other hand, the reopening of the economy will be stymied by the successive waves of CV reemergence. Who is going to win this tug of war? How much firepower is the Fed left with? How do we triangulate these opposing forces to successfully navigate the stock market?
A good article. We will be in the current state on-and-off for 1 year and more.
https://www.ft.com/content/04e9c5fe-52b1-4eb8-bf9c-793d71a0524d
Singapore has introduced a near total lockdown for a month. The country would have to continue tightening measures “from time to time” to slow down infection rates and maintain sufficient capacity in the healthcare system.
Hong Kong had adopted a “suppress-and-lift” strategy. Introduce tougher measures when the virus is spreading highly and loosen them when it drops. May last two years.
South Korea: “There will be multiple outbreaks that have to be suppressed.”
Wally- Here’s one of Ritholtz’ guys trying to come to terms with the same thing:
https://theirrelevantinvestor.com/2020/04/09/im-struggling-here/
Sometimes it just takes time for reality to sink in. A few people recognized the potential for a pandemic back in January when Wuhan shut down – but I doubt anyone in the US was even remotely afraid of becoming unemployed as a consequence.
Even when outcomes are highly predictable, we homo sapiens have a tendency to use denial before ultimately reaching acceptance. Personally, I think it will be months before social distancing restrictions are lifted, and both the social and economic fallout from the disruption will be far greater than we are now able to conceive.
I traded Sun Microsystems during the dot.com crash, and will always remember a rant by Jim Cramer right before bears came for the last stocks standing. I can’t recall the exact price level, but I want to say it was trading around 60 (still near its highs) as everything else collapsed around it. JC was on TheStreet.com pounding the table telling readers to buy the **** out of SUNW. Sure, the stock held up for a while longer – and then ultimately imploded.
I’ve learend over the years not to argue with price movements – but also to respect my own common sense when it comes to illogical price moves.
If a position moves against us to the point of discomfort – let it go. It’s just a trade, not life or death. It allows us to turn away from a distraction and refocus on the next setup, which more often than not will quickly eclipse losses taken on the first trade.
That said, I’m pretty confident that based on Cam’s track record you’ll find an attractive exit point sometime next week.
Thanks for the link RX. I really can’t stand Jim Cramer. I think the guy is an idiot but some people like him.
I agree about the accuracy Cam’s methodology. After decades of trading on and off, his is the only market newsletter I have ever subscribed to for longer than the trial. Honestly.
I agree with your sentiment. But to be fair he increases the understanding of the lay persons which include me sometimes but just don’t follow his recommendations. In fact a few years ago someone did a study that using his recommendations on the short side of a long-short portfolio would be profitable.
https://www.nytimes.com/2020/04/09/business/coronavirus-unemployment-washington.html
” And while Mr. Trump has promised a “boom” in the economy in the weeks to come — foreshadowing a push to lift the restrictions officials have placed on activity — many economists disagree. Forecasters at Moody’s Analytics warned on Thursday that some 45 million Americans were at risk of losing their jobs amid the pandemic, including three-quarters of the workers in the hospitality and construction industries. They warned it was a “conservative estimate.” ”
I wonder if they took into account all the stimulus that’s going to ‘eventually’ come out. It’s hard to hold a decisively bearish view if we’re fighting both the Fed and the government.
Pelosi and Schumer blocked the latest $250 billion small business funding this week. I think that further stimulus will be a long drawn out affair loaded with pork before it will pass, The FED will likely be the only resource for targeted help to the economy unless an economic collapse is imminent.
https://www.nytimes.com/2020/04/10/magazine/coronavirus-economy-debate.html
A lively debate on re-opening America. Worth a read. I would also suggest browsing through some comments.