Preface: Explaining our market timing models
We maintain several market timing models, each with differing time horizons. The “Ultimate Market Timing Model” is a long-term market timing model based on the research outlined in our post, Building the ultimate market timing model. This model tends to generate only a handful of signals each decade.
The Trend Asset Allocation Model is an asset allocation model which applies trend following principles based on the inputs of global stock and commodity price. This model has a shorter time horizon and tends to turn over about 4-6 times a year. In essence, it seeks to answer the question, “Is the trend in the global economy expansion (bullish) or contraction (bearish)?”
My inner trader uses a trading model, which is a blend of price momentum (is the Trend Model becoming more bullish, or bearish?) and overbought/oversold extremes (don’t buy if the trend is overbought, and vice versa). Subscribers receive real-time alerts of model changes, and a hypothetical trading record of the those email alerts are updated weekly here. The hypothetical trading record of the trading model of the real-time alerts that began in March 2016 is shown below.

The latest signals of each model are as follows:
- Ultimate market timing model: Sell equities
- Trend Model signal: Bearish
- Trading model: Bearish
Update schedule: I generally update model readings on my site on weekends and tweet mid-week observations at @humblestudent. Subscribers receive real-time alerts of trading model changes, and a hypothetical trading record of the those email alerts is shown here.
A dash for trash
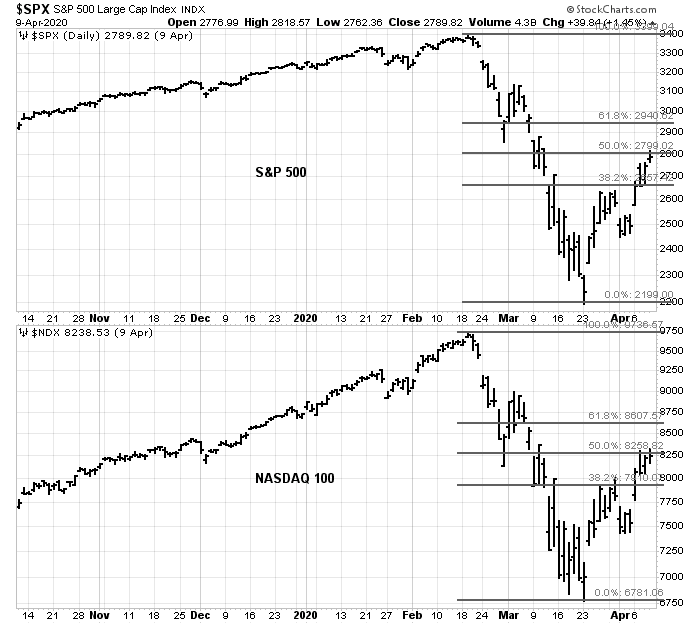
The recent rally off the March bottom has been impressive and could be nearing an inflection point. The SPX and NDX saw their rebounds pause at their 50% retracement levels.
Andrew Thrasher characterized the rally as a “dash for trash”, an anti-momentum rally where the worst performing stocks led the advance.
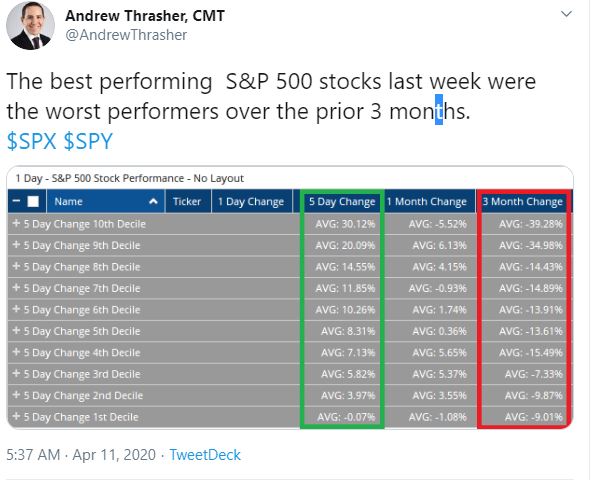
The internals of the “dash for trash” rally has a number of important implications for technical analysts, and could color conventional analysis and lead to erroneous conclusions.
Dash for trash internals
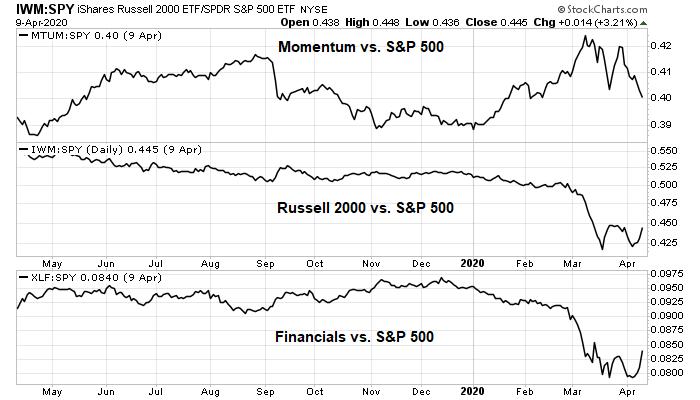
What does the “dash for trash” rally mean? First, it means that the price momentum factor got clobbered, and former laggards, such as small cap and bank stocks, turned around and led the market. Such “low quality” rallies are usually short-covering rallies, as traders bought back their short positions.
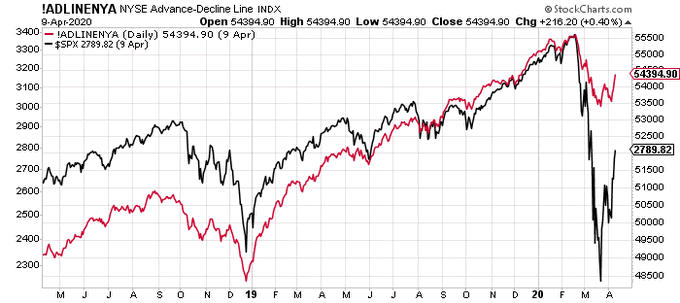
The outperformance of small cap stocks can also color breadth analysis. Equal-weighted indices give greater weight to small stocks compared to their large cap weighted counterparts. This creates an effect of better breadth participation. The NYSE Advance-Decline Line (red) is exhibiting a positive divergence against the S&P 500, as well as showing higher highs and higher lows.
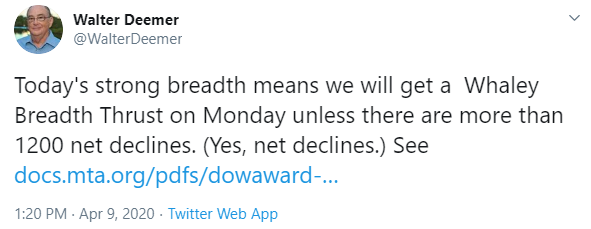
A possible Whaley Breadth Thrust
The strong market breadth led veteran technical analyst Walter Deemer to observe that the market is on the verge of a “Whaley Breadth Thrust” buy signal.
This Wayne Whaley publication describes the Whaley Breadth Thrust (WBT) and its methodology in detail. Breadth thrusts tend to be defined by strong price momentum, usually off an oversold bottom. Price momentum episodes are often followed by further market strength, as market participants pile into a FOMO buying stampede.
Unless I am reading the Whaley paper improperly, my analysis of the paper found the buy signals to be somewhat unsatisfactory compared to my preferred Zweig Breadth Thrust buy signal, which demands that the market must be oversold and exhibit a breadth thrust rebound within 10 trading days. As an aside, the market saw a recent setup for ZBT buy signal, but failed to achieve the breadth thrust within the allotted time window.

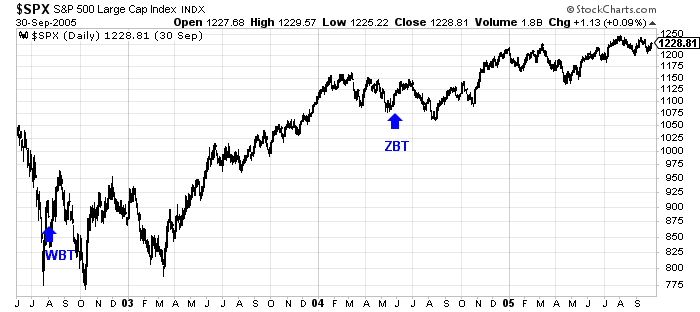
Consider the last two buy signals of this system, which occurred in 2002 and 2008. The Whaley buy signal occurred on July 7, 2002, compared to a ZBT buy signal in May 2004. The WBT was early, and investors would have had to contend with several months of choppy markets before the bulls took control of the tape. The ZBT was also weak, but the drawdown was far less severe than the WBT.
A similar conclusion can be made of the 2008 buy signal. The WBT was early while the ZBT was triggered just after the March 2009 bottom.
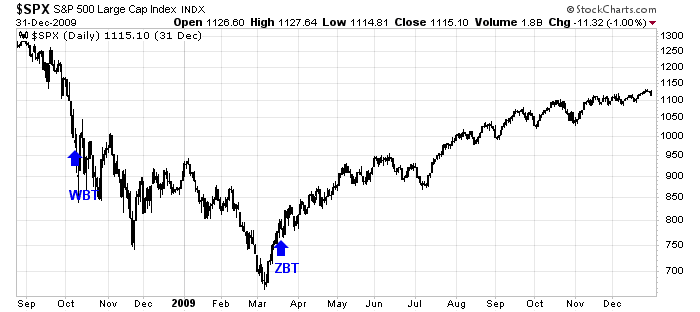
The WBT signal appears to be more effective as a long-term buy signal, but investors need to be prepared for short-term disappointment.
What the bull case means
While I have no philosophical objections to the idea of a short-covering rally which supports a breadth thrust, I am skeptical about the fundamental backdrop from which a bull phase can be sustainable. Here is what you need to believe in order to buy into the bull case.
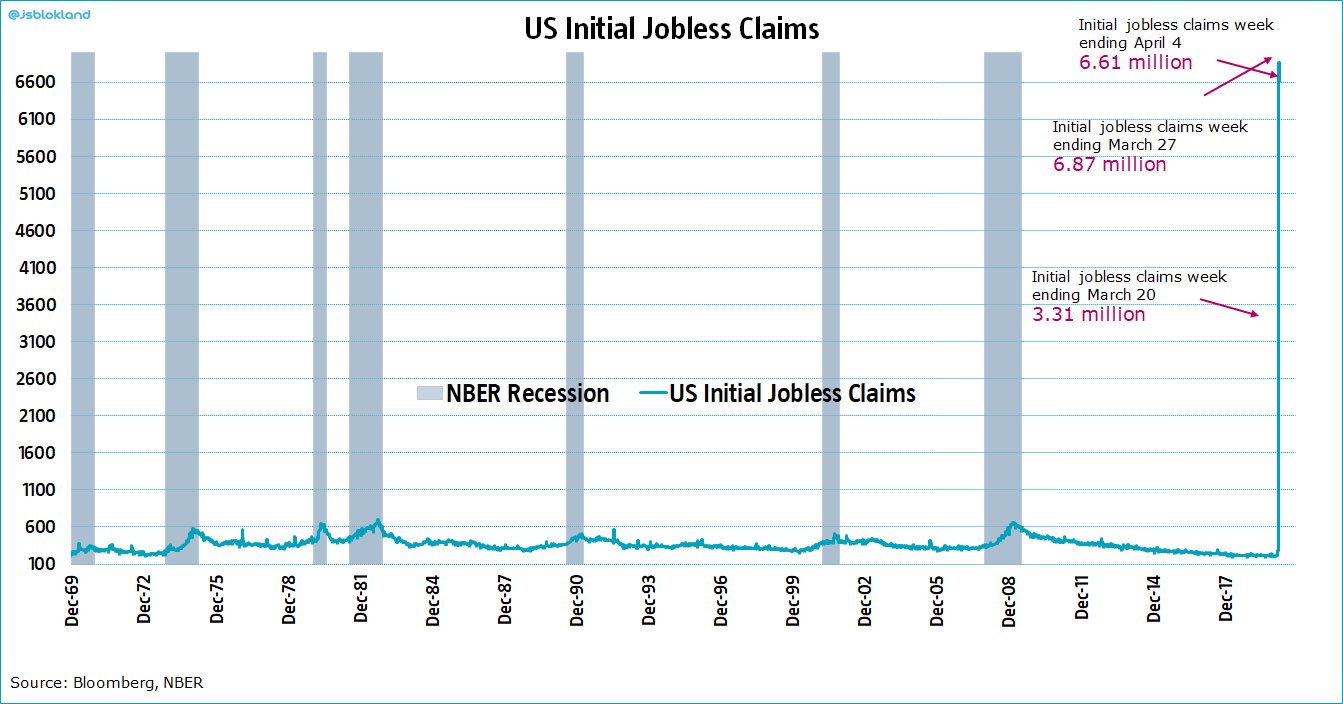
The economy has hit a brick wall, as evidenced by the skyrocketing initial jobless claims.
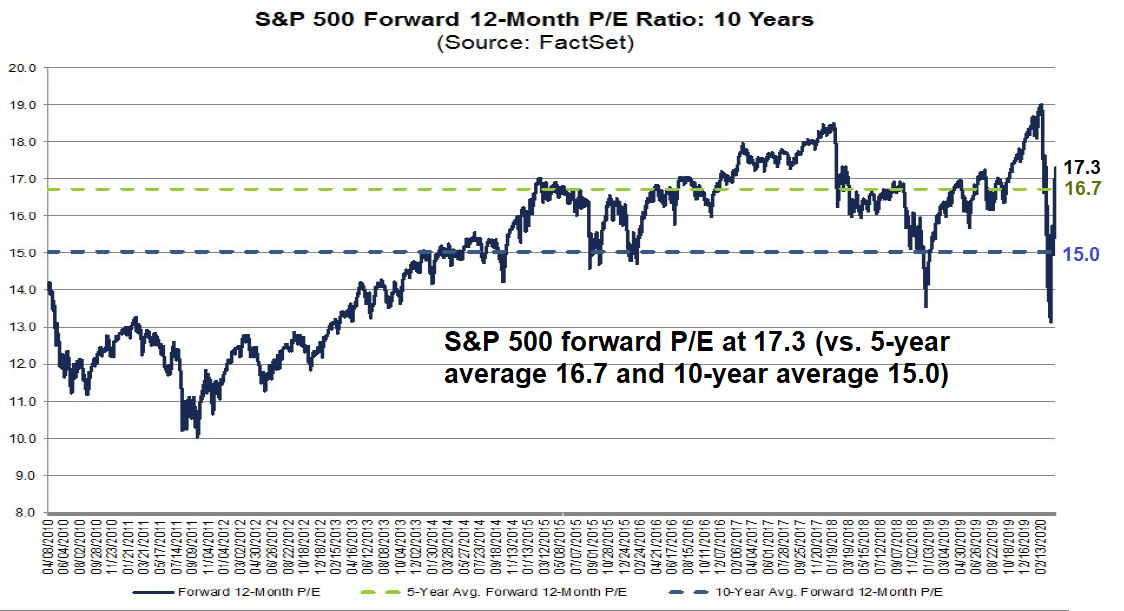
In order to be bullish, you have to believe that the combination of fiscal and monetary policy can repair the growth outlook despite the uncertainty of the effectiveness global public health policy. Paying 17.3 times forward earnings is entirely appropriate, even though the multiple is above the 5-year average of 16.7 and 10-year average of 15.0.
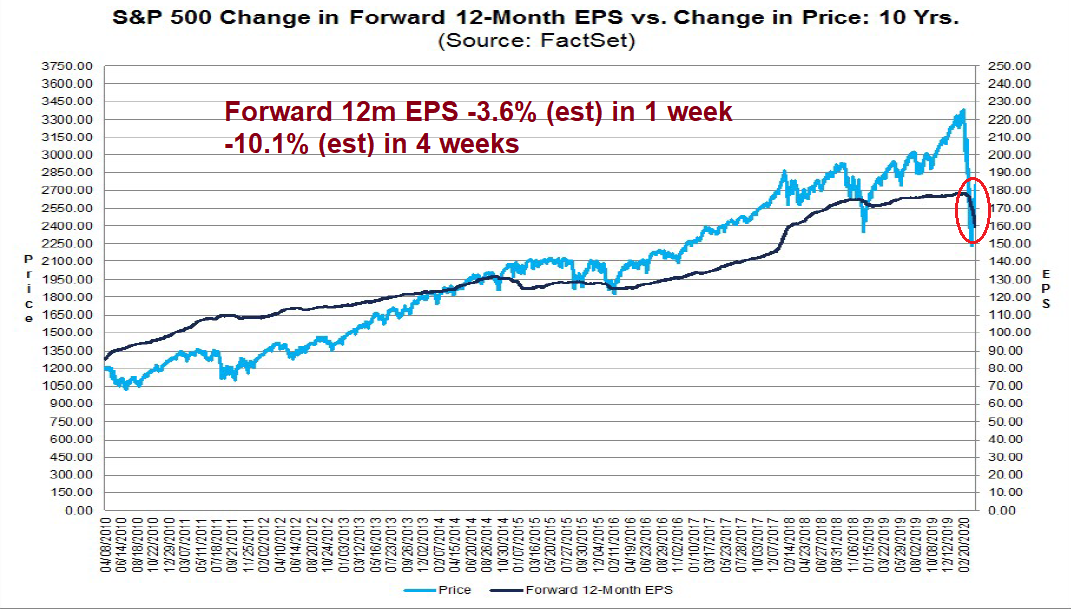
The E in the forward P/E is falling. Q1 earnings season is about to begin. Corporate guidance will be ugly. Companies will undoubtedly report as much bad news as they can and attribute it to the COVID-19 pandemic, rightly or wrongly.
Even if you were to accept the current earnings estimates as gospel, you also have to believe that earnings can form a V-shaped rebound, and everything will be back to normal by year-end.
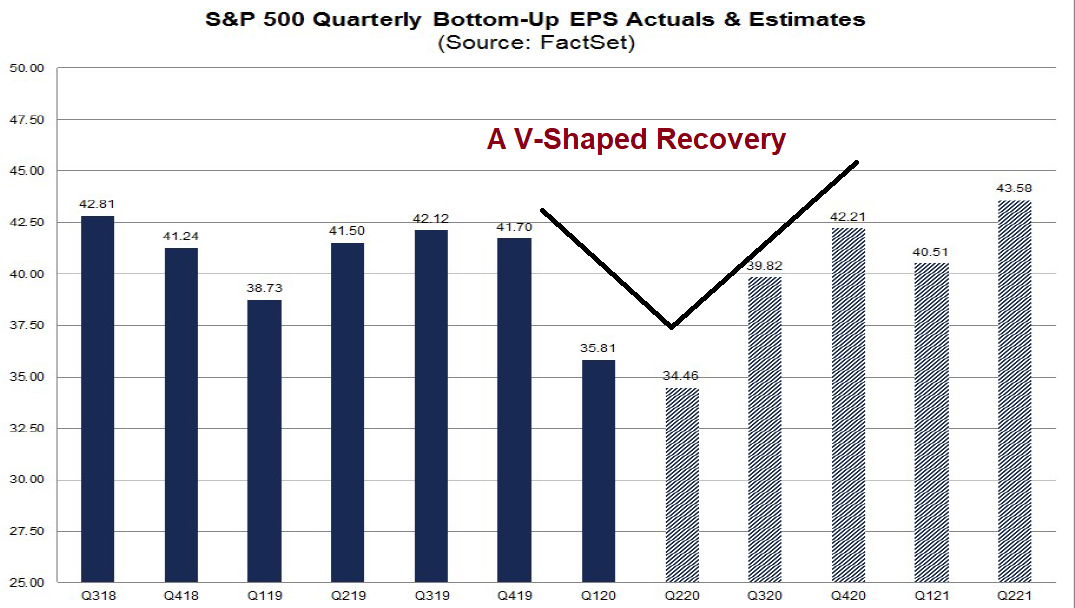
Do those seem to be reasonable assumptions? In the absence of a COVID-19 treatment or vaccine, can we expect the universe to flip a switch and life can return to “normal” if governments were to suddenly relax their lockdowns after “flattening the curve”?
What about the Fed? Didn’t the Fed just throw another kitchen sink at the market? Isn’t that equity bullish? I present Japan as Exhibit A. The Japanese economy topped out in 1990, and the BOJ has tried for decades to stabilize the economy, first by lowering rates, then QE, and then even resorting to buying Japanese stocks. While monetary policy did stabilize the stock market, the Nikkei Average has traded sideways since then, while US and non-Japanese equity markets roared ahead during that period. Central bankers can act as fire fighters, and but they cannot boost stock prices, except in the very short term.

Still a bear market
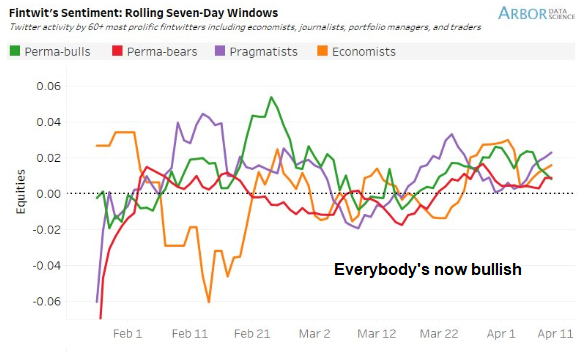
This rally feels like a counter-trend relief rally, instead of a V-shaped recovery off a major bottom. In a very short period, sentiment has shifted from “this is a W-shaped bottom and we are going to test the lows” to “the bull is back”. Arbor Data Science surveyed Twitter sentiment and categorized respondents into perma-bulls, perma-bears, pragmatists, and economists. The consensus is now bullish, and no one is bearish.
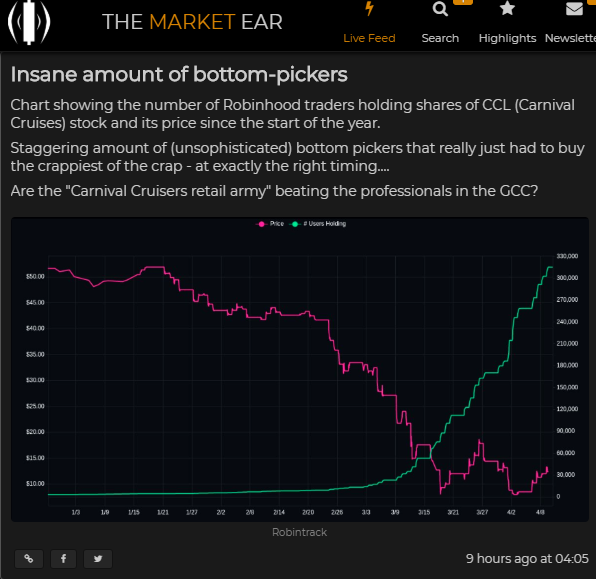
As well, the Market Ear observed that the customers of Robinhood, which is a low-cost discount broker favored by small retail traders, have been piling into the shares of Carnival Cruise Lines.
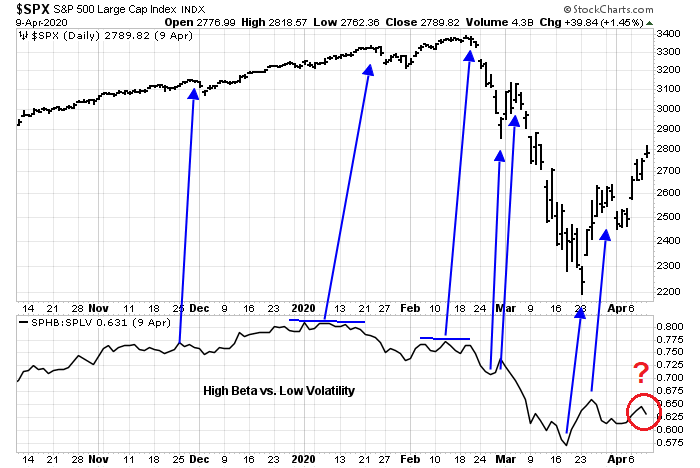
Some of my cross-asset factors are making me uneasy about this rally. My favorite short-term directional indicator, the ratio of high beta to low volatility stocks, unusually turned down even as the market rallied on Thursday. This ratio has led market turning points by a few days in the recent past. While Thursday’s reading could just be a data blip, I will be watching closely on Monday for a confirmation of factor weakness.
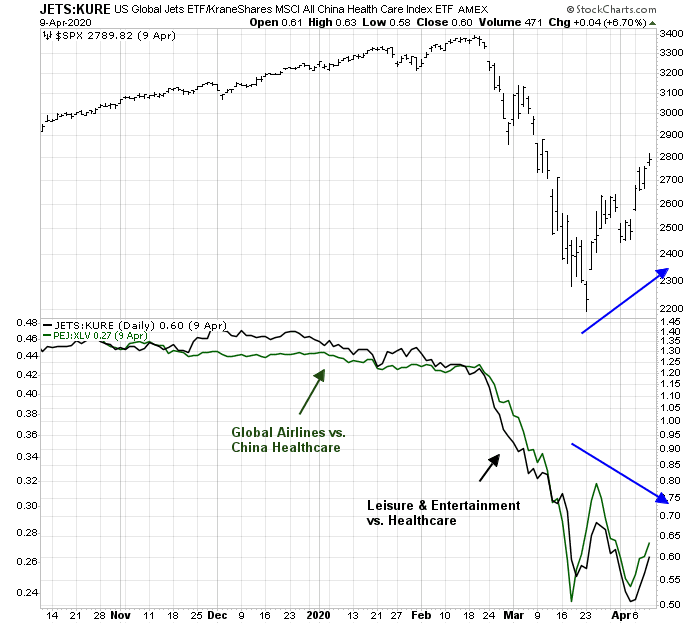
I am not sure how much this matters. My coronavirus pairs did take on a risk-on tone in last week’s rally, but they failed to exhibit higher highs, indicating negative divergences.
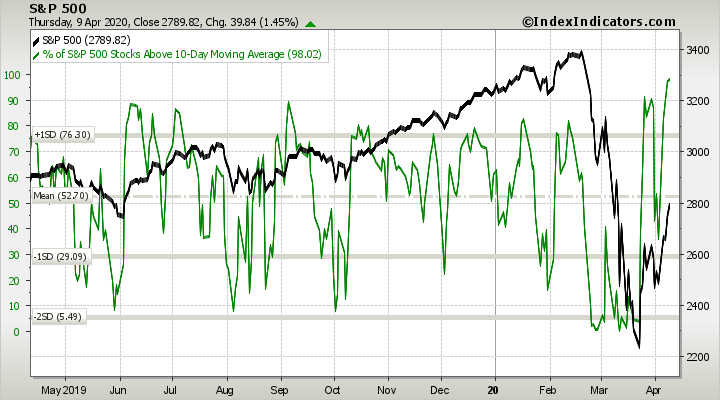
In the short run, breadth has reached an overbought extreme. While overbought markets can stay overbought, do you really want to play those odds?
My inner investors remains cautiously positioned. My inner trader is still leaning short.
Disclosure: Long SPXU
Hi Cam, have you “decreased” the defensive stance on your “inner investor” portfolio? In today’s report, you say that your inner investor remains “cautiously positioned”, while in last week’s report, your inner investor was “at his maximum defensive position”.
No, I just got tired or writing “maximum defensiveness”.
“JPMorgan economists are forecasting that the GDP will fall by 40 percent through the spring months. They also predict unemployment will reach 20 percent in April, with 25 million jobs lost overall. ”
https://www.mediaite.com/news/jpmorgan-predicts-gdp-will-completely-crater-forecasts-a-staggering-40-percent-second-quarter-drop/
Looking at Walter Deemer’s twitter time line, the breadth thrust he was referring to pertains to Table 2 in the Whaley publication rather than Table 9 which you show above. Table 2 (referring to the 5 day ADT signal) had a number of triggers in 2008 which were early signals, but the system as a whole has a 100% win rate over a one year period with a 23% return. On a different note, Ron Hanna of Quantifiable Edges noted that there had been two 90% up volume days within a week. The reward to risk ratios for a 20 day holding period
from that signal was about 30 to 1 in past occurrences. Here is a link to the table: https://twitter.com/ukarlewitz/status/1247981257197154304. The points you make are compelling, no question about that. And one might argue that the unprecedented nature of this pandemic makes quantitative signals based on market history less reliable.
Point taken. I stand corrected.
Thomas and Cam, thank you both! Does this change your interpretation of the significance of Whaley Breadth Thrust, *IF* it triggers on Monday (it has not yet)?
Elaine Garzarelli’s weekly newsletter has a headline Friday stating, “V Bottom Confirmed”
I think she missed avoiding the waterfall decline so my faith in her calls has become questionable.
Interesting discussion on WBT and ZBT. Neither seem perfect, but both appear to point to a market that is oversold and poised for a reversal. The examples shown here, appear to show that the WBT signal may end up with some/significant choppiness, but it depends on your time frame. Someone who decides to buy 12 equal aliquots of stocks after the trigger of WBT signal, is likely to catch a bottom, or so it seems.
As an aside, Sentiment trader has been undeniably bullish in its technical analysis. Here is verbatim from what they have to say about “just a bear market rally”.
While it’s common knowledge that stocks enjoyed multiple large rallies during prior bear markets, at no point during the rallies in the 1930s or 2008 did stocks manage to claw back as much of the losses as quickly as they’ve done this time.
The S&P 500 bottomed 11 days ago. In that short span, it’s retraced nearly 37% of its decline. Looking at all historical instances of the S&P clawing back more than 30% of its decline after 11 days, not a single one was was “just a bear market rally.”
https://www.sentimentrader.com/blog/just-a-bear-market-rally/
The 2008 market debacle was more a credit event, and somewhat of an exception to other bear markets. It was triggered by excesses in US housing market. That said, at the present time, do we have conditions that are pointing to a credit event? Yes, the market was expensive in 2019, but many other factors are dissimilar now, than in 2008. All said and done, Cam’s analysis does ring true, meets the smell test, that this may simply be a countertrend rally, that is an opportunity to raise gobs of cash, as several factors shown here and in the last few posts point to a dismal short term future. Let us pencil in the current WBT thrust, a 50% decline to 2450 (from a range of 2200-2800) for the next move.
Based on the 2008 WBT signal, we may still have a 33% decline from 2800 (to 1876)! A lot does depend on how the earnings and unemployment picture unfolds.
I also read that the reason “trash” companies such as cruise lines and casinos overperformed in this rally is that the Fed intervention benefits them more than solvent, higher quality companies, which have less to gain from the Fed.
Cam, what, if any, indications and other technical items would make you think that perhaps this is a V market as opposed to anything else. I.e. we should be long SPX, not short?
In the absence of a drug treatment, there is no V-recovery. Any exit will be very slow and L-shaped.
See this BBC interview with Bill Gates, who is funding the production line for several promising vaccines so that if any of them proves effective they can ramp up right away. Gates says that we are a minimum of 18 months away from a vaccine.
https://www.youtube.com/watch?v=dQ3O5lxafOQ
That leaves the possibility of some drug treatment that buys us time as the only alternative.
I like this week’s missive. It pays to be balanced and not leaning too much in either direction. We need to observe incremental changes of all the signs. One step at a time. Stay flexible and ready to change your thinking and stance.
As for Thrasher’s hyperbolic headline about dash for trash (In fact he has been saying that for three weeks in a row now). It is a sales pitch. No one will think these trashes are beginning their bull market moves. In fact inside these trashes there are a lot of good companies and they are priced for bankruptcy. Now with Fed’s help they will stay afloat so the share prices just start to reflect the new realities. Some of these companies give high yield dividends so in this ultra-low rate environment some investors will go buy them, plus bottom feeding and short covering.
Just one signal but a good first step: vix spot-F1 just goes contango right now. This starts the normalization process hopefully. Let’s see when F1-F2 goes contango. One step at a time. Patience.
I feel that we are in the silence before a big tsunami of economic destruction hits us. We hear the weather scientists (economists) warn of the risks but we see just normal weather around us. Over the backyard fence we talk about normal activities.
I spend four or five hours a day reading economic and strategist research. They are forecasting a shit storm of problems. Ray Dalio just posted a YouTube video that forecasts a likely depression. I read a learned report from an professor of economics yesterday that forecasts the flooding of Fed cash will have inflation by year end at 5-10%. That would send interest rates up and produce a huge bear market. The unintended consequences from shutting down the global economy are a complete unknown. The first effects will be seen over the next couple of months as first quarter earnings are released and managements talk to analysts.
All I can say is that there is nothing normal happening anytime soon. Nobody has experienced this so everyone is just guessing and I’d expect underestimating how bad things will go.
Over the past 10 years I have heard so much about the “inflation problem” that I tend to automatically discount it. We haven’t had significant inflation in a very long time! Thus, I am deeply skeptical of 5-10% inflation forecasts.
However, I do see a possibility that inflation may start to tick up in a year or two. The flood of cash, low earnings, and the rising price of oil, will all eventually cause prices to climb back up a bit. Maybe 2-3%. This will not be huge, but it will spook the fed and force them to ease off the gas pedal a bit earlier than the market wants. The psychology of the market will change. And that could be a problem.
(Two cents.)
Very good and correct perspective. Prices of assets globally reached such levels that they had no where to go but fall (= deflation). We have seen this in various asset classes for the past 20 years (starting from Nasdaq in year 2000, that lost 80% of its value by 2003). Next bout of deflation was housing in the US circa 2007 that pulled the general stock market down by 66%.
There are structural issues like labor arbitrage that has been unleashed by globalization that has pushed prices down, globally.
Let us worry about deflation, not inflation (unless there is massive disruption in Chinese supply chains; that would be different).
As an aside, gold bottomed out at 256 $ per oz. circa year 2000, it is up roughly 7 times, by now. This is when inflation in classic terms has been missing! Go figure.
As Cam has noted in his missives, we have low bond rates for as far as the eye can see. I doubt if the Fed is going to back of the gas pedal (so) soon!
To play devil’s advocate against bearish thesis that there’s no vaccine until 2021: if we have a therapeutic solution it might affect consumer sentiment against covid19 massively. I read that vitamin c in high doses can reduce ventilator time by 25% and reduce total hospital stay by almost 10% for covid19 patients. Also, CDC website seems to suggest that there are 400+ therapeutics solution (not sure if using correct term) being tested. If even 1 of those is effective it will drastically change sentiment. See: https://clinicaltrials.gov/ct2/results?cond=COVID-19
Though I’m not sure what being tested entails. It can take many more months to test something. Not sure how long the majority of those tests will take.
Here is a useful article with an overview of the vaccine testing process:
https://www.theguardian.com/world/2020/apr/04/when-will-a-coronavirus-vaccine-be-ready
Bill Gates was interviewed on BBC last week. Gates is funding the production line for a number of promising vaccines so that if any of them get approved, the production process is ready to go. His best case is 18 months.
Cam, agreed but I wasn’t referring to vaccines (which as you said would take a long time) but more of an antiviral drug or other therapeutic solution that either increases immunity or one that greatly reduces the fatality rate. If any one of those 400+ being tested can achieve that it could significantly alter sentiment. That’s the black/grey swan risk of the bearish thesis.
Allow me to share some wisdom on vitamin c on this financial site: https://su.org/blog/defeat-covid19-by-strengthening-your-immunity/
I’ve been taking a timed release vitamin C ever since I read of a study showing taking 500mg twice a day reduces the risk of heart attack significantly.
That’s great. In that article they recommended one that is fully buffered and fully reduced l-ascorbate.
The current virus/pandemic may just be the tip of the iceberg of more coronavirus epidemics. This from China’s bat-lady scientist.
“And while she has now quit her life on the frontline of expeditions to find the source of the new strains of the virus, Zhengli has a chilling warning for what’s to come.
She said: “What we have uncovered is just the tip of an iceberg. The mission must go on. Bat-borne coronaviruses will cause more outbreaks and we must find them before they find us.”
https://www.mirror.co.uk/news/world-news/bat-woman-scientist-who-could-21857145