Preface: Explaining our market timing models
We maintain several market timing models, each with differing time horizons. The “Ultimate Market Timing Model” is a long-term market timing model based on the research outlined in our post, Building the ultimate market timing model. This model tends to generate only a handful of signals each decade.
The Trend Asset Allocation Model is an asset allocation model which applies trend following principles based on the inputs of global stock and commodity price. This model has a shorter time horizon and tends to turn over about 4-6 times a year. In essence, it seeks to answer the question, “Is the trend in the global economy expansion (bullish) or contraction (bearish)?”
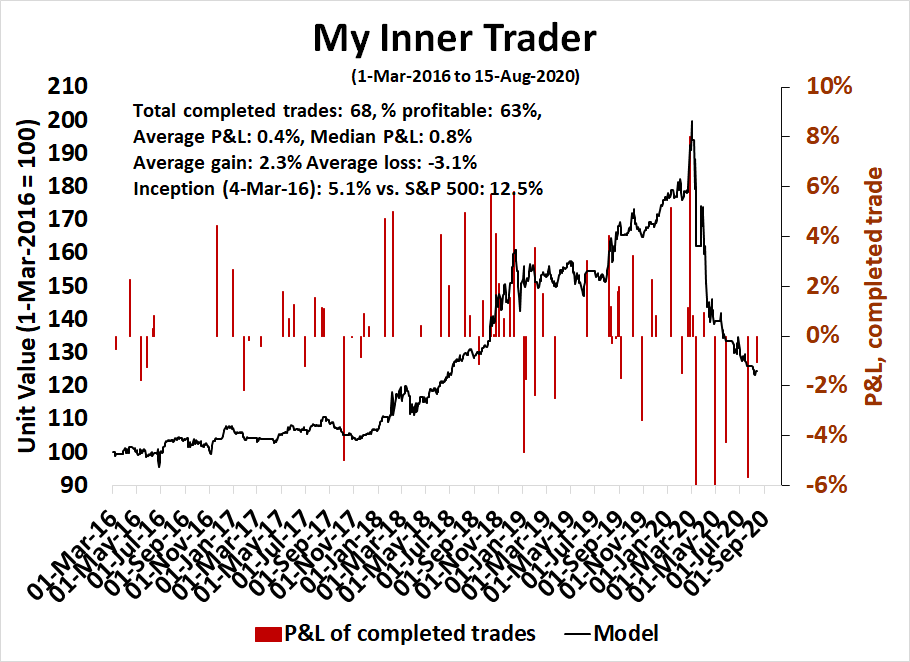
My inner trader uses a trading model, which is a blend of price momentum (is the Trend Model becoming more bullish, or bearish?) and overbought/oversold extremes (don’t buy if the trend is overbought, and vice versa). Subscribers receive real-time alerts of model changes, and a hypothetical trading record of the those email alerts are updated weekly here. The hypothetical trading record of the trading model of the real-time alerts that began in March 2016 is shown below.

The latest signals of each model are as follows:
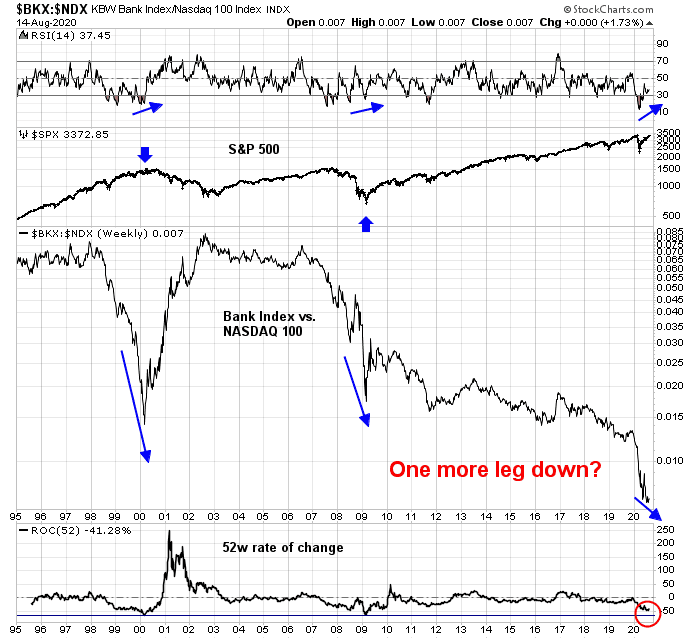
- Ultimate market timing model: Sell equities
- Trend Model signal: Neutral
- Trading model: Bearish
Update schedule: I generally update model readings on my site on weekends and tweet mid-week observations at @humblestudent. Subscribers receive real-time alerts of trading model changes, and a hypothetical trading record of the those email alerts is shown here.
Subscribers can access the latest signal in real-time here.
An unusual correlation
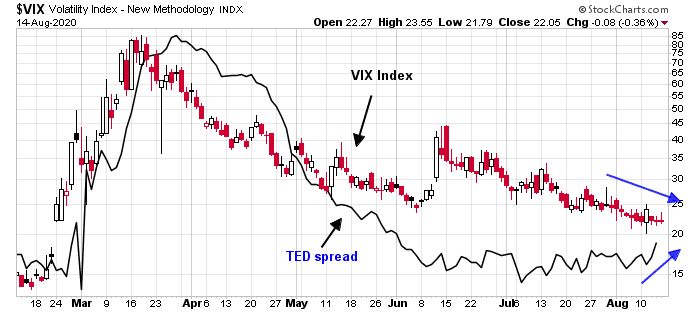
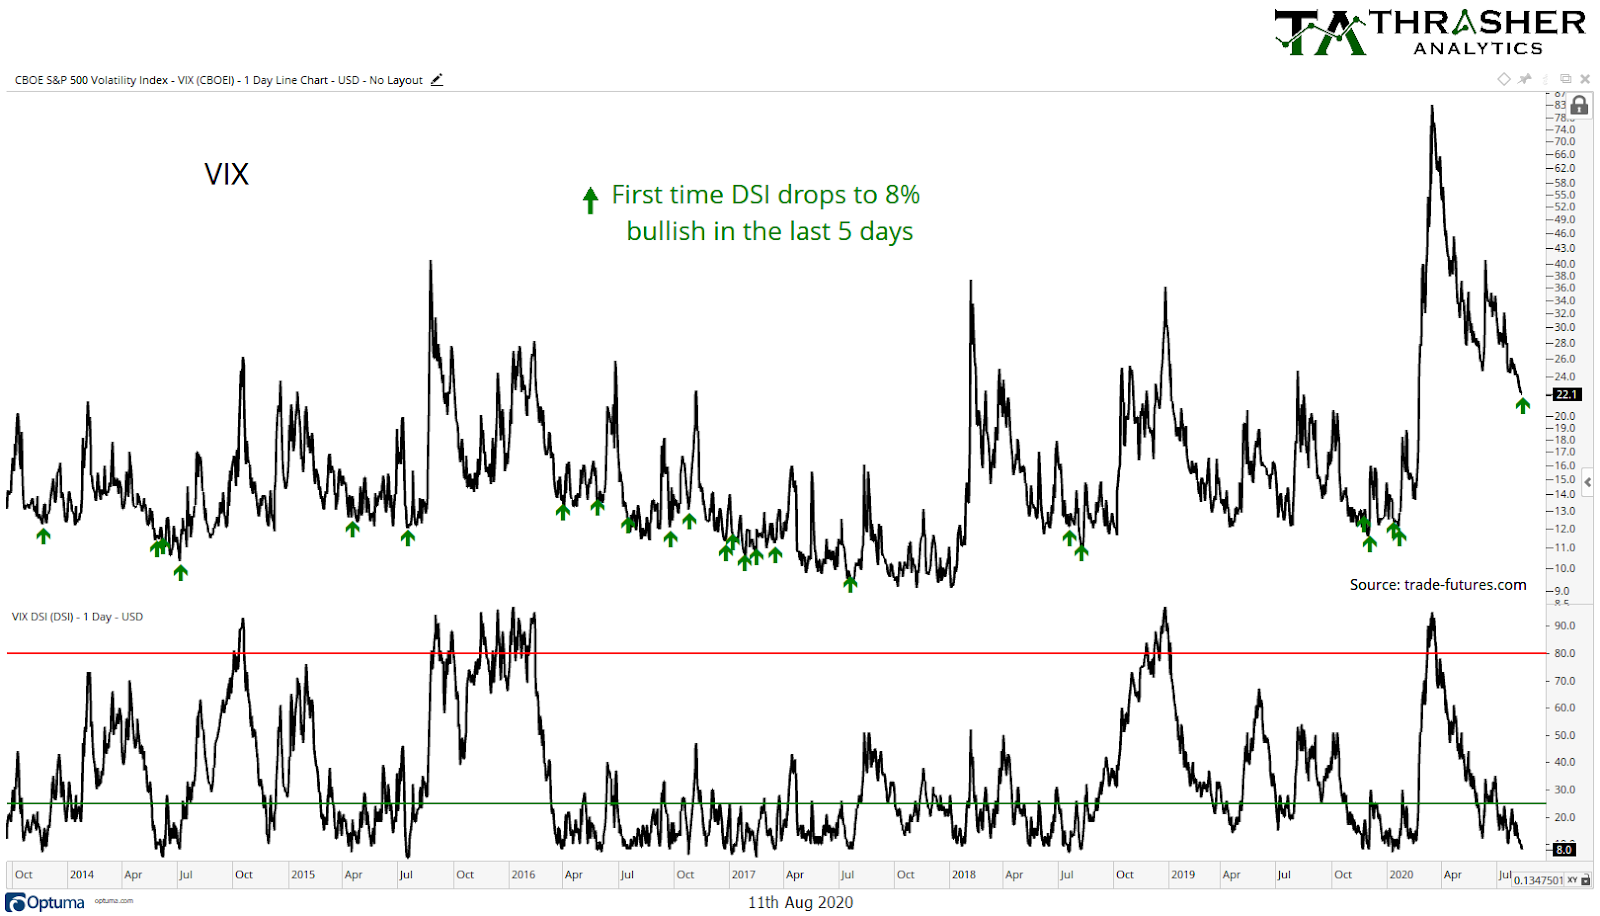
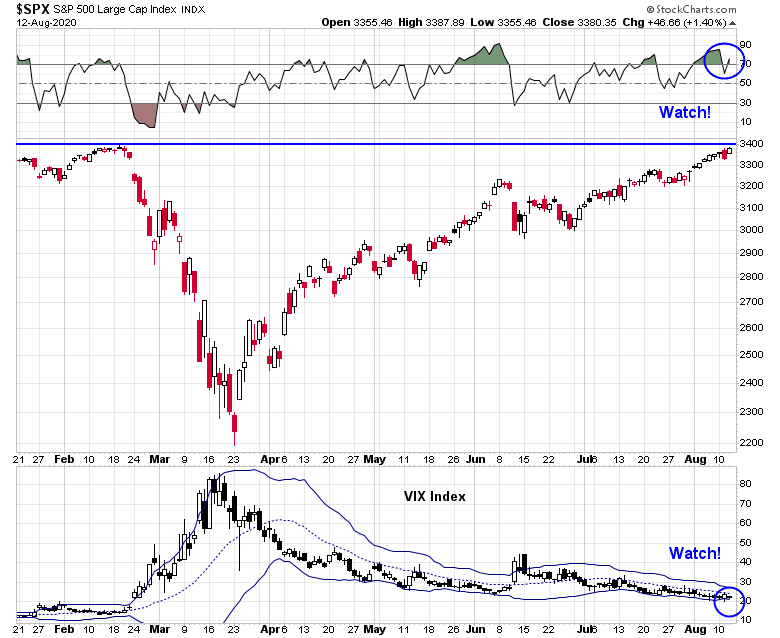
An unusual condition has occurred in the last week, as both stock prices and the VIX Index have been rising together. The VIX has been making a saucer bottom, which could be setting up for a volatility surge, and lower stock prices. While past episodes of high correlation have resolved in short or medium term pullbacks, there have been other occasions, such as late 2017, when these signals marked market melt-ups.
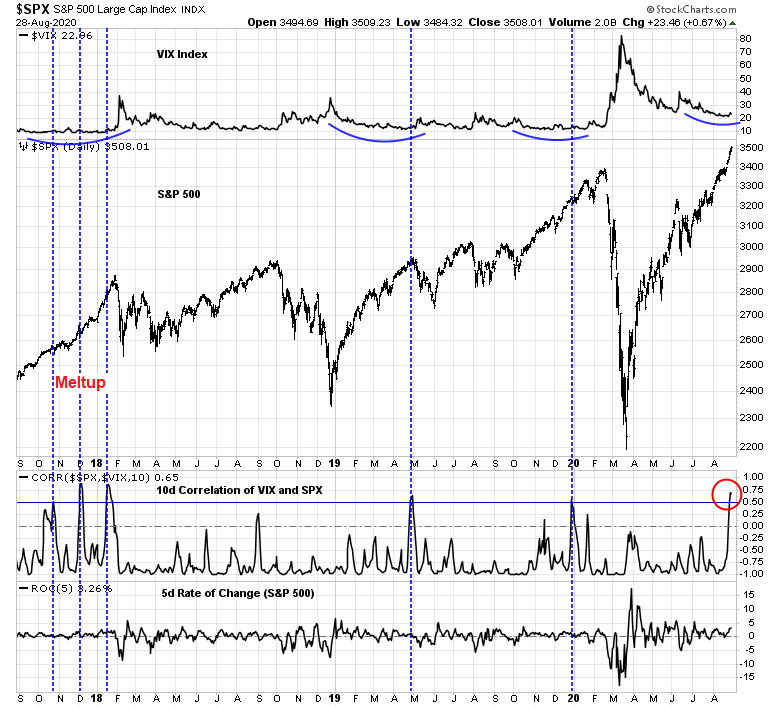
Are we poised for a Volmageddon, or a market melt-up?
An extended market
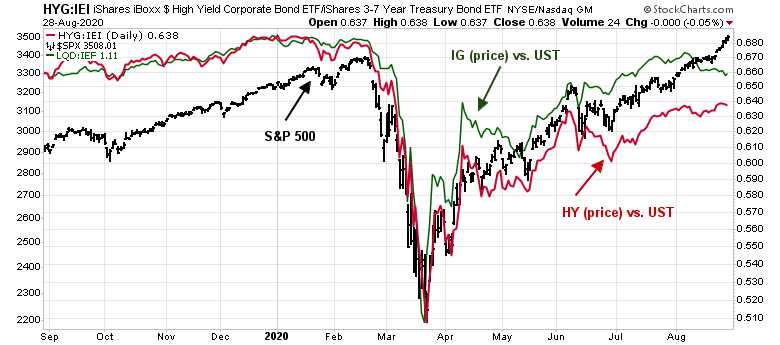
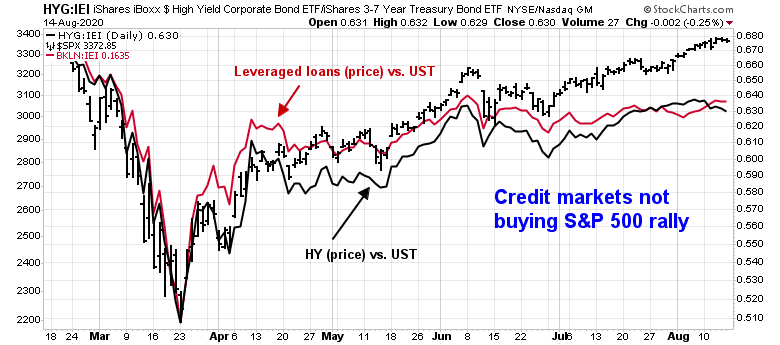
Let’s consider the evidence. There are plenty of warnings of an extended market. I have pointed out before how the price performance of high yield (junk) bonds relative to their duration-adjusted Treasury prices have not confirmed the stock market rally (red line). Now investment grade bonds (green line) are flashing a similar negative divergence. Credit market and stock market risk appetites are in disagreement. Usually, the bond market turns out to be right.
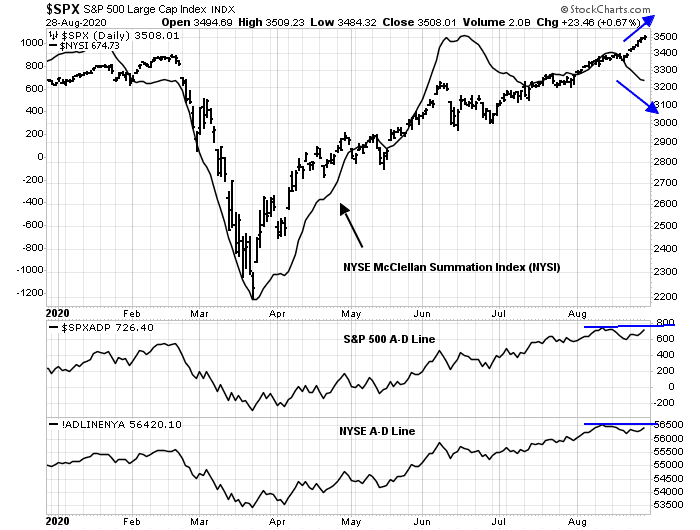
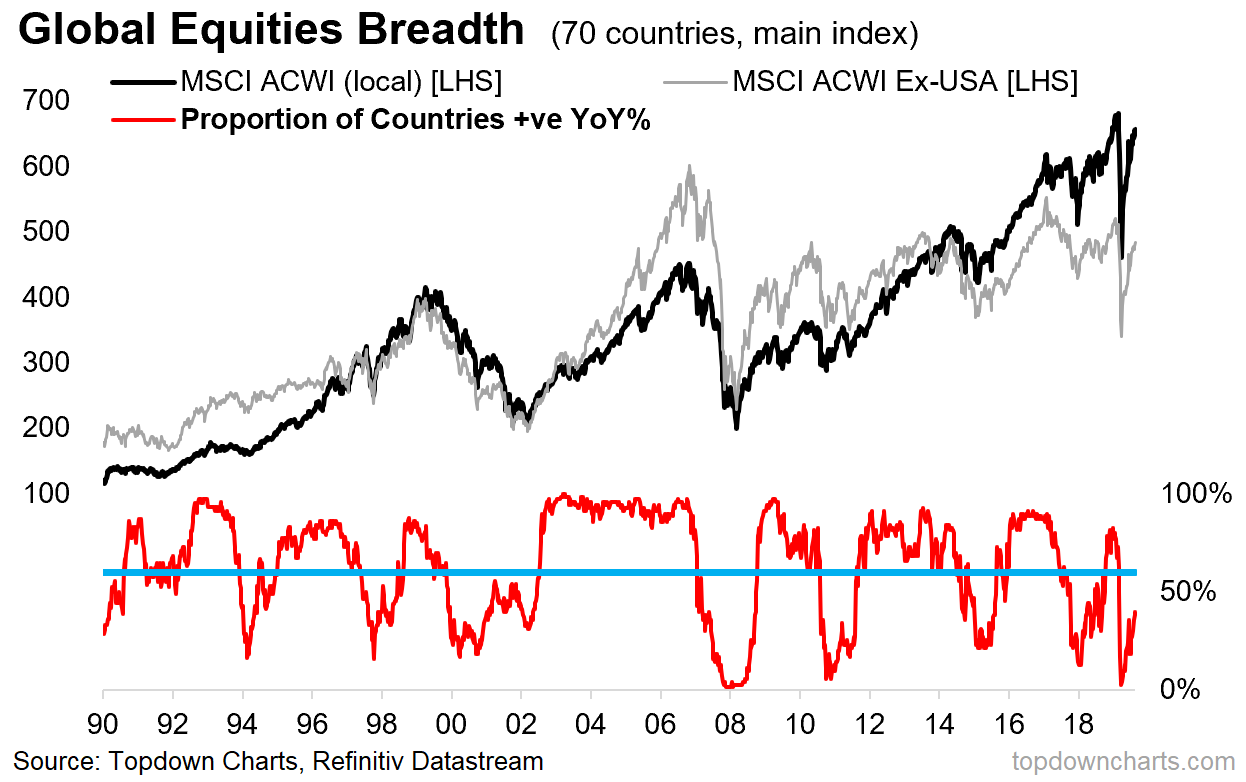
Equity market breadth is also not buying into the market advance, as there are numerous negative divergences.
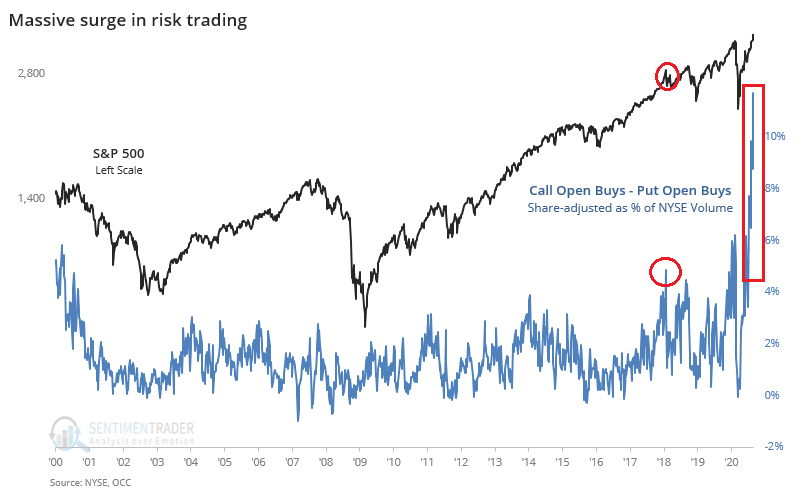
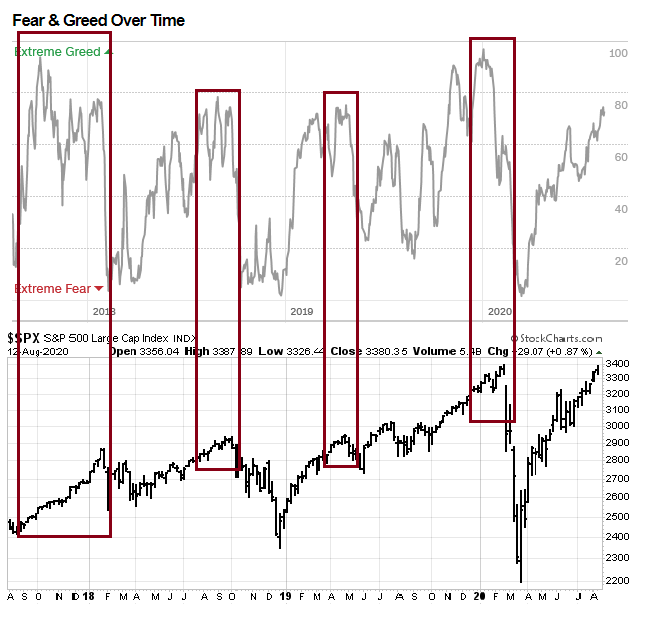
Sentiment is becoming stretched and overly bullish, which is contrarian bearish. SentimenTrader pointed out that call to put volume trading reached all-time highs last week, and conditions far exceeded the levels seen at the 2018 melt-up highs (annotations are mine). He characterized current conditions as a “combustible combo of musical chairs, Russian roulette, and five finger fillet”.
That said, while sentiment models can warn of elevated risk conditions, they don’t necessarily represent actionable sell signals. The Investors Intelligence sentiment survey shows that bears (blue line) have capitulated to late 2017 levels, and the bull-bear spread have similar crowded long readings. However, this did not prevent the market from marching upward until it reached its January 2018 blow-off highs.

Strong momentum
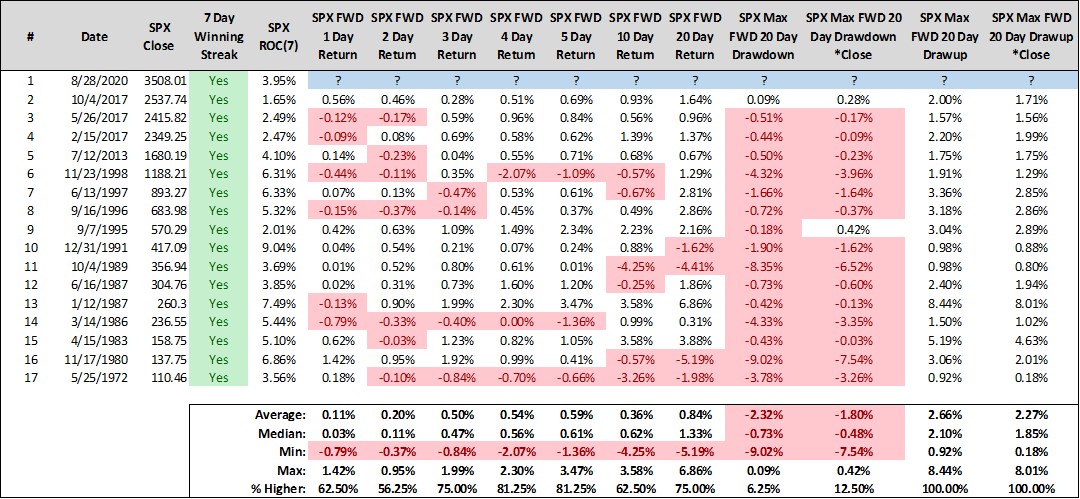
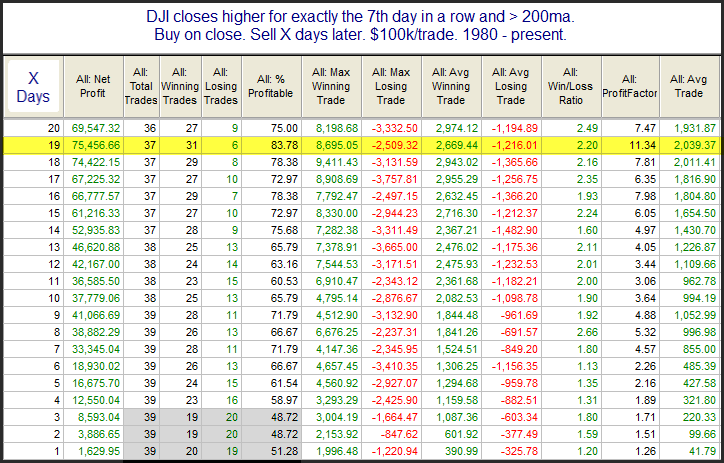
There are signs that the market is undergoing a momentum driven melt-up. The S&P 500 experienced a seven day winning streak, and Steve Deppe found that such winning streaks combined with all-time highs have tended to be bullish.
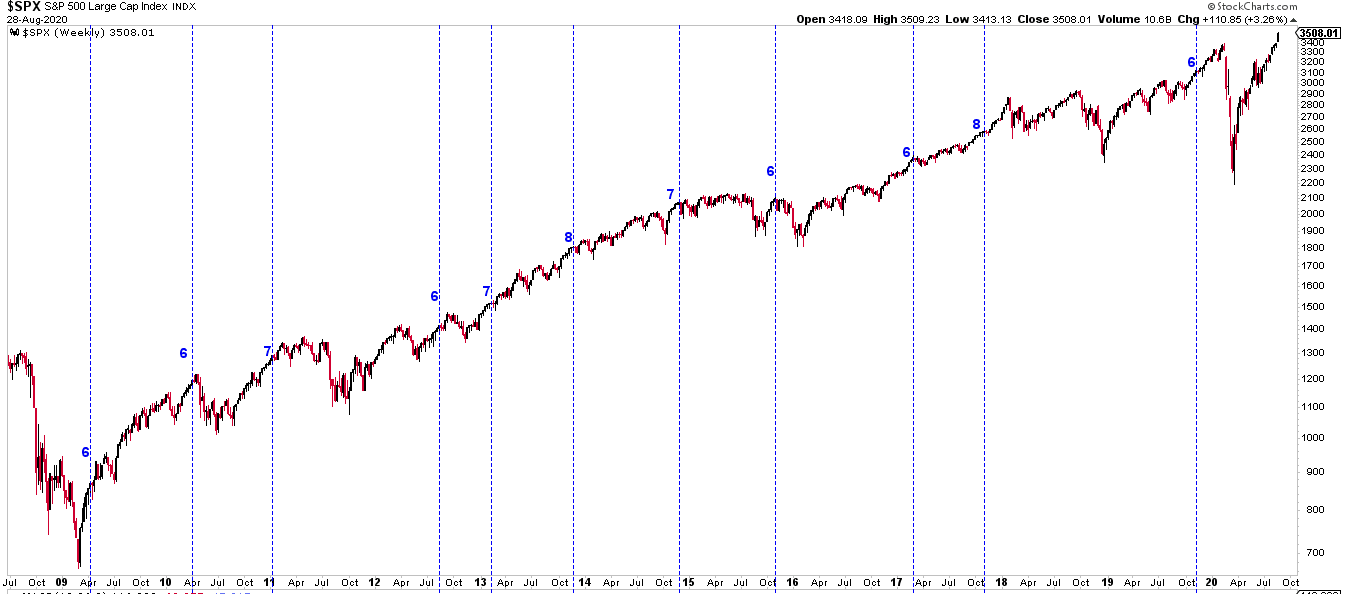
As well, Urban Carmel observed that the market has undergone a five week winning streak. Past winning streaks of six weeks or more have also tended to be bullish, with the exception of 2015.
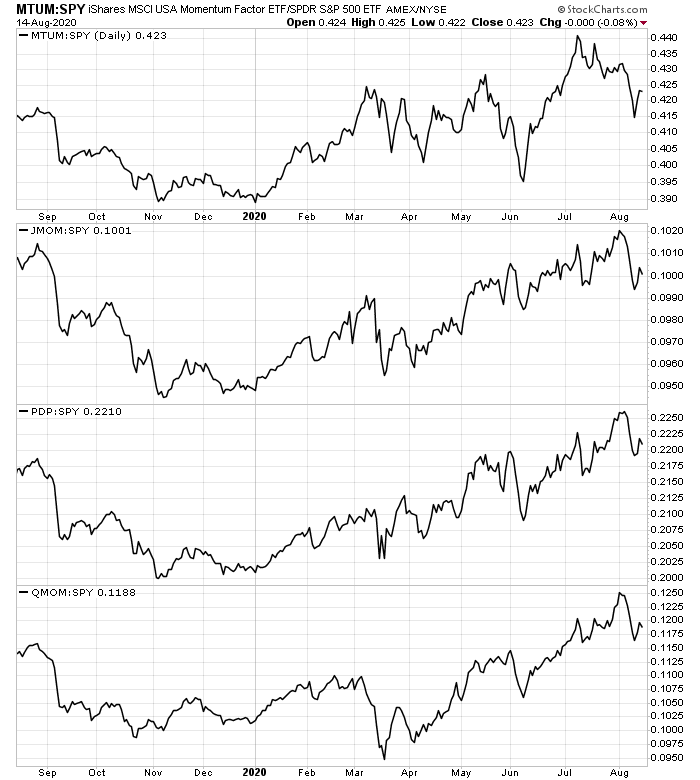
While absolute price momentum, defined as the market rising which leads to further gains, is evident, stock price momentum, or individual stock rising leading to further gains, is faltering. The stock price momentum factor as measured by different momentum ETFs has been weakening. However, the momentum factor also failed during the late 2017 and early 2018 melt-up, and it was an inexact timing signal. Decelerating price momentum can be regarded as a warning, much like how a ball slows its ascent at the top of its parabolic when thrown into the air.

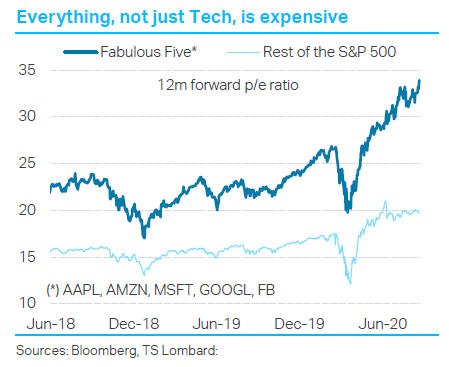
Conflicting messages from Big Tech
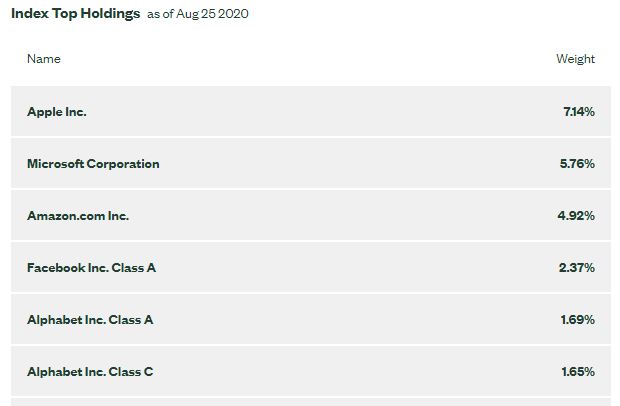
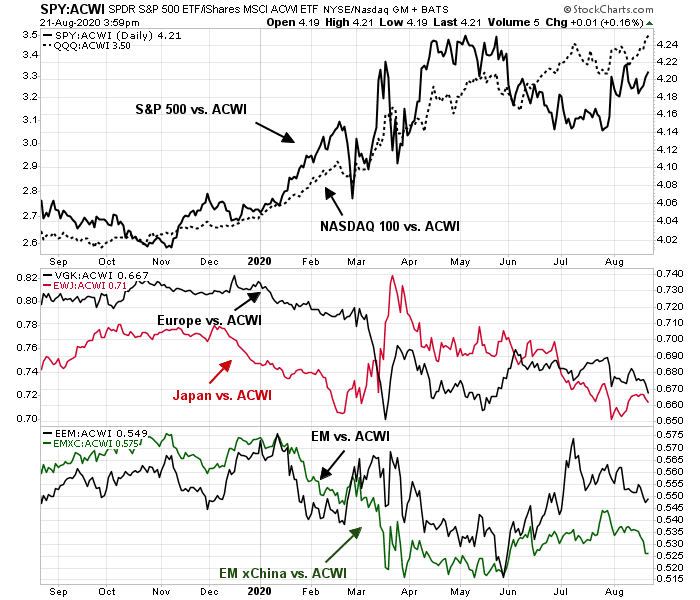
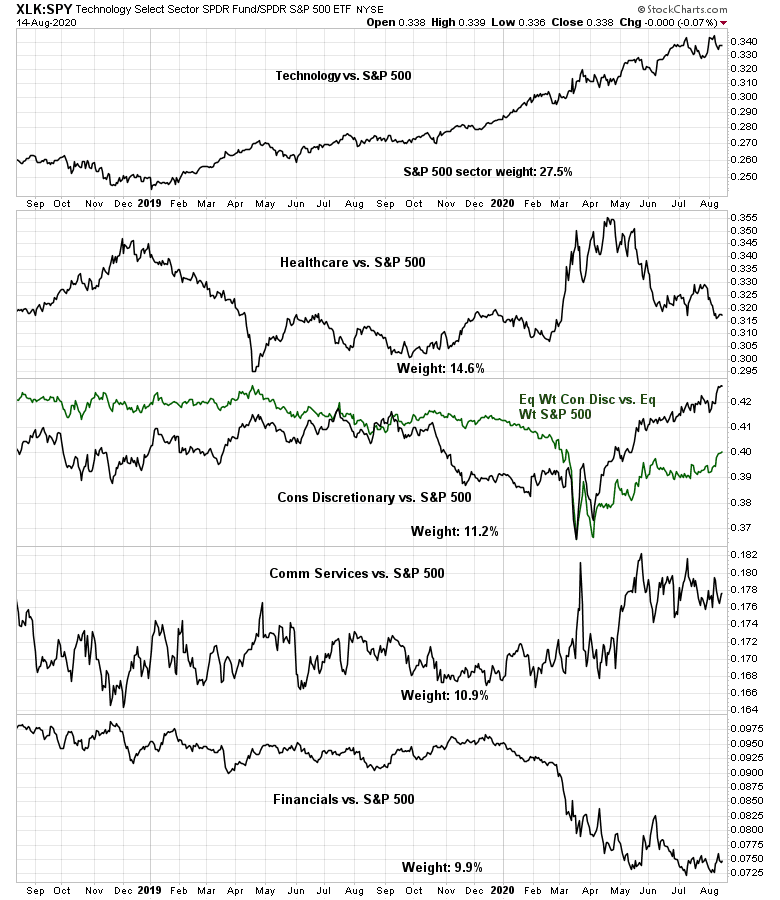
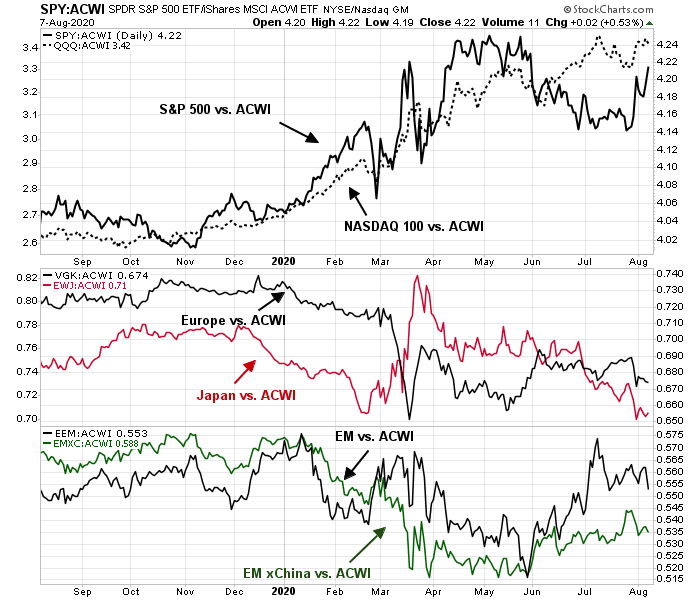
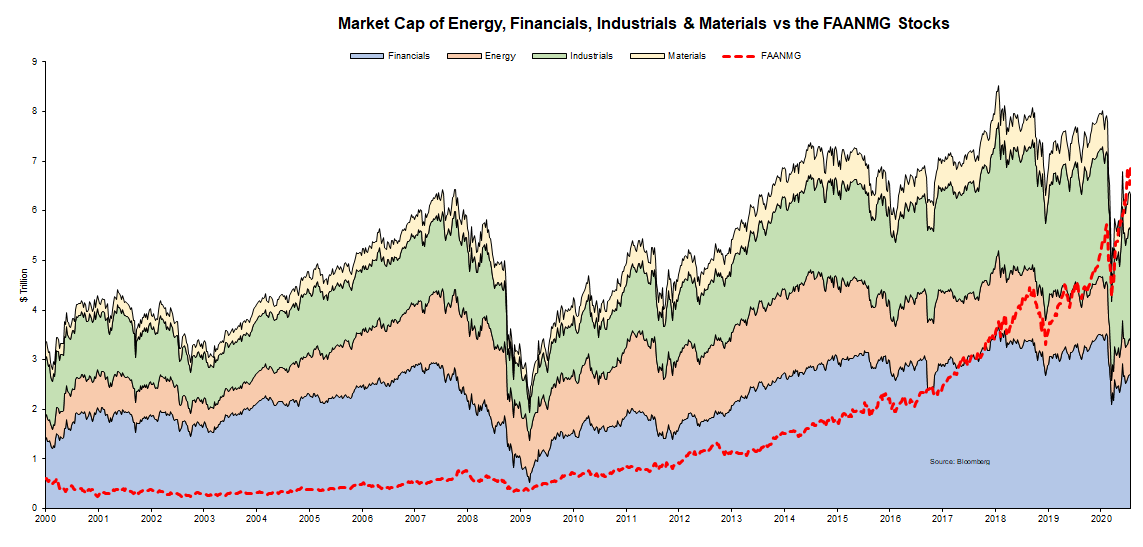
I have made the point before that Big Tech is dominating the behavior of the stock market. The top five stocks comprise 22% of the weight of the S&P 500, and the combination of technology, communication services, and consumer discretionary (AMZN) sectors make up about half of the index. What’s the market message from Big Tech?
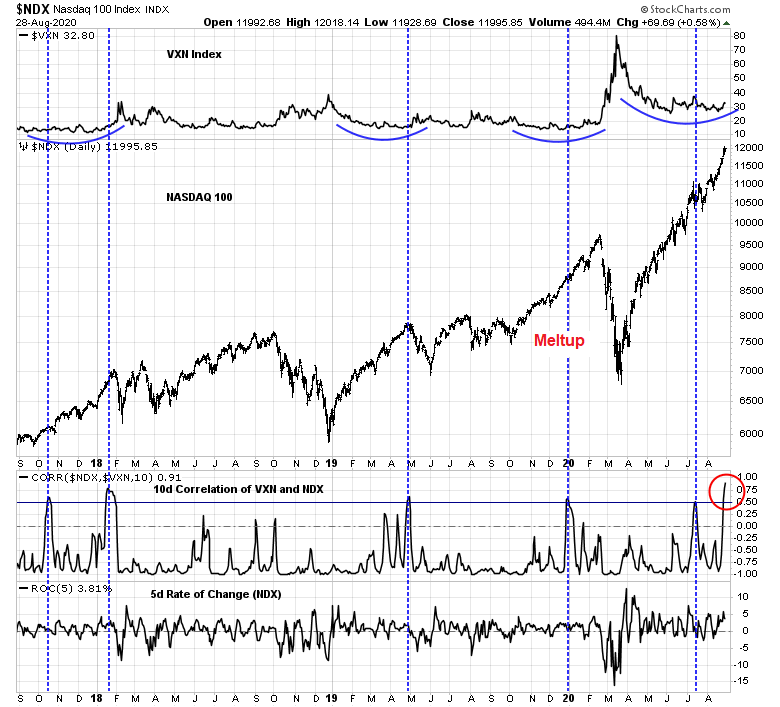
The NASDAQ 100 (NDX) is a good proxy for Big Tech, and it is also experiencing a similar pattern of high correlation with VXN, which is the NASDAQ volatility index. VXN is also forming a rounded base and poised for a volatility surge. While past episodes of high NDX and VXN correlation have been bearish in the past, we also had an experience in early pre-COVID 2020 when the NASDAQ 100 melted up despite high correlation readings.
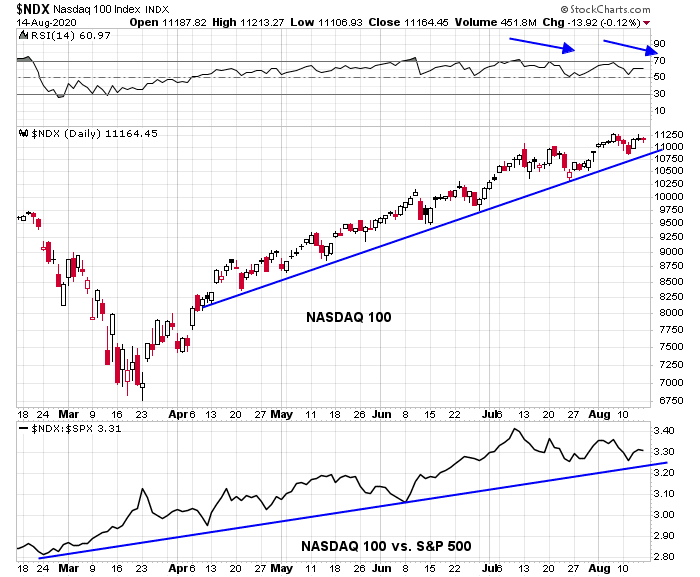
We are seeing some early warnings signs of a downside break. While the NASDAQ 100 is still behaving well, the relative performance of semiconductor stocks are showing some chinks in the Big Tech armor. Semiconductors have been on a tear for over a year, and their relative performance breached an uptrend last week, which I interpret as an early warning that not all is well. I will be watching whether VXN (top panel) can break out of resistance after forming a multi-month base.
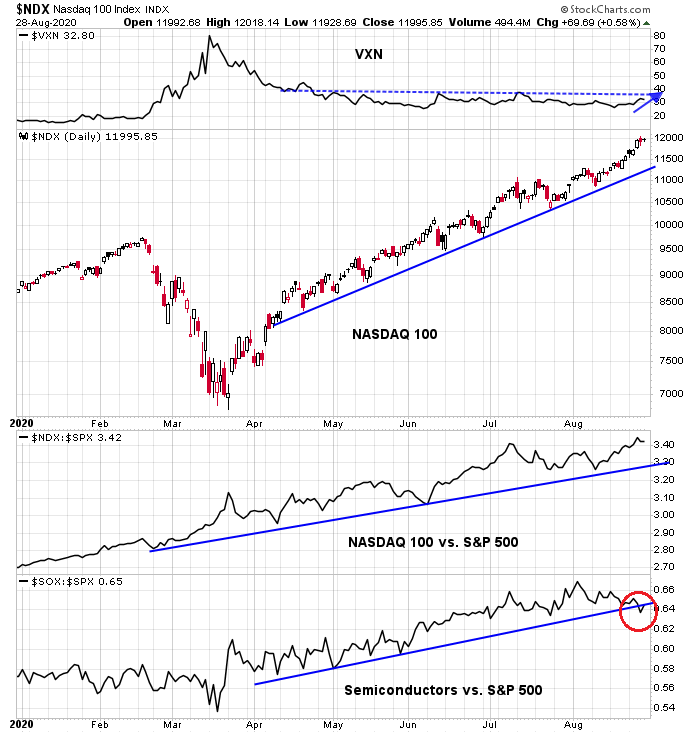
Before the bears get all excited, the relative performance breach was relatively minor, and the absolute and long-term uptrend of the SOX Index remains intact.

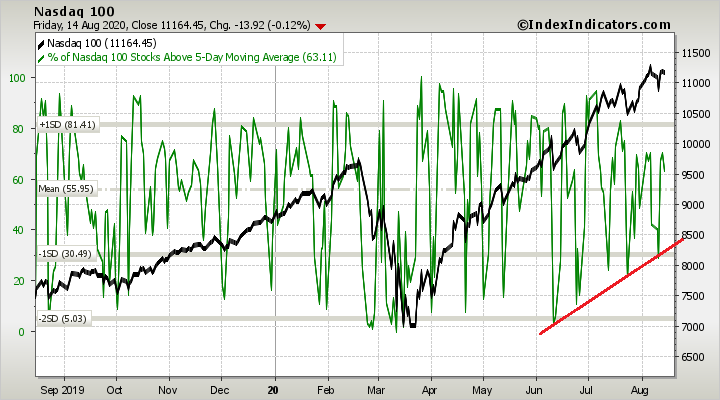
These trend breaks doesn’t necessarily portend an immediate pullback. The NDX is indeed highly extended, but extended markets can rise further. The index has reached 2.7 standard deviations above its 20-month moving average. While this is not unprecedented, the last time this happened was in late 1998 as the market melted up.

The week ahead
So where does that leave us? The stock market is undoubtedly overbought and numerous warnings leave it poised for a decline. On the other hand, strong momentum can carry prices higher into a melt-up, to be followed by an abrupt collapse.
Next week will provide some clues to the Volmageddon vs. market melt-up question. That’s because the market may be overreacting to dovish comments from Fed chair Jay Powell last Thursday, and a post-convention polling bounce by the Republicans in the wake of their convention. While he is still trailing, the odds of a Trump electoral win has been improving at PredictIt.

Equally revealing are the odds of Senate control. The Democrats’ lead has evaporated, and the odds are now even.
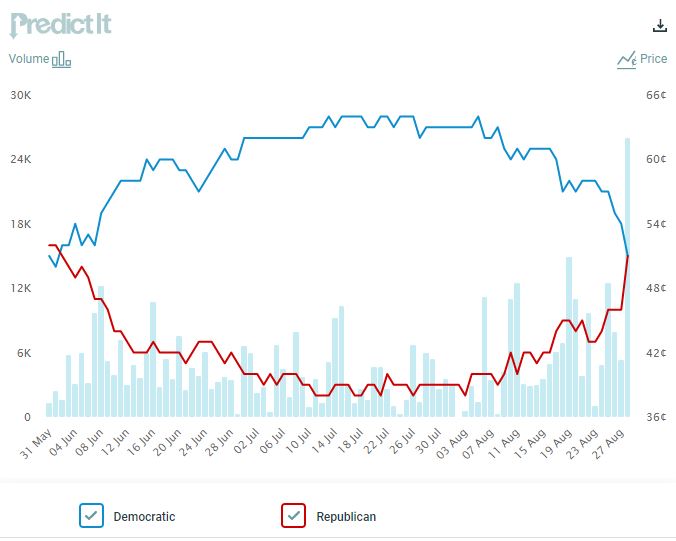
These developments have have been perceived as equity bullish, as Republicans have been thought to be more market friendly than Democrats. However, this may be a blip owing to post-convention bounces, which are common, and we won’t really know how the polling will settle out for another couple of weeks.
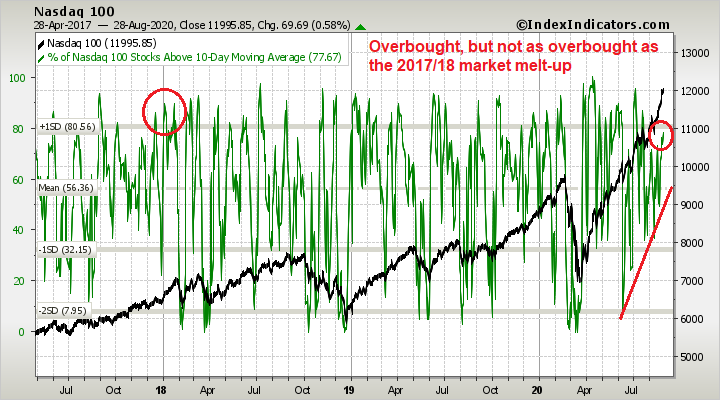
In the short run, the all important NASDAQ 100 is overbought, but levels are below the melt-up peak of early 2018. If the market is indeed undergoing a melt-up, it has room to rise further.
If I had to guess, I would estimate a two-third probability of a correction, and one-third probability of a melt-up, but I am keeping an open mind as to the ultimate outcome.
Disclosure: Long SPXU


