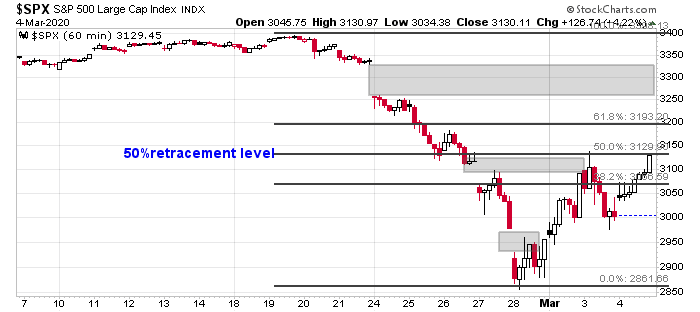
Mid-week market update: The hourly SPX chart shows that the index rallied strongly on Monday. The rally filled two downside gaps and it is testing the 50% retracement level..
While many of the short-term models are screaming “buy”, there are contrary indicators and models that suggest caution. Even though my inner trader has largely been tactically correct in his trading calls, his head is hurting from the wild swings and market volatility.
Buy signals everywhere
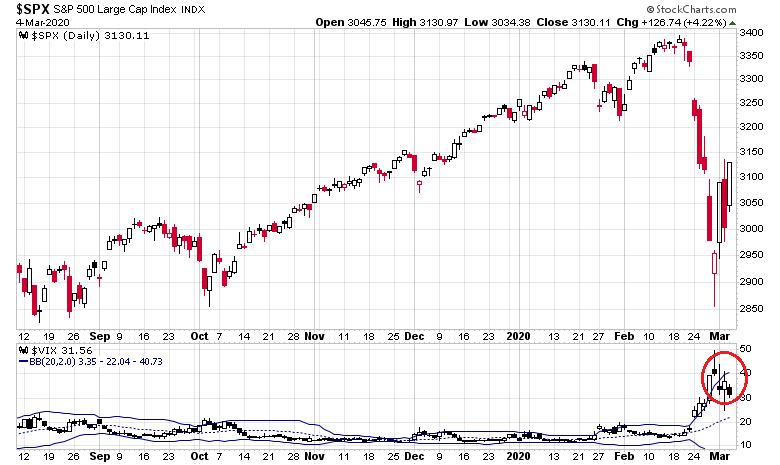
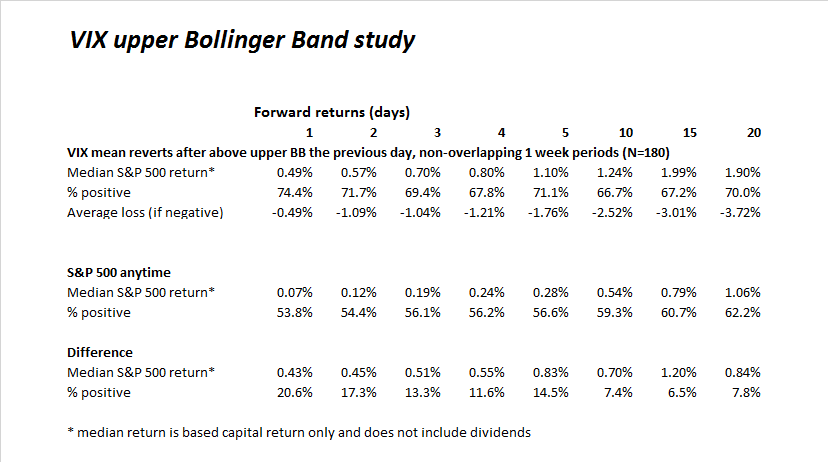
Short-term buy signals are popping up everywhere. The VIX Index recycled below its upper Bollinger Band after a four-day upper BB ride.
Such episodes of VIX upper BB recycles have historically been bullish. The bottom rows in the table below shows that signal alpha is positive out to five days, and then starts to flatten out. Tuesday was Day 1.
As well, my Trifecta Bottom Spotting Model has flashed a trifecta buy signal. The Stockcharts data feed on TRIN has been inaccurate and problematical. My manual calculation based on WSJ closing data shows a TRIN closed Tuesday at 2.33. The market should be ready to rip upwards.

In addition, my Ultimate Bottom Spotting Model flashed a buy signal based on Tuesday night’s closing data. Stockcharts is slow at producing the Zweig Breadth Thrust Indicator, so I created an estimate of my own (bottom panel). Based on last night’s close, the ZBT Indicator was oversold and NYSI was negative – which calls for an intermediate term buy signal.

This should all be wildly bullish, right?
Fundamental caution
The answer is a qualified yes. As the chart of the Ultimate Intermediate Bottom Model shows, the buy signals still marked short-term bottoms during the last bear market. Current market behavior are suggestive that we may be in the first downleg of a major bear.
Exhibit A is II sentiment. While the bull-bear spread is low enough to signal a relief rally, durable bottoms are not made until bearish sentiment (blue line) spikes.
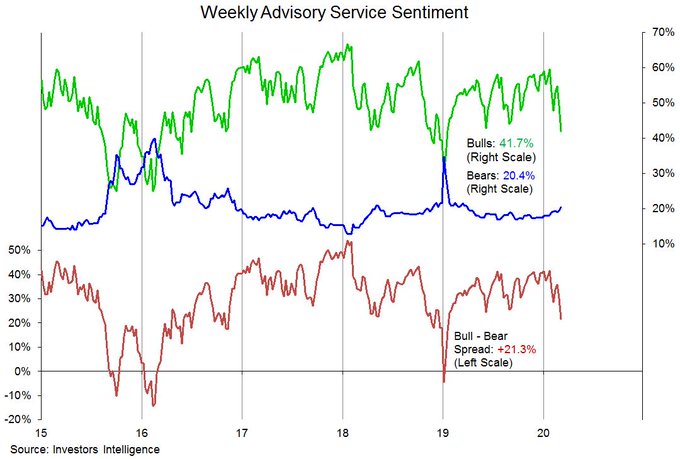
Exhibit B is the 4.3% rally on Monday. Markets generally don’t rally that strongly in bull markets, but these wild swings usually occur in bear markets.
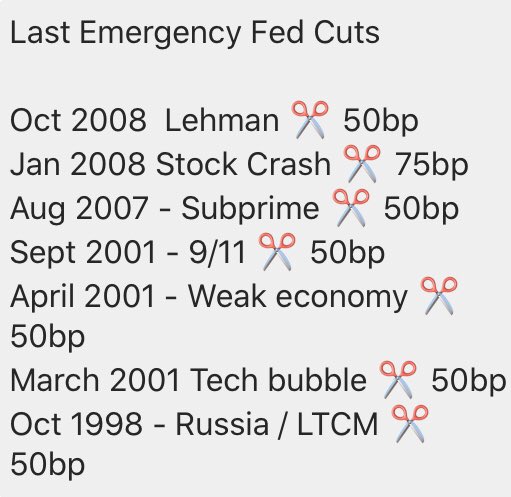
As well, the Federal Reserve announced a emergency 50bp rate cut Tuesday. Emergency rate cuts that occurred between FOMC meetings have historically signaled major dislocations. If the Fed found it fitting to cut 50bp, surely there must be more bad news lurking around the corner.
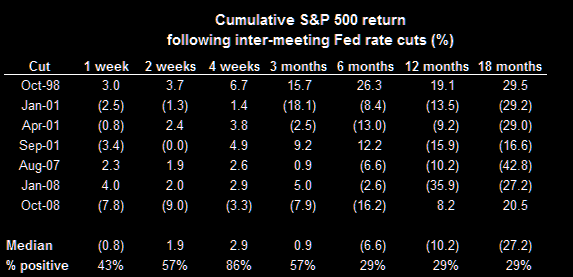
Analysis from Goldman Sachs shows that emergency cuts have not been friendly to stock prices, especially if you look out six months or more.
Which historical studies should we believe? If we were to assume that the global economy is undergoing a major dislocation which requires coordinated intervention, can we really rely on historical studies of signals that are mostly based on what happens during bull markets?
Chop, chop, re-test
Here is a historical study that may be of value in the current situation. Analysis from ISI/Evercore shows how the market behaved after a 10% weekly correction.
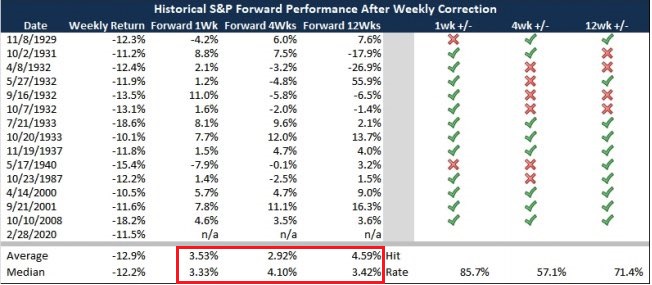
Here are my takeaways from that study:
- All of these episodes occurred during periods of great market stress, such as the Great Depression, the Fall of France in 1940, the Crash of 1987, and so on.
- The market rebounds in the first week, but the returns flatten out between 1 and 4 weeks, indicating a choppy market..
- When the market did rally after a weekly correction of 10% or more, it tended to retrace between 40% and 44% of the decline. The latest rally touched the 50% retracement level and stalled. This suggests that upside potential to the latest rebound may be capped out.
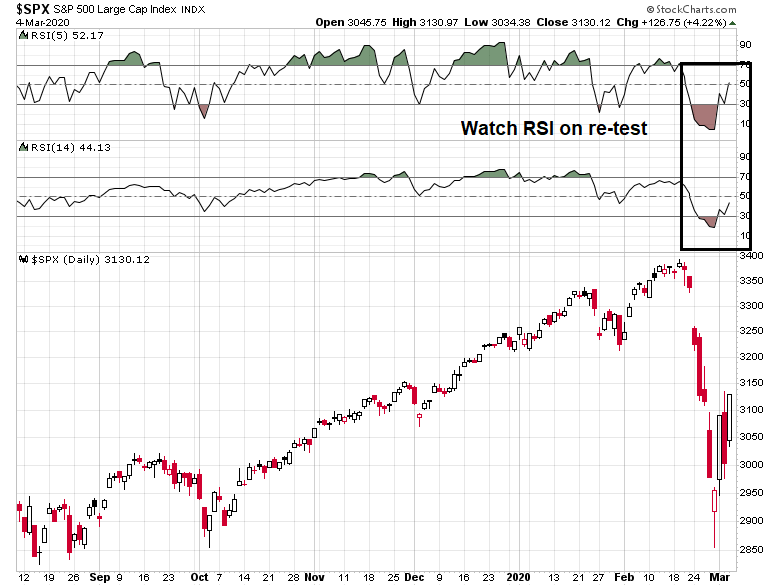
I therefore expect more short-term choppiness going forward, and a re-test of last week’s lows in the near future. There is no guarantee that the re-test will be successful, but I will be watching to see if we see positive RSI divergences on the re-test.
My inner trader’s head is hurting from trying to trade all this volatility. Subscribers received an email alert that he took profits in his long positions yesterday (Tuesday). He is stepping to the sidelines and holding 100% cash in wait of a better trading setup.
I think there’s a 50/50 chance a retest (not necessarily the last retest) occurred yesterday. In my opinion, the -900-point plunge in the DJIA that gave back the vast majority of Monday’s gains created enough panic to set a ST low. I sense a great deal of disbelief in today’s rally – perhaps enough to send prices higher through Friday.
If we assume that the coronavirus has been the primary catalyst for the recent market decline then the rapid spread or lack thereof could push markets up or down. Since this is a common cold related virus, experts expect that it has trouble spreading in warm weather and indeed we don’t hear much about it affecting the summer Southern Hemisphere right now.
In a couple months the warm weather will begin in the northern hemisphere and the southern hemisphere will begin the start of winter. Will this give us a reprieve from the coronavirus spread and watch us ignore it’s effects south off the equator? If so, we may see summer market bullishness only to be followed by a virus revival in next November’s cold and another market selloff. We probably won’t see a vaccine until 2021 in the U.S. so this could play out.
Here is an interesting take on the the coronavirus future effects on the market from Ray Dalio:
https://www.gurufocus.com/news/1065229/ray-dalio-commentary-my-thoughts-about-the-coronavirus/r/caf6fe0e0db70d936033da5461e60141
Barchart has free $TRIN data that looks okay
https://www.barchart.com/stocks/quotes/$TRIN/interactive-chart
somewhat matches
$TRIN Tradestation data
“Date”,”Time”,”Open”,”High”,”Low”,”Close”,”Vol”,”OI”
02/24/2020,16:00,1.42,1.84,0.90,1.60,0,0
02/25/2020,16:00,0.85,0.94,0.58,0.73,0,0
02/26/2020,16:00,1.28,2.25,0.96,2.23,0,0
02/27/2020,16:00,1.28,1.72,1.09,1.59,0,0
02/28/2020,16:00,2.36,3.65,0.51,0.57,0,0
03/02/2020,16:00,0.67,1.89,0.67,1.05,0,0
03/03/2020,16:00,1.23,2.38,0.81,2.33,0,0
03/04/2020,16:00,0.72,2.17,0.58,1.15,0,0
Thanks for the data. Just scanning through the numbers – it feels right that the highest print occurred during the day on 2/28. And also right that the highest closing print was yesterday.
Good stuff. Thx.
This looks like a breakout of a symmetrical triangle. But textbook chart pattern may not work out so well during time of volatility.
https://www.tradingview.com/x/Ltu5Ud5v/
If – a big if – the breakout plays out, we can expect it to tag the 61.8% fib, or SPY = 318.6
Could the retest take the form of a stair-step?
I had to log in just to give Cam a high five. I’ve followed a lot of people over the years – no one calls ST moves as well as he does.
A study of the Coronavirus by the Australian National University estimates under the best of conditions the virus will kill 15 million. Many more if the best scenario doesn’t play out. This probably means more market crippling news ahead.
Being in my 70’s with they typical old age conditions, I’ll just say my goodbye’s now.
https://news.yahoo.com/coronavirus-spreads-one-study-predicts-101552222.html