Mid-week market update: After two consecutive days where the market was down over 3%, I am seeing numerous statistical studies that suggest either an imminent oversold bounce, or a sentiment washout. One example is this analysis from Nomura, as published by Marketwatch.

Has the sell-off bottomed?
The short-term outlook
There are two answers to that question, depending on the time horizon. From a short term perspective, subscribers received an email alert last night that my inner trader was closing his short positions, going to 100% cash, and stepping to the sidelines. My Trifecta Bottom Spotting Model had flashed an exacta signal. The only element that is missing is a TRIN spike over 2, indicating price insensitive market clerk selling that characterizes a washout bottom. Nevertheless, exacta signals have been flagged short-term bottoms in the past.

In addition, the Zweig Breadth Thrust (ZBT) model reached an oversold condition yesterday. As a reminder, the ZBT buy signal is triggered when the market recycles off an oversold condition and reaches an overbought level within 10 trading days. While I am not necessarily expecting a ZBT buy signal, past oversold ZBT conditions have also marked short-term bottoms in the past.

The intermediate term outlook
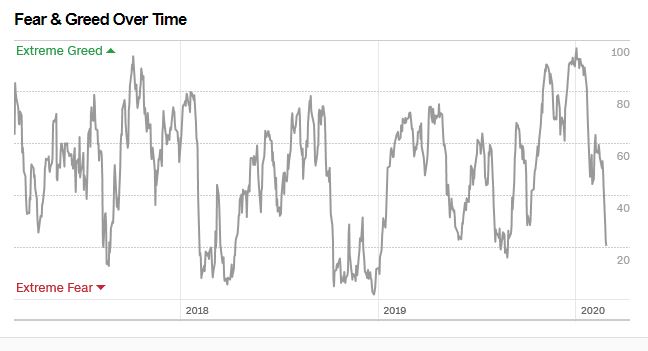
While a short-term bottom may be at hand, the intermediate term outlook is less certain. I had highlighted the failure of the Fear and Greed Index to fall below 20, which is the typical precursor for a durable bottom (see A panic bottom?). The index fell to 21 yesterday and readings have stalled. We are not there yet.
This tweet from SentimenTrader also puts this week’s price cascade into context. While the sample size is very small (n=2), it nevertheless represents a sobering reminder that the sell-off may not be over yet.
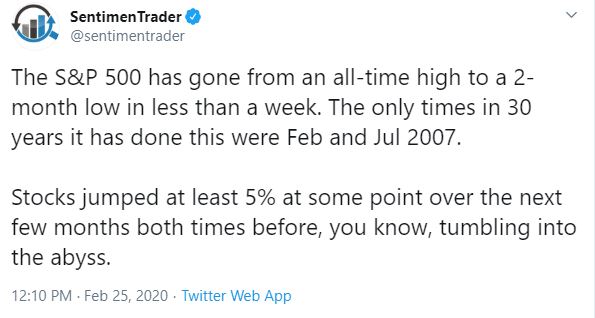
My base case scenario calls for some sort of tradable bounce to start this week, but the market’s anxiety over the COVID-19 coronavirus outbreak is likely not over. The stock market will undergo a period of choppiness for the next few weeks, and possibly months, before a durable bottom can be made. As well, the market is trading at a forward P/E of 17.5, which is more reasonable multiple, but it is nevertheless high by historical standards.
Introducing the Ultimate Intermediate Bottom Spotting Model
This analysis leads me to introduce my “Ultimate Intermediate Bottom Spotting Model” with an accuracy rate of 86% over the last 15 years. In the last 15 years, the market has not seen a decent bottom unless both the NYSE McClellan Summation Index (NYSI) is negative and the ZBT Indicator is oversold. There were only two failures (red arrow), which occurred in 2008 and 2018. In both cases, the model flashed buy signals and the market duly stabilized, but rolled over to an ultimate bear market bottom later. In both of those cases, those failures were followed by subsequent timely buy signals.

The NYSI is still in positive territory today. If this is a major market downdraft, which I believe it to be, then I would wait for both conditions to be satisfied.
My inner trader took profits in all his short positions today and he is stepping to the sidelines. There is no shame in taking a substantial profit when you don’t think you have an edge. While more nimble traders could buy for a bounce here, he believes that the primary trend is down, and he would rather re-enter his short position at a higher level rather than expose himself to headline risk.
Hi Cam,
Thanks for your new Bottom Spotting Model.
Could you please provide a link to your new “model page” in Stockcharts.com .
Thanks,
Gordon
A link won’t be useful for non stockcharts subscribers because the chart has such a long time horizon. If you are a stockcharts subscriber, the ticker for the ZBT Indicator is !BINYBT, and $NYSI for NYSI.
Hi Cam, Thank you for the new model.
You note above that “If this is a major market downdraft, which I believe it to be, then…” – do you believe it to be a major downdraft because of the impact of coronavirus, and/or something else?
Also, is there any logic you can add as to why $NYSI makes sense to you in this context? Thank you, mk
There are two questions. First I believe that this is a major downdraft because of overvaluation, excessive FANG+ exuberance, and herding into USD assets. These excesses need to be corrected, and the COVID-19 outbreak is just the excuse. In addition, the outbreak raises the specter of a global recession, which is a very real possibility.
As for the second question, NYSI going negative is just an indicator that intermediate term breadth is negative, while the ZBT indicator is a short term indicator. I would like to see NYSI negative and ZBT indicator (ST) oversold to call a bottom.
Hi Cam, I’ve been a subscriber for awhile now and I learned a lot from you.
Could you quantify what you mean by “major market downdraft”? ie, 15%, 25%, or else?
Thanks!
It seems the Covid-19 genie is out the bottle. Every day will add to the bad news. I wonder if we will not just see a long slide with small ups.
Brexit, Bernie and Corona…if this is not a bear market already, there is a wall of worry to climb for the market.
I’m leery about studies like the Nomura above that go back to 2000 or even to 2003 with SARS. We are is a social media connected world that is SO different. We have two billion smart phones with media outlets hyper-trained to get eyeballs to their sites. The old saying in the news world was, “If it bleeds it leads.” Social media companies know all our hot buttons.
So a flu like the Corona can cause illogical mass panic and severe negative economic events. Just imagine yourself, if you had planned to go to Las Vegas, would you now? Not me. I admit, this is effecting my sense of safety for my family much more than it should be logically. Then again, I consume so much internet news.
This global health problem in a social media world is a new phenomena that will likely surprise us in its level of panic and severity on Wall Street and Main Street.
I see that the Chinese stock markets are much less down that global markets. I thought that was due to government manipulation but it could simply be because their social media companies are not showing panicky stories to attract clicks. The Chinese government would be restricting the bad news and tilting it to be hopeful and positive. That could have investors more calm.
There is a Chinese curse that says, “May you live in interesting times.” We might find out why that is a curse.
Over reaction to the up side and the down side is “the new normal”. Ken is absolutely right about the terrible effect of social media virality–which is far worse than the Coronavirus. Social Media is a conspiracy theory writ large. The loudest, ugliest and catastrophist voices prevail. perhaps keeping track of Twitter responses and waiting for them to decline would be a useful bottom indicator
The S&P punched through its 200 DMA this morning. The NASDAQ has a ways to go yet. Today could end anywhere – down 1500 or up 500 on the Dow or more. I don’t think anyone knows now.
Bull in a China shop?
As they say, a sharp gap-down open (‘opening in the hole’) is a very bullish setup. It shakes out the weak hands, sets a short-term bottom, and perhaps even closes green. Of course, a setup is just that and not a guaranteed scenario.
It’s notable that FXI (China ‘H’ Shares)/ AHSR (China ‘A’ Shares) are flat to green despite the global selloff. So Cam’s paired trade idea is working.
Personally, I plan to add to positions here. As Wally points out, no one knows where we go from here – we just do the best we can while recognizing that not every trade will be profitable.
As rxchen says, there are trades that work in this environment. Even the long bond has been skyrocketing. But, as Cam said in one of his letters a few days ago, where is the panic? As big as it has been this seems like an orderly decline.
Can the market make a durable bottom without a panic sell then reversal day? Watch price and volume to recognize the panic sell. We haven’t seen it yet.
SPX now +60 points above the intraday low and tagging an intraday high.
Mark Hulbert was looking for an additional 40-point decline in his newsletter sentiment index just a few days ago – I think he’ll have it by the end of the day.
Not there yet.
MarketWatch noted today that we have now closed beyond the 10% correction level on the S&P 500. If the market gets into a corporate growth scare we could be looking at a 20% decline. And if we get into a recession fear we could drop 24% to 32% as a rule of thumb. If I recall, the 2009 decline ended after a 50% decline.
As I said, corona virus is going to be much bigger than SARs.
The problem with all this analysis is, it fails to recognize this is a very unusual event, a black swan. Quantifiable edges, SentimentTrader have been posting all kinds of ways this is not matching past market behavior. 3 and 4% consecutive down days, from all time highs, etc. Lots of examples.
I don’t expect your models are going to be any help because they’re based on usual events.
Or, idk, get a grip people. It’s just the flu!
You are right, Allan. This is a ‘News Driven” decline or black swan. It could go much lower or news of a vaccine or cure could create a rally of equal magnitude. We haven’t even seen a rally beyond small interday rallies so far and we are down 10% in 5 days.
You can choose to ride the Bull or Bear holding on by the seat of your pants or you can just elect to get off the ride for now and wait for clearer weather.
Walter Deemer is pretty good in spotting tops and bottoms.
https://twitter.com/WalterDeemer/status/1233141983490838528
Some notable quotes from that twitter thread:
RIP early dip buyers
“There were never enough survivors for javelin catching to become an Olympic sport.”
I’m in all cash right now. Unless we get a massive rally, in which case I’m fully invested right now.
History says to expect volatility tomorrow
Oh, and:
The stock market is the only place where, when they hold a sale everyone runs for the exits.
Along with Cam and Ken here, Walter Deemer also called the Dec 2018 a cyclical low.
“IMO December 2018 was a bona fide cyclical low and the Breakaway Momentum following it in January confirmed it as such. YMMV, of course.”
Tony Dwyer also called a low yesterday (swoosh and flop i.e. retest the low again), and is still sticking to his call.
Of course, no one is right all the time. Both Cam and Deemer calling a short-term bottom gives me some confidence.
Btw, I invest in individual small- and micro-cap securities mostly in the technology space. I am here to adjust my exposure to the market based on what I learn from Cam.
Tony Dwyer’s call yesterday:
https://www.cnbc.com/video/2020/02/26/tony-dwyer-there-was-too-much-enthusiasm-going-into-peak-expected-dip.html?__source=sharebar|twitter&par=sharebar
That’s the nature of markets. It’s really the only place where we can earn an average of 7% annually (the current figure may be higher or lower than when I first started). We can either ride the ups and downs, or try to manage them. No one is going to get it right every time.
That said, it’s remarkable how often Cam gets it right. It was absolutely his calls that helped me sidestep a couple of downdrafts, and when I did get caught it was an overweighting outside the US that mitigated the downside. That’s why we’re all here, right?
Absolutely. Cam offers a valid service that you can’t find anywhere else. In a normal market his calls are amazing. I don’t think this is a normal market.
The best advice is to not step in front of fast moving freight trains. They rarely stop where you expect them to.
BTW, Cam told us to liquidate most holdings when we were near the highs last week. I heeded that advice and only have a 10% exposure to the market. If we get a bounce I will have even less.
At some point, companies will begin to push back against containment policies. Trump’s comments yesterday re the flu are valid – the flu virus circulates every year with predictable numbers of fatalities, yet a significant percentage of people decline vaccination and there are no companies that shut down production due to the virus. The global response to COVID-19 seems disproportionate in comparison. How will investors view this week’s selloff a year from now – will it have been an overreaction, or just the beginning of a protracted decline?
Cam
I thought the Trifecta bottom was a long term buying signal, rather than a short term indictor?
The Trifecta Model is more of a trading model that spots short-term bottoms. Of course, short-term bottoms can coincide with intermediate or long term bottoms. That’s where the confusion may lie.
Thanks.
DJIA/ SPX futures declined an additional -677 points/ -100 points (even more relative to ‘fair value’) overnight. At their lowest points, we were looking at an additional -2.5% hit. I think that’s a washout, and we’re fortunate the selloffs occurred outside the regular session.
My take? Currently, US markets look to open off -1%. The indexes will once again be opening in the hole, and (once again) I assign high odds that they’ll close in the green. Markets are not unlike life – there are rules to follow that keep us out of trouble, but not ones to be blindly followed. We use common sense, good judgment, and know when to make exceptions – we also recognize the role that luck plays. Sure, I could be way off, but in my opinion this is a better time to buy than it is to sell.
To be honest todays market reaction was a shock for me. Hopefully we find the bottom today.
I am going to wait till Monday to see if we get a flush out bottom. There may be more uncertainty over the weekend. See Cam’s graph and the congestion zone around the 2850 range. Watch the double bottom at 2750 also. Let us see if this range holds. VIX is reaching some historic levels past 50, for some time. Blood is now running in the street, but still need a flush out.
At how may points of the Dow, do the circuit breakers trip?
And, where is the Plunge Protection Team? Well, there is some talk of coordinated central bank action this weekend.
Would like to see a quick 5% decline in one day and a follow through on Monday, a VIX spike and then a sharp decline in VIX. So far, many things about this market are by the book.
On the other hand Monday is first day in March. Fund and ETF must rebalance their portfolios – for mixed funds there will be a need to buy stock and sell bonds.
Moreover first couple of days of each months are stronger.
The mid-day rally today is being led by the semi-conductors. A little better up volume too so we’ll see if this one has any traction.
Macro Chart posted a new blog today. Calling for a short-term bottom. Rally and retest of lows.
https://macrocharts.blog/2020/02/28/a-historic-week-for-stocks/
I tried a few longs after this post came out and ended up stopping out all of my positions.
Went into all cash for now.
This tape is too wild for me.
Almost a green close!
(a) VT (the world index) closed the day off -0.32% – compared to the -3% that global markets were threatening earlier in the day.
(b) The Nasdaq did in fact close green!
(c) Although ASHR (China ‘A’ Shares) closed red, FXI (China ‘H’ Shares) closed green.
(d) After hours futures for the SPX/ DJIA are +20 points/ +200 points higher, which places the SPX in green territory.
It should be emphasized that this bottom spotting model is based on *weekly* data. Daily values of !BINYBT would yield many more signals (and possibly go against the IT aims of the model).
Is there a reason to prefer $NYSI to, say, !MCSUMRNYC or even !MCSUMRSPX?
I just show it on a weekly basis for purposes of clarity. It is actually a daily model. Conclusions are the same.
Ah, got it, thanks.
I have just have a look on weekend indicies – http://www.ig.com to find out they are again down approx 2%. Sounds horrible.