Preface: Explaining our market timing models
We maintain several market timing models, each with differing time horizons. The “Ultimate Market Timing Model” is a long-term market timing model based on the research outlined in our post, Building the ultimate market timing model. This model tends to generate only a handful of signals each decade.
The Trend Asset Allocation Model is an asset allocation model which applies trend following principles based on the inputs of global stock and commodity price. This model has a shorter time horizon and tends to turn over about 4-6 times a year. In essence, it seeks to answer the question, “Is the trend in the global economy expansion (bullish) or contraction (bearish)?”
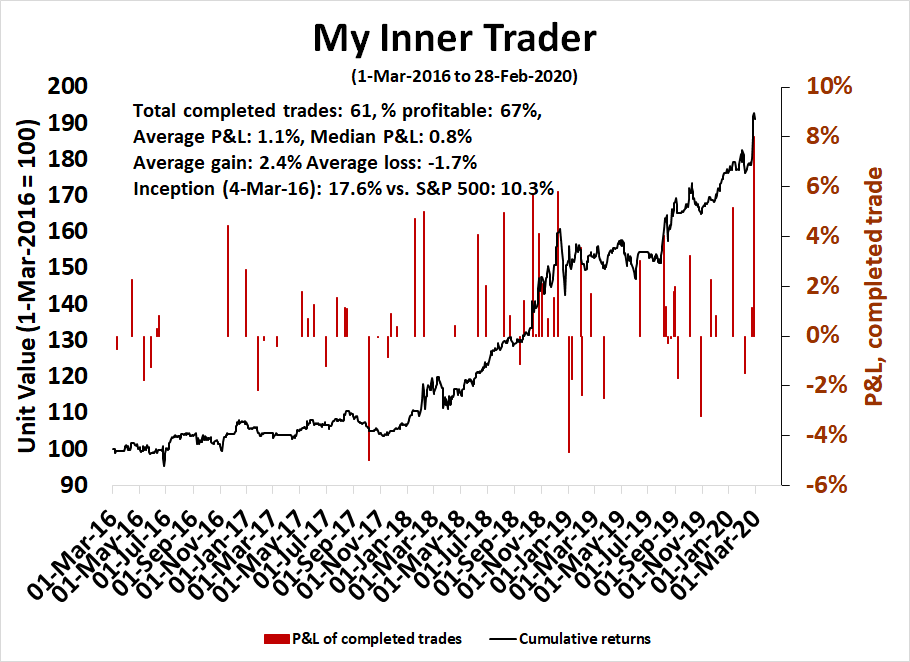
My inner trader uses a trading model, which is a blend of price momentum (is the Trend Model becoming more bullish, or bearish?) and overbought/oversold extremes (don’t buy if the trend is overbought, and vice versa). Subscribers receive real-time alerts of model changes, and a hypothetical trading record of the those email alerts are updated weekly here. The hypothetical trading record of the trading model of the real-time alerts that began in March 2016 is shown below.
The latest signals of each model are as follows:
- Ultimate market timing model: Buy equities
- Trend Model signal: Bearish (downgrade)
- Trading model: Bullish
Update schedule: I generally update model readings on my site on weekends and tweet mid-week observations at @humblestudent. Subscribers receive real-time alerts of trading model changes, and a hypothetical trading record of the those email alerts is shown here.
Fun with mystery charts
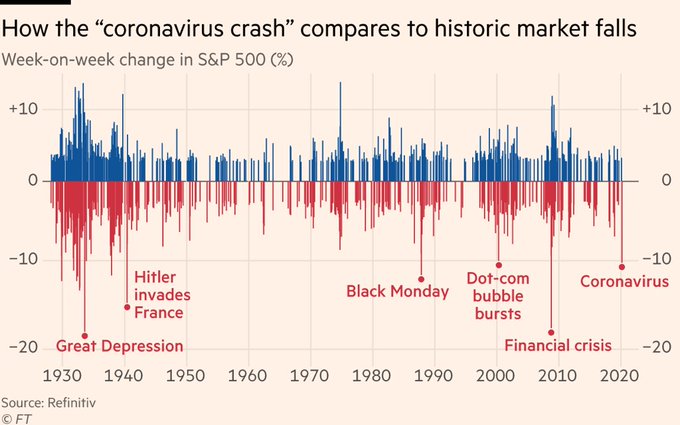
This time last week, I was cautiously bearish (see Correction ahead?), but I never imagined that stock prices would crater as far as they did. My social media feed is full of narratives of how unprecedented and insane the market decline has been. One such example is the comparison of the “coronavirus crash” to other major market events in the last 100 years.
This week, rather than just dwell on how extreme last week’s market action was, I would instead like to put on a technical analyst hat and consider the following three mystery daily charts. Which would you buy, or sell? Which is your favorite? Did you wish you had bought one or all of time in the past two weeks?

The analysis is far more revealing about market internals and likely future action than more hand wringing about how oversold and washed out the stock market has become.
Answer is below – no peeking now!
Mystery charts revealed
Here are the mystery charts, revealed.
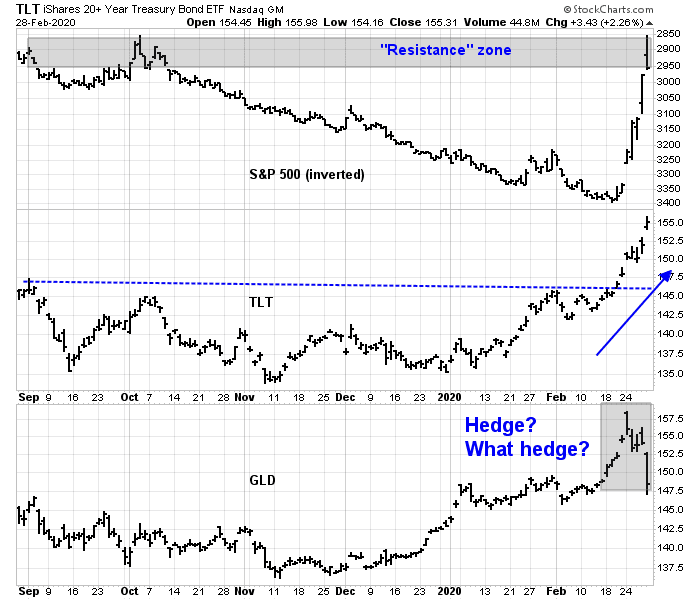
The top chart is the inverted S&P 500. Sometimes analyzing a chart upside can be more revealing than seeing it right-side up. The upside down chart shows the index in a parabolic and extended move. The index is now encountering a “resistance” zone where the “rally” may stall. If you own stocks, do you feel a bit better about that analysis now?
The middle chart is the price of the long Treasury bond, as represented by the ETF TLT. It is behaving more or less in a way that you would expect an equity market hedge to behave. As stock prices weakened, TLT staged an upside breakout about 10 days ago. Even so, there were some anomalous signals from the bond market that could give equity bulls a ray of hope (more on that below).
The bottom chart is gold. As expected, gold prices shot up when stocks cratered, but a funny thing happened. Gold fell, which is not what you expect an equity hedge to do. Joe Wiesenthal at Bloomberg explained the anomaly this way:
Earlier this week I wrote about gold, and how it’s a good volatility hedge, but only up to a point. It stops being a good volatility hedge when you start getting anxious about managing cash flow and paying your bills. Since the world runs on U.S.-dollar denominated liabilities, when the bill collector (or the tax collector, or the margin clerk, or the landlord) comes knocking, you need cash. And selling gold might be one of your only options. We might be seeing a little bit of that effect emerge. This morning markets are selling off again, and Treasuries are surging, and yet gold is red.
In other words, when the margin calls arise and all correlations go to 1, gold prices will get taken down. Such episodes are usually seen at the tail-end of market sell-offs, when the margin clerks take over and price insensitive selling takes over. That’s usually a signal of a short-term bottom.
A climactic reversal?
The market is obvious very oversold. Only 0.4%, or two stocks, in the S&P 500 are above their 10 day moving average. There have only been two similar episodes in the last 5 years, and both saw the market stage relief rallies almost immediately.

Friday’s market action may be the signals of a possible climactic reversal by tracing out a hammer candlestick on Friday. The market gapped down and fell hard at the open. It proceeded to chop around and strengthened at the end of the day with a close that was significantly higher than the open. While hammer patterns are often signs of selling exhaustion, some doubt could be cast on the pattern because it occurred on a Friday. The end of day rally could be the result of short covering by traders who did not want to enter the weekend with a short position because of event or announcement risk.
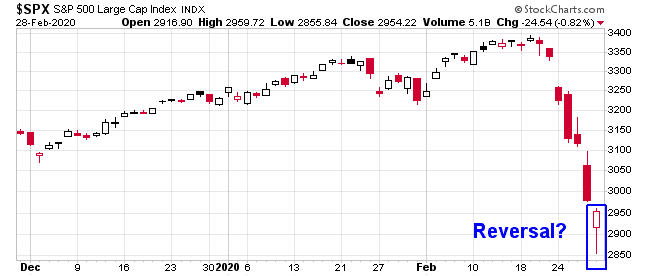
One reason for the late day rally was the central bank response to the market’s risk-off tone. Global central bankers have pumped billions of liquidity into the financial system, and there were rumors of an announcement of coordinated easing on the weekend.

This possible price reversal that needs to be confirmed by market strength on Monday. Otherwise, all bets are off.
Green shoots
The astute technician can find selected green shoots for the bulls if he looked in the right places. I pointed out yesterday that the cyclically sensitive copper price managed to hold support, which is constructive for signs of cyclical strength.

As well, has anyone been watching the yield curve? The 3m10y had inverted, which was freaking out some traders worried about a recession. But even as stock prices cratered, did anyone notice that the 2s10s and 10s30s were steepening? A steepening yield curve, even when bond prices are rallying (and therefore yields are falling, see above TLT mystery chart), is usually a signal that the market expects accelerating growth.

The Fear and Greed Index is now below 20, which is a necessary but not sufficient condition for a market bottom.
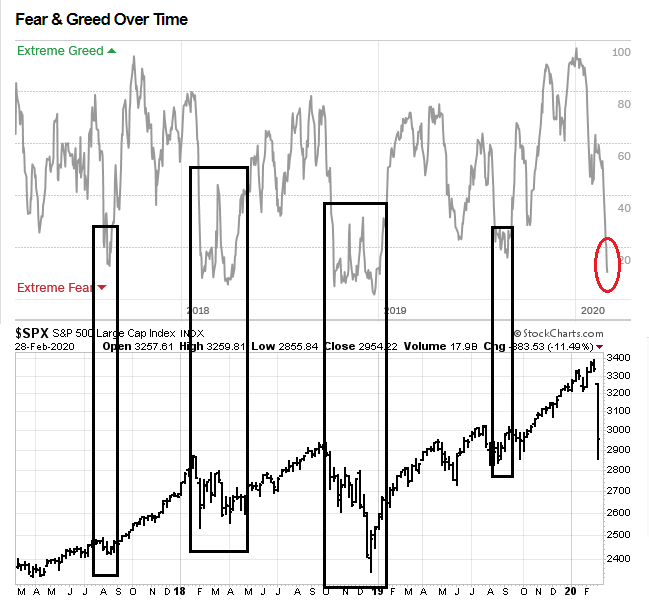
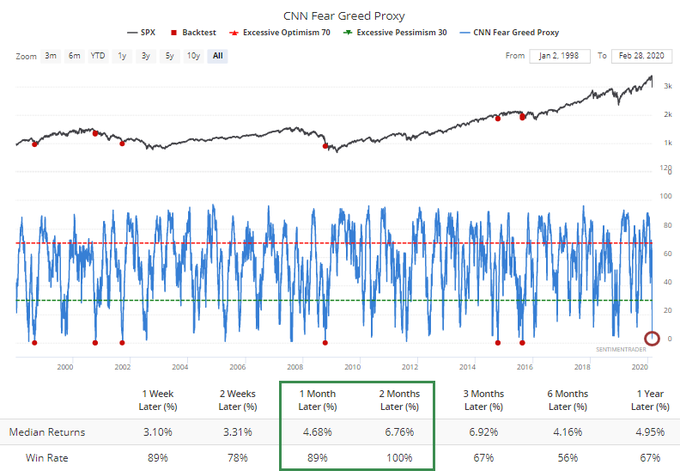
In fact, SentimenTrader‘s Fear and Greed proxy reached a reading of 0 on Friday. Past episodes have been resolved with strong positive returns.
An imminent bounce?
I could go on and on about how stretched fear and technical indicators are to the downside. The blogger Macro Charts wrote this weekend that his core indicators are all “max oversold”. His analysis is well worth reading in its entirety, but here is the summary:
- One of the steepest 1-week market plunges of all time could be nearly over – Nasdaq futures even briefly exceeded the worst 1-week loss in October 2008, the core of a historic Bear market.
- Extreme and historic oversold signals are being generated across nearly all core datasets I run & monitor.
- Based on prior historic signals, there is a chance (no guarantee) markets bottom and reverse very soon – need to monitor for price reversals to confirm the turn.
- The subsequent rally could very quickly retrace at least half of the decline within a very short period. Again, no guarantees.
- How the leading Stocks (particularly broad Tech) behave over the next several weeks will be key for the market to repair the damage and re-establish the foundation for a bigger rally into potentially Q2-Q3.
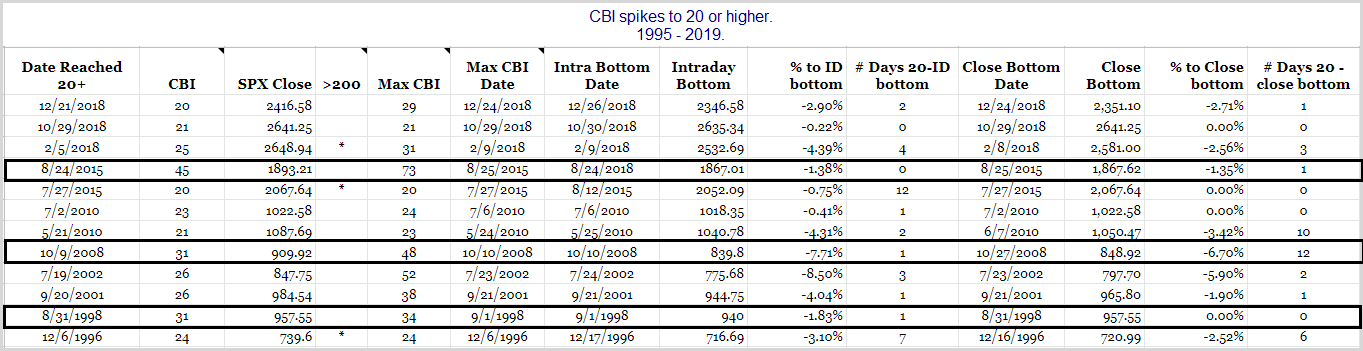
Rob Hanna at Quantfiable Edges observed that his Capitulative Breadth Index (CBI) was on track to spike to 39 on Thursday, where normally a CBI of 10 or more is a buy signal. He went on to list the occasions when CBI was over 20. I have highlighted the three instances when CBI was 30 ore more. Though the sample size is extremely small, my unscientific small sample conclusion is, unless you believe that this is 2008 all over again (and we haven’t had a Bear Stearns or Lehman Brothers failure that could spark a panic), a relief rally is imminent.
The Trend Asset Allocation Model has turned bearish. This is a trend following model that is slow at turning points, which is a feature, not a bug. My inner investor was already neutrally positioned before the stock market carnage, and the decline has already naturally lowered the equity weight in his portfolio and raised his bond weight. He will maintain a risk-off stance, and he expects to reduce risk on any equity rally that may occur in the near future.
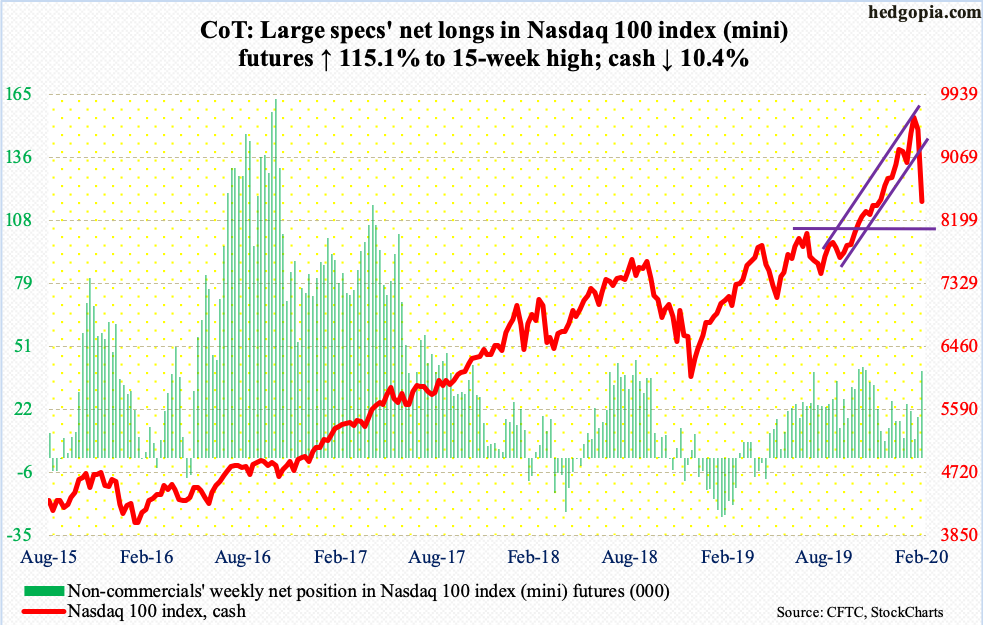
The market may bounce next week, but the rally is unlikely to be durable. One worrisome sign for the bulls is hedge funds are still bullishly positioned. The fast money have not capitulated out of their long positions. The Commitment of Traders report (from Tuesday) shows that large speculators, which are mostly hedge funds, are still net long high beta NASDAQ 100 futures.
Subscribers received an email alert on Thursday that my inner trader had dipped his toe in on the long side of the market. My inner trader is bullishly positioned, but with a lower than normal position size because of high market volatility.
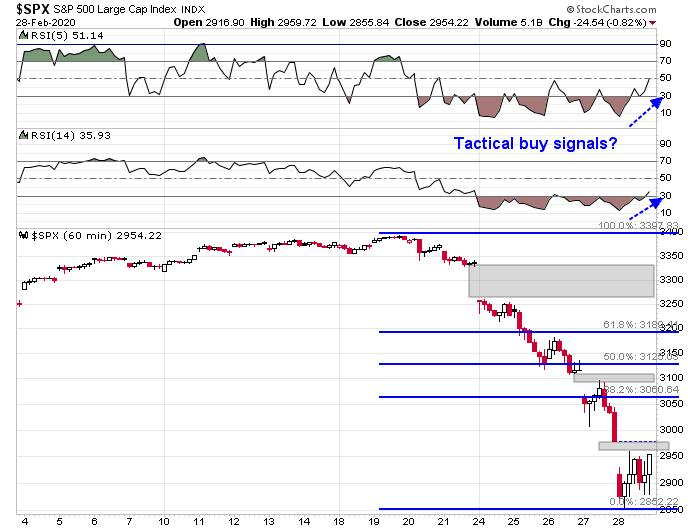
An analysis of the hourly S&P 500 chart shows that both the 5 and 14 hour RSIs have recycled, which are tactical buy signals. It is difficult to set an upside target as there are many downside gaps that could be filled. A reasonable guesstimate would be a 50% retracement of last week’s move at 3125.
Needless to say, there are no guarantees in such an uncertain environment.
Disclosure: Long SPXL
There is a host of unknowns about Corona virus. That said, what no one seems to be talking about is the seasonality of viral illnesses that seem to peek their ugly heads in the winter and mysteriously disappear in the spring.
So, would Corona virus severity slowly reduce in the next few weeks? What would happen in such a scenario? It is easy to get carried away looking at social media posts and panic. However, ground level reality is that life goes on in the US, as it always did. The Joe six pack who does not jet set to the other part of the world, is still unaffected. So, yes a 50% retracement may take place, but perhaps, we may have bounced off the congestion zone (around 2850). Yes, a retest of this level in the coming weeks may be highly desirable.
Seasonal stock market patterns usually indicates March to be a good month, with the first week of March being a time frame where major market bottoms are made (2003 and 2009 bear markets bottomed out circa 6-10th March).
Sure, the election year seasonally is there and Tuesday this coming week, may dictate the directionality of the markets as well.
It may be wishful thinking on my part, but Corona virus epidemic came from no where. Previous epidemics seem to have disappeared on their own, without explanations. Perhaps, the 50% retracement may be a conservative target. So far, the weekend headlines have been pretty mundane, in this respect.
hi D.V., the seasonality of Corona viruses is well-known. They are happy from November to March — they thrive in cold dry air, while the transmitted droplets seem to lose their oomph when it’s wetter. Also, they dislike UV light.
The known unknown is whether Covid-19 will behave similarly to other Coronoa viruses. I suspect it will.
The unclear thing is why so many folks got afflicted in Singapore, where it’s always wet and warm. Two plausible reasons: excellent diagnosis — even people with a little sniffle get tested. And too much air conditioning.
That still doesn’t explain why there are hardly any cases across the border in KL.
Nobody knows anything for sure. But I certainly dislike comparisons to the Spanish Flu. During the 1918 pandemic, most people died from superinfections — bacterial ailments that hitched to the influenza sickness. Antibiotics are a common cure to that nowadays.
Thanks Martin. It appears the cases are far and few between close to the equator, where temperatures tend to be high. Mexico is a good example.
Furthermore, it appears (from Seattle), that there is transmission of this without international travel.
I am trying to find the answer to this puzzle. So far, no expert has taken a stand that the virus will die down in northern hemisphere as the temperatures rise. I surely hope so.
I think the reason for fewer cases in Mexico and many other developing countries may be lack of testing and not the lack of cases. I will take fewer infections over there with a grain of salt.
One thing we need to worry about if whether the virus will re-emerge in the fall months as the temperatures drop again.
Singapore has seen a spate of infections, and it is a developed the economy in a warm climate. Arguably, Singapore has lots of AC. The evidence isn’t clear at all how COVID-19 behaves when the temperature heats up.
This preliminary and unpublished paper suggests that there is no connection between humidity (not heat) and infection rates.
http://www.people.fas.harvard.edu/~msantill/Mauricio_Santillana/Publications_files/Luo_et_al_2020_Absolute_Humidity_R0_COVID-19.pdf
Thanks for sharing the study. Will read it tomorrow.
This is so funny! Compare the title of this video to the message of the guest. According to him, it is much ado about nothing.
http://www.pbs.org/wnet/amanpour-and-company/video/dr-paul-offit-why-coronavirus-will-be-hard-contain-nqqvbv/
He is more worried about regular patients losing care to coronavirus victims even though the former may need more care.
Just another data point…
Hi Cam,
Quick question, not sure if it’s pertinent, How does Long term MACD signal (which was triggered, I think about 6 months ago)look in such scenarios? Does it turn negative? And how does it look when compared to history of the signal?
Please disregard if I am asking a stupid question.
Thanks.
Monthly MACD hasn’t had a negative cross yet (Monthly ones are slow to react lol).
Kevin,
thanks for clarifying the confusion on my end as to what MACD stands for. =)
Feb 28, 2020 28.05. That is the latest Shiller P10 reading. For the first time since Trump was sworn in, the Shiller P10 is lower than when he took office. Time to go long?
If you are worry about the coronavirus, go to the Chinese registry of clinical trials, there are about 300 trials for covid19 going on since January, 22 trials on chloroquine alone. Chances are good the Chinese would have an effective treatment by Fall if not sooner. Don’t count on any rapid response from the USA though, there is only one biologic intervention clinical trial that is just beginning to recruit in the US.
http://www.chictr.org.cn/enIndex.aspx
Hi Cam, thank you for the great & hard work.
Would you be willing to share some thoughts on what technical/macros you will pay attention to over the next few months, to determine if this is just a quick correction or a much more serious bear market like what we haven’t seen since 2009.
Thanks.
The single most important question for me: has the high for the SP 500 been put in for this business cycle?
The answer may be more fundamental than technical. The CDC says it has only tested 500 people for the virus in the US. Cases in the US could be seriously under reported. The market will have to withstand a daily media barrage of new cases and macro economic data releases in future weeks/months that reflect lessened global and US economic activity.
Has does the market put in a new high before it has time to “discount” that the US is “over the hump” as regards virus detriments to the economy?
Reuters reporting that the BOJ bought stock ETFs this morning. Does this mean that stocks are now a risk-free investment and traditional valuation models need to be questioned?