Preface: Explaining our market timing models
We maintain several market timing models, each with differing time horizons. The “Ultimate Market Timing Model” is a long-term market timing model based on the research outlined in our post, Building the ultimate market timing model. This model tends to generate only a handful of signals each decade.
The Trend Asset Allocation Model is an asset allocation model which applies trend following principles based on the inputs of global stock and commodity price. This model has a shorter time horizon and tends to turn over about 4-6 times a year. In essence, it seeks to answer the question, “Is the trend in the global economy expansion (bullish) or contraction (bearish)?”
My inner trader uses a trading model, which is a blend of price momentum (is the Trend Model becoming more bullish, or bearish?) and overbought/oversold extremes (don’t buy if the trend is overbought, and vice versa). Subscribers receive real-time alerts of model changes, and a hypothetical trading record of the those email alerts are updated weekly here. The hypothetical trading record of the trading model of the real-time alerts that began in March 2016 is shown below.

The latest signals of each model are as follows:
- Ultimate market timing model: Buy equities
- Trend Model signal: Bearish
- Trading model: Bullish
Update schedule: I generally update model readings on my site on weekends and tweet mid-week observations at @humblestudent. Subscribers receive real-time alerts of trading model changes, and a hypothetical trading record of the those email alerts is shown here.
Here we go again?
For two consecutive Fridays, the market has rallied into the close to exhibit hammer-like reversal candles. The first candle reversal was confirmed by a massive 4.3% surge on the following Monday, will the same happen this coming Monday?

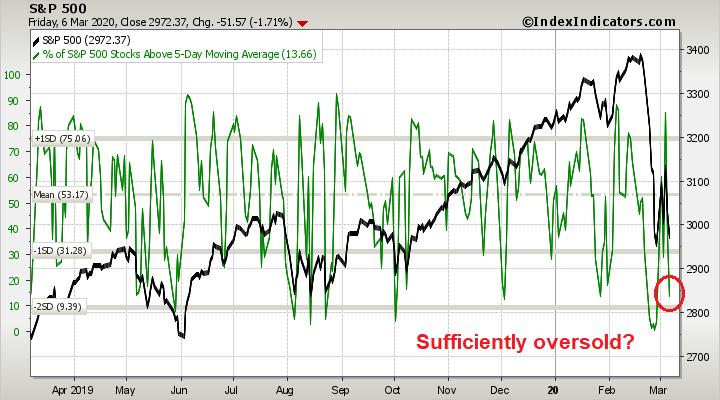
While I am cautiously bullish at a tactical level, it could also be argued that the market has not sufficiently tested the February lows. Should stock prices retreat to test those lows early next week, the bulls can take some comfort that any test would likely be accompanied by positive 5 and 14 day RSI divergences. On the other hand, the bears are likely to defend the highs set in the rally last week, which could make trading the market an interesting challenge.
Investors and traders should brace for more thrills from the market roller coast.
Sentiment buy signals everywhere
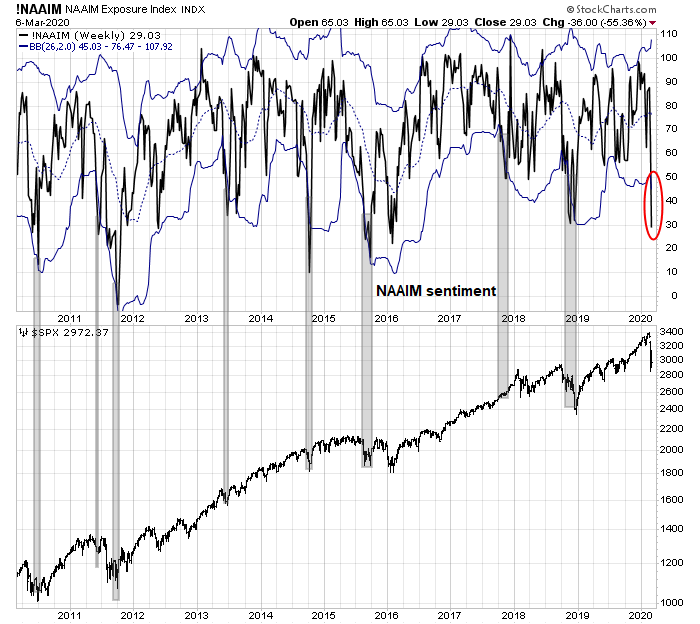
Sentiment buy signals are popping up everywhere. One useful sentiment indicator is the capitulation shown by the NAAIM Exposure Index, which measures the views of RIAs managing individual client funds. This index skidded below its 26-week Bollinger Band, which historically has signaled good bullish entry points to the stock market.
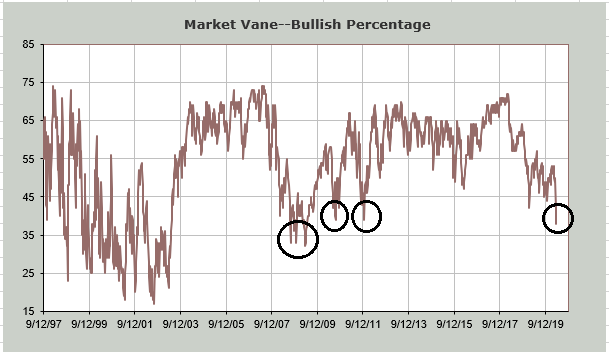
Similarly, Market Vane bulls has fallen to the levels last seen in 2010 and 2011. Readings were only exceeded by the market crash of 2008-09.
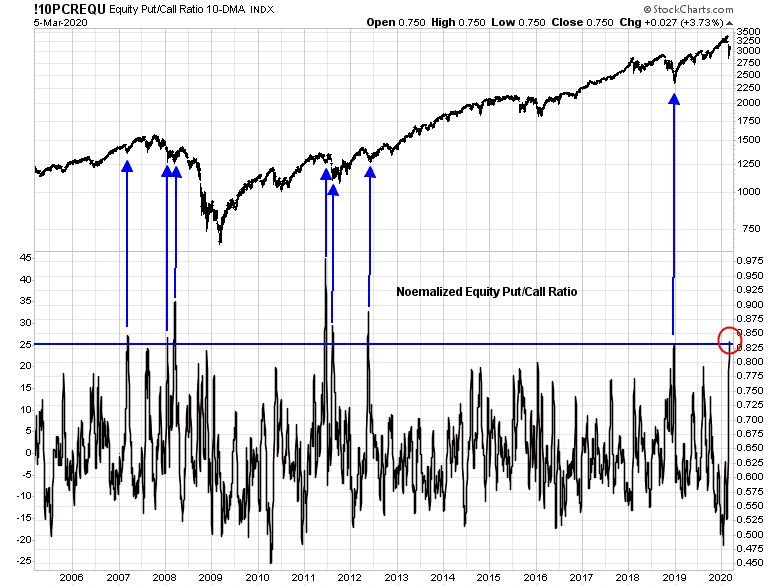
The normalized equity-only put/call ratio has spiked to levels that has marked tradable bottoms in the past.
The VIX Index spiked over 50 last week, which is extremely high by historical standards. It did not even reach these levels during the Russia Crisis, or the NASDAQ top of 2000. Similarly, the degree of VIX term structure inversion has only been exceeded during the market crash during the Great Financial Crisis.

Sentiment models are very washed out.
Momentum sell sginals
Arguably, this time is different inasmuch as the market pullback is occurring in conjunction with a Fed inter-meeting rate cut. The Fed doesn’t usually just cut rates out of the blue, this was an emergency action. The word “emergency” should be a flashing warning that there is something seriously wrong with the economy.
From a long-term technical perspective, the monthly MACD model has negated a recent buy signal and flashed an interim sell signal for the market, which can only be confirmed if the index closes at these levels at the end of March. Past buy signals have usually led to prolonged bull phases, and this potential bearish development is highly unusual.

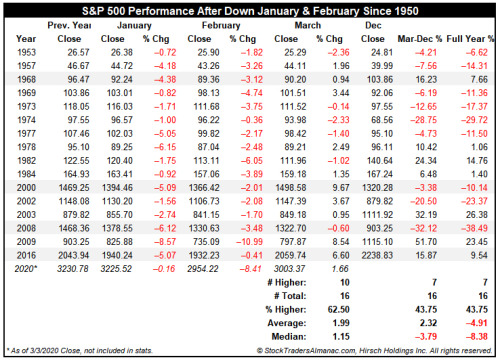
MACD sell signals are the result of negative price momentum. As an example of negative price momentum, Jeff Hirsch found that the combination of a down January and down February has led to subpar equity returns for the remainder of the year.
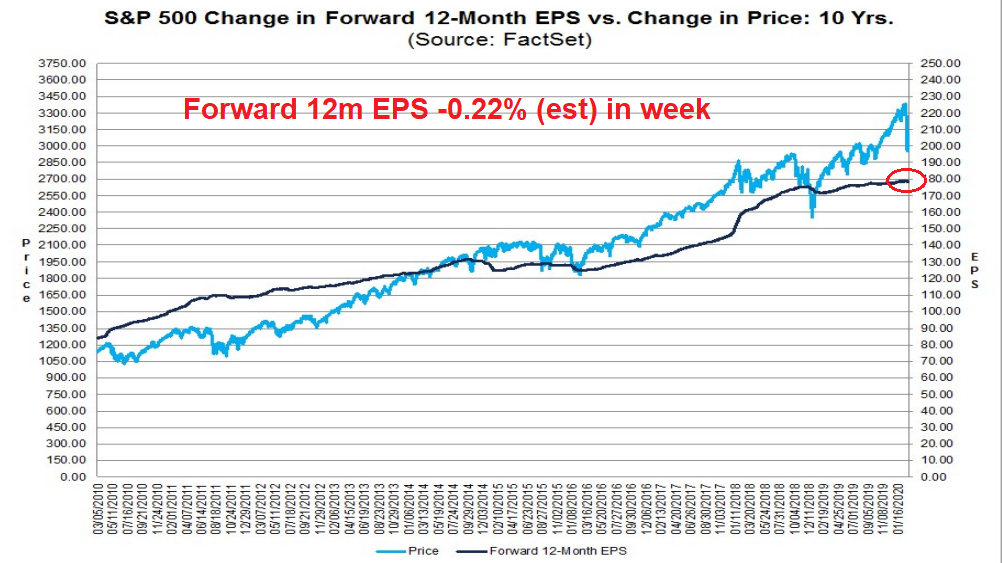
There are also worrisome signs from fundamental and macro perspectives as well. FactSet reported that Street analysts are starting to downgrade their earnings estimates, indicating bearish fundamental momentum.
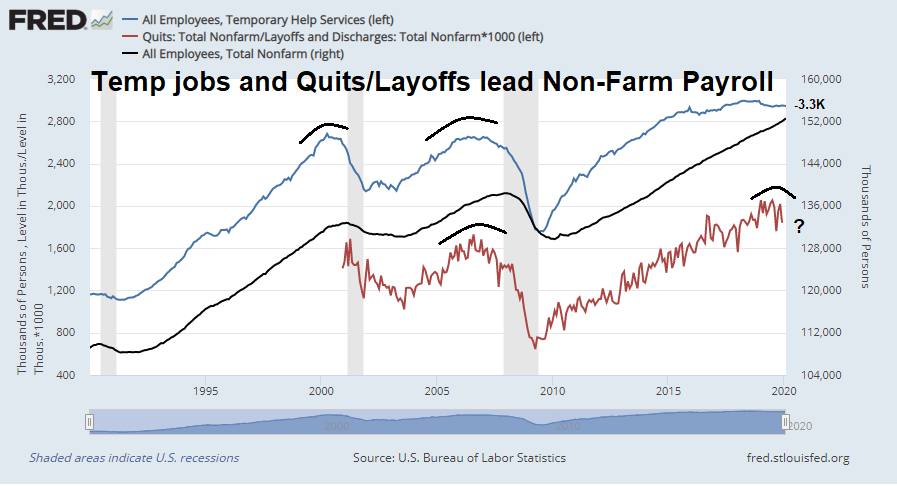
In addition, some cracks are appearing in the labor market. Despite the blow-out Jobs Report, leading indicators such as temporary employment, and the quits to layoffs rate (which will be updated next week in the JOLTS report), are exhibiting signs of weakness. These troublesome signs are showing up during a period that pre-dates any effects of the COVID-19 outbreak in the US. What happens in March, when the full effects of the coronavirus slowdown hit the economy?
Bull or bear?
Here is how I resolve the bull and bear cases. Arthur Hill at StockCharts questioned the usefulness of traditional technical analysis techniques because he believes that the market environment has switched from bull to bear:
Support levels and bullish retracement zones are questionable, at best, in bear market environments. Why? Because the path of least resistance is down in a bear market. As such, the odds that a support level holds or a bullish retracement zone leads to a reversal are greatly reduced. The odds favor bearish outcomes and bearish resolutions during bear markets.
Even though the S&P 500 is battling its 200-day SMA this week, I am in bear market mode because the breadth models at TrendInvestorPro.com turned bearish for the first time since early September. This means support levels and bullish retracement zones are much less reliable.
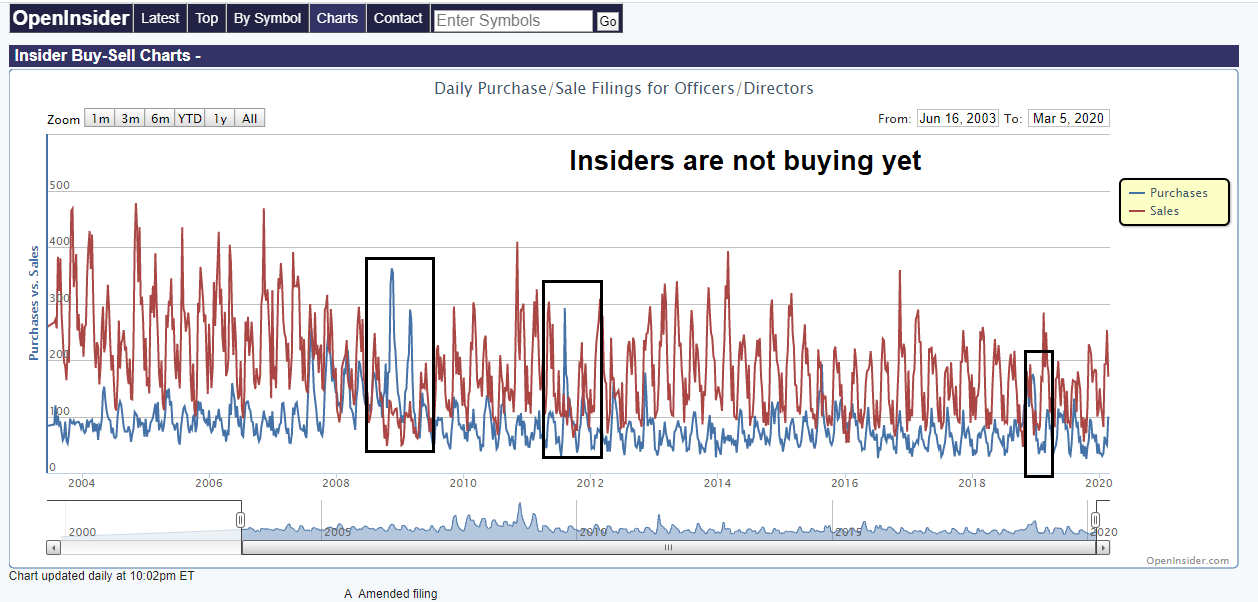
If a bear market has indeed begun, one sign of a bottom is insider buying. There were clusters of insider buying during 2008, 2011, and in late 2018. There is no such signs today.
While I am not ready to officially declare a bear market, or a recession just yet, traders should prepare for bear market style volatility, at least for risk control purposes.
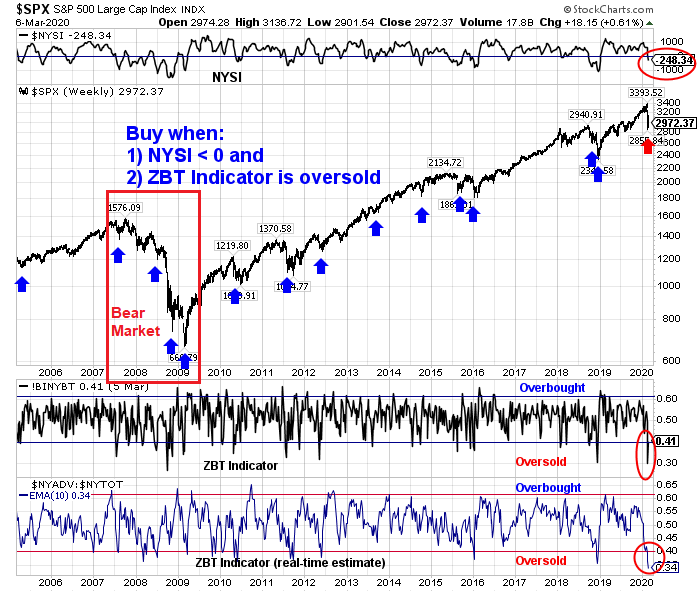
Here is how that scenario would play out in the context of my Ultimate Intermediate Bottom Spotting Model. This model flashes a buy signal whenever both the Zweig Breadth Thrust Indicator becomes oversold (check), and the McClellan NYSE Summation Index (NYSI) is negative (check). This model flashed four buy signals during the bear market of 2007-09. In each case, the market staged a relief rally, but the rally failed as stock prices retraced the gains to new lows in each of the cases.
Looking to the week ahead, the market reached an oversold condition consistent with a relief rally. While short-term breadth could weakens slightly further, downside risk is relatively limited.
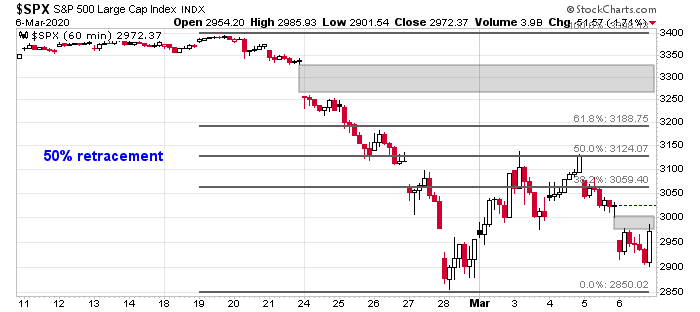
The hourly S&P 500 chart provides some guides to rally targets. At a minimum, the gap at 3000 should be filled. The 50% retracement level of 3124 had acted at resistance in the past, and the bulls will find it to be a formidable obstacle. Above 3124 is the gap at 3260-3330 that needs to be filled, followed by a test of the old highs. I am not holding my breath for an advance beyond the 50% retracement level.
My inner investor is adopting a risk-off profile in his portfolio, with an underweight position in equities. My inner trader took and initial long position on Friday. Should the market weaken further early in the week and the market continues to exhibit positive RSI divergences, he will add to his long positions.
Disclosure: Long SPXL
The two hammer reversals are as classic as they get, no question about it (as far as short term trades go). That said, VIX needs to come down, breadth needs to broaden, insiders need to start buying, bad news on the Corona virus needs to go to page six not page one, for a more comfortable buy zone.
Let us mark 28th February and venerable 6th March as a double bottom and see how far these levels hold in the coming months. 6th March marked the bottoms of 2003 and 2009 bottoms, hence has an uncanny relevance in my mind, despite a sample of two. Past pandemics like MERS, SARS etc. would tell us, that it may be few more weeks to months before all is said and done, to get to a durable bottom.
Note in the above graph, a formidable resistance coming into play at 50% retracement (3125); market has been buffeted back three times at this level!
ZBT buy signal and 2008: The collapse of the banking system was unique to that time frame. Are we seeing such conditions now, that may compound the forthcoming earnings recession, causing a 50-60% drop?
I understand a hair cut of 10% in S&P 500 EPS to say 160 $ per share, with say a PE of 15 ( = 2400), but would it really go down to a 10-13.5 PE ratio?
The RSI is path dependent. E.g. take the 5 days since the low on 2020-02-028, and use RSI5: Re-arranging the order of inputs yields a range of endpoints from 29.7 to 53.9. (Use with care.)
Moreover, RSI drifts towards 50 with neutral inputs. The tests below assume a closing value of the SPY the same as the opening value.
Making the daily inputs 0 (x5 days) yields the same RSI as at the start. This is because the two buckets internal to the methodology decay at the same rate and their ratio remains constant. Making the daily inputs 0.4 (% up and down) yields RSI of 24.0. (The two buckets have different start points and relative inputs.)
The RSI drift means that there will be a divergence range if the SPY ends up lower than the start, but not as now (whatever “divergence” implies in this case).
I worked via a percentage conversion, so figures may not match exactly.
and for lesser mortals, like me, what is your conclusion?
Conclusion at end.
Retest fails – divergence – market up?
Not sure what you mean by a fail of the retest, but the market goes up, but we are likely to get a hard retest on Monday because of oil price war induced selling.
Cam,
What would you like to call it when the market drops through the level of the initial low? That is what I mean. And a divergence must be positive when there is a divergence. And a divergence refers to the sense of the direction of the function vs. the RSI. I put it to you that there will be a divergence for a range of function after dropping through since the RSI will be pointing upwards, and conversely, no divergence before that. (Such a divergence test is redundant, because one expects that the market is more likely to drop after dropping.) And anyway, does this describe the test you had in mind?
I know that RSI divergence was used initially to alert users that the momentum of the chart was changing. But here is the thing: it is easy to see this with the naked eye – the slope changes. In some more subtle cases the user is exhorted to confirm an indication with other means, since it is only an indication.
Please explain how you extend the divergence test to a case where slope of function is not the issue, rather the sense of probable movement, and how you allow for the fact that the RSI will be biased upwards by the drifting effect.
RSI is a momentum indicator. If the index falls below a level, but RSI is still rising, that is a positive divergence, by definition.
The cost of buying protection (whether in fhe form of puts or bonds) is so high right now that I have a hard time believing it’s a good time to sell stocks.
And naturally the markets couldn’t care less what I believe – based on current indications, Friday was a great time to buy puts or bonds!
An undercut of the 2855 low (which we already have) + a recovery (to be determined) in the overnight session would be nice.
Cam,
Thanks for your excellent analysis, as always. Reading your blog keeps me sane and disciplined. Great service.
I am seeing more and more experts virus to burn out as temperature rises in the northern hemisphere. Here is the transcript of a call organized by CLSA with John Nicholls, a pathology professor at the University of Hong Kong.
A few excerpts:
“Three things the virus does not like: 1. Sunlight, 2. Temperature, and 3. Humidity,” Nicholls said in response to a question about when he thinks confirmed cases will peak.
“Sunlight will cut the virus’ ability to grow in half so the half-life will be 2.5 minutes and in the dark it’s about 13 to 20 [minutes],” Nicholls said. “Sunlight is really good at killing viruses.”
For that reason, he also added that he doesn’t expect areas such as Australia, Africa and the Southern hemisphere to see high rates of infection because they are in the middle of summer.
“The virus can remain intact at 4 degrees (39 degrees Fahrenheit) or 10 degrees (50 F) for a longer period of time,” Nicholls said, referring to Celsius measurements, according to the transcript. “But at 30 degrees (86 degrees F) then you get inactivation. And high humidity — the virus doesn’t like it either,” he added, the transcript of the call showed.
“I think it will burn itself out in about six months,” Nicholls said.
https://www.accuweather.com/en/health-wellness/coronavirus-expert-says-the-virus-will-burn-itself-out-in-about-6-months/679415
https://www.fwdeveryone.com/t/puzmZFQGRTiiquwLa6tT-g/conference-call-coronavirus-expert
Cam,
Regarding point 2. You can’t still pretend I don’t know the RSI. It contains Exponential moving average(s). Therefore it would be most unusual for the index to fall below a level while the RSI is still rising.
However, the rest of your reply is of interest.
What you are describing is probably called hysteresis. The output number depends not just current inputs also past inputs. In layman’s term: residual effects. So yes, it is path dependent. Impossible to quantify to a very minute details. But I always assume that current inputs are greatly influenced by past inputs, so more or less accept current output numbers.
Until the high yield spreads start to narrow I’d recommend trading in a bear market manner. The big risk is the siezing up of the corporate credit market. New issues have stopped which hurts the rolling over of maturing debt. A buyer’s strike and outflows from junk bond ETFs could be very disruptive. With the plunge in oil prices many energy companies will default.
Go to the Federal Reserve Bank of St. Louis and get the BBB and CCC spread charts sent to you daily when you sign up free.
A good reminder from Cam and Jeff Hirsch that showed the combination of a down January and down February has led to subpar equity returns for the remainder of the year resulting median is -3.8% (Mar-Dec) and -8% (full year). If you pay attention to the year 1969, a year that most of Wall St. has forgot, which started with an all time high in the S&P in the last days of 1968 and then the Hong Kong influenza which started earlier in July of 1968 and the same virus returned the following years: a year later, in late 1969 and early 1970, and in 1972, killing nearly 1 million worldwide in total. The market lost nearly 38% by June of 1970 and the US also entered a recession. For 1969 the market returned -6.2% (Mar-Dec) and -11.4% (full year). The good news was that the market reached a new all time high soon after on Jan 1973 after the re-election of a Republican president but lost it all again by Oct 1974 (Nixon resigned in Aug 1974). Maybe history will repeat itself by 2022? But who are we kidding?
Unfortunately, the Saudi / Russia dust up seems to be a bit of a ‘black swan’. The futures today do not seem to be too happy and oil is currently down about $9.
The corona virus doesn’t seem to be letting up, either.
Think I will stay on the sidelines a bit longer.
S&P 500 futures -125.50. 5% limit down is 2819, not too far below where we are right now at 2839.
You guys think so linearly. Wait for Trump to tweet something and call out the PPT.
You are absolutely right. How foolish of me to miss that point.
Absolutely right. Tax cuts are probably round the corner (gulp!), and some other choice words against the Fed Chairman.
https://www.yahoo.com/finance/news/helicopter-money-monetary-fiscal-stimulus-trump-fed-powell-support-yardeni-161655489.html
Perfect. That will solve it. Job well done!!
I like that idea!
I’m pretty sure a wave of mortgage refis are around the corner, quite a stimulus in and of itself. If we add tax cuts/ tax rebates, reinstitute education credits, and perhaps leverage the coronavirus crisis and/or the oil shock into serious efforts at reforming health caare or replacing America’s aging infrastructure – we might be looking at double-digit returns in the stock market by year end.
The sharp drop in oil is worrisome. Are some hedge funds going to collapse and take down the broader market?
Cam,
Thinking beyond tomorrow, you once pointed out that TSLA was a canary in the coal mine because of debt load.
Is this still true, and how do you interpret the stock’s sideways proportional performance vs S&P ?
TIA, Wes
https://www.marketwatch.com/articles/is-the-stock-market-crashing-heres-when-s-p-500-circuit-breakers-kick-in-51583717721?mod=mw_latestnews
Trading technicals is hard in a news driven market. I don’t think the bad coronavirus news is going to let up until at least next month. We’ll get a summer rally followed by a fall re-crash UNLESS – a viable vaccine is announced nearing end of trials. Cam will have a well thought out plan to lead the way through this maze.
What do you folks think of Jens Röder’s projections? He says, left to itself, Covid-19 doubles every two days, leading to exponential growth, until it ends “naturally”. According to him, there is another 80 or so days of exponential growth in North America. Now guess what that means if infections double every two days.
https://elm.nsupdate.info/virus/continental-13.png
https://www.marketwatch.com/articles/is-the-stock-market-crashing-heres-when-s-p-500-circuit-breakers-kick-in-51583717721?mod=mw_latestnews
A 20% intraday decline will retest the December 2018 low (2373). Let us see if we get it today or this week.
I would like to refer those interested in Meb Faber’s book titled Global Asset allocation. I have referenced this book earlier and I am doing so again, in the context of extreme stock market volatility that we are seeing. This book was an eye opener for me, that lets me sleep well at night, no matter where stocks are on a day to day basis.
https://quantifiableedges.com/big-gaps-down-in-already-bad-markets/
But pay attention to his first note: ‘These numbers look pretty wonderful. Don’t get too excited.’
I’ve stopped buying stocks at this point. I thought the market was crazy 2 weeks ago. Limit down doesn’t inspire confidence.