Two weeks ago, I rhetorically asked if investors should be buying into the cyclical recovery theme (see Buy the cyclical and reflation trade?). Global green shoots of recovery were appearing, but I identified the “uncertainty of additional fiscal stimulus” as a key risk to the cyclical rebound thesis. Now that Biden appears to be winning the White House, but constrained by a Republican-controlled Senate, it’s time to revisit the recovery question.
Regular readers know that I consider the global economy as three trade blocs, NAFTA, Europe, and Asia dominated by China. It is within that framework that I examine the global reflation question.
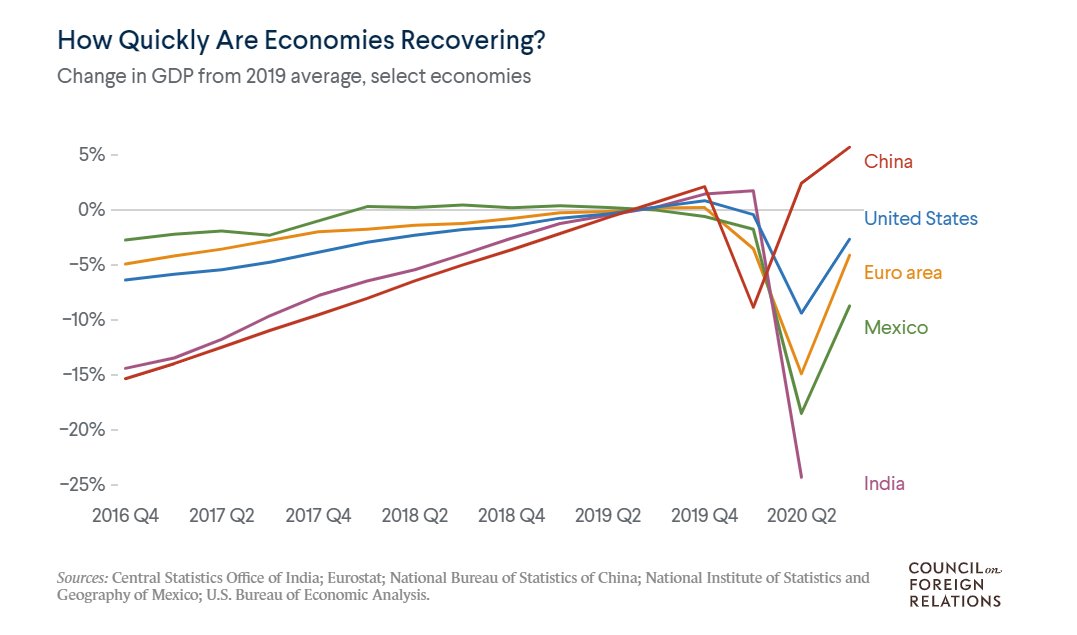
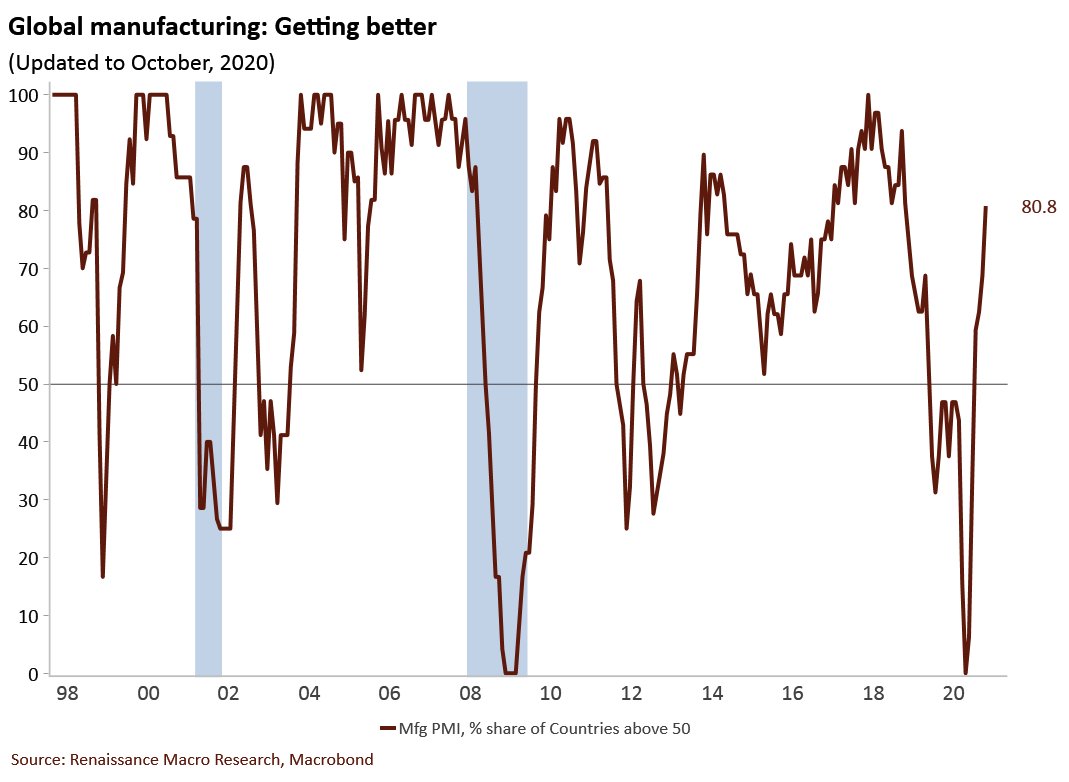
Is the global economy emerging from a global recession?
Europe: A new lockdown
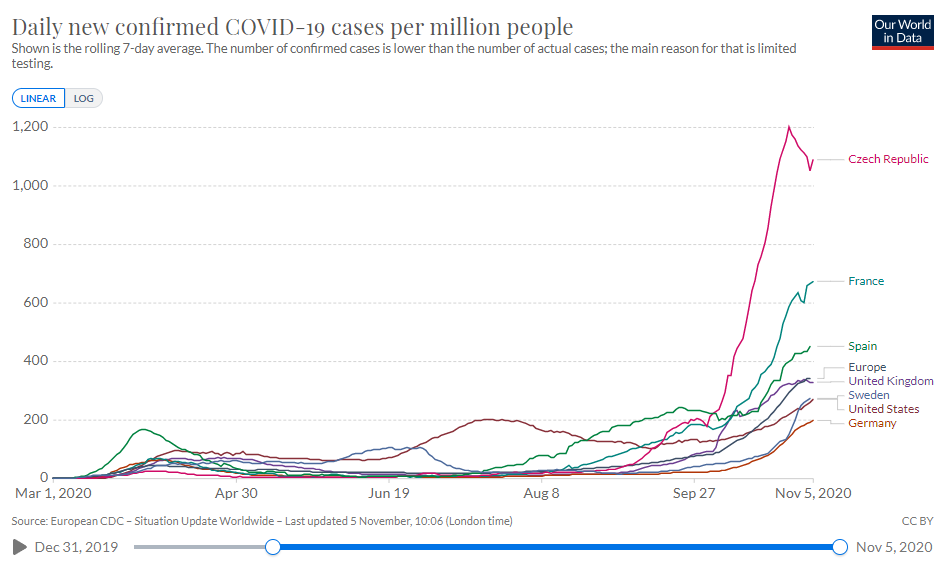
Let’s start with the bad news. Europe is experiencing a surge in COVID-19 cases. Member EU states have responded by going into lockdown. The worse afflicted are the Czech Republic, France, and Spain. Even Sweden, which was the poster child for light restrictions, is not immune to the second wave.
Bloomberg reported that the European Commission downgraded the growth forecast for 2021.
Europe’s economy, freshly battered by coronavirus restrictions, is facing a sluggish recovery next year that leaves it open to rising company failures and long-term unemployment.
The European Commission said the euro-area economy will grow 4.2% in 2021, less than previous anticipated. It sees a shallower recession this year, though that doesn’t include the latest government lockdowns, which could push some of the region’s biggest economies back into recession.
“Europe’s rebound has been interrupted due to the resurgence in Covid-19 cases,” Paolo Gentiloni, EU commissioner for the economy, said in a statement. “In the current context of very high uncertainty, national economic and fiscal policies must remain supportive.”
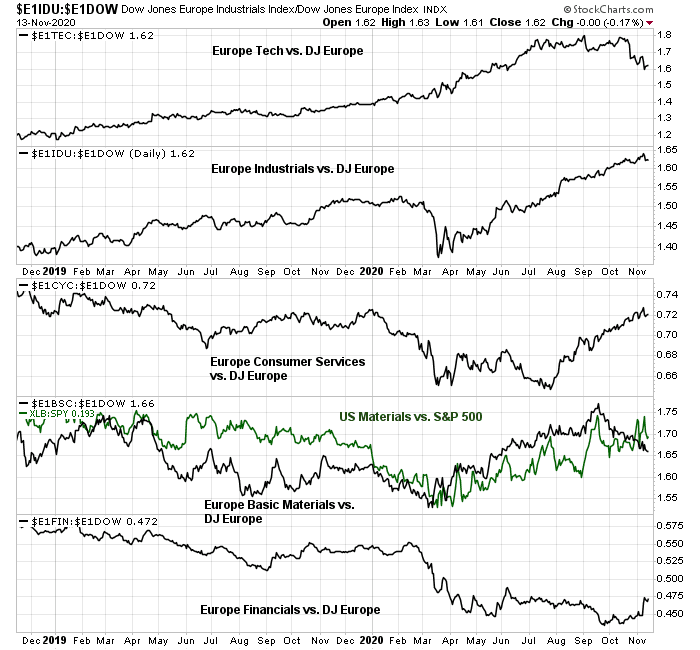
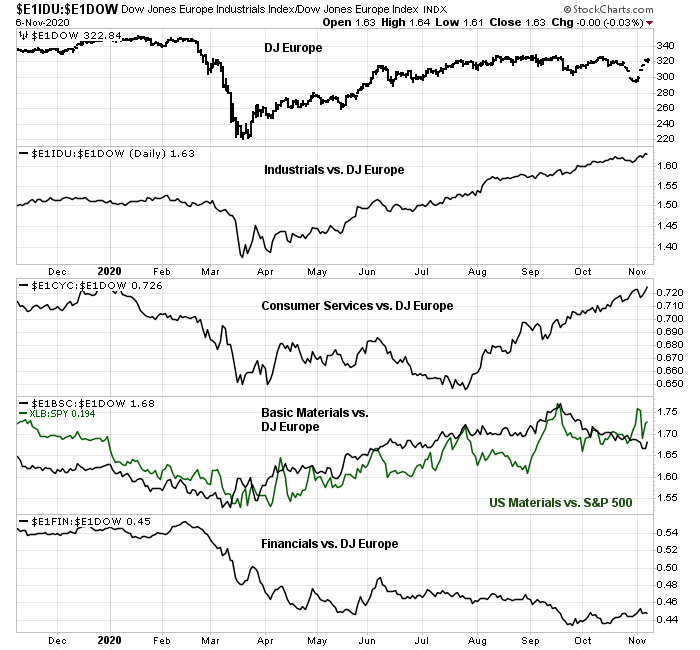
The stock market hasn’t reacted to these dire forecasts. The analysis of sector internals tells a different story. Cyclical sectors, such as industrials and consumer services are outperforming the market. Basic Materials stocks are tracing out a relative uptrend in a way that is similar to the Materials sector in the US.
Why?
There’s a new sheriff in town
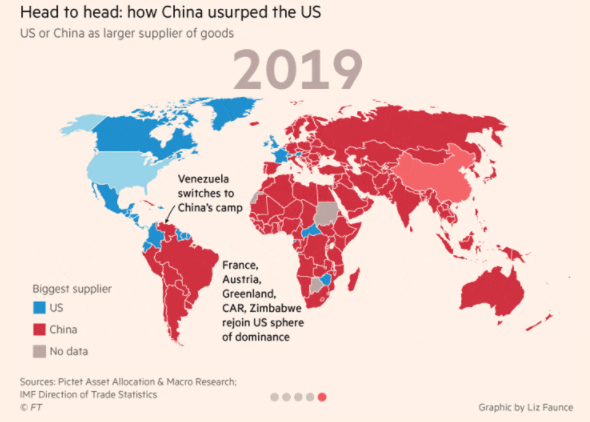
That’s because a new sheriff has come into town. (No, it’s not Joe Biden.) it’s China as a source of growth.
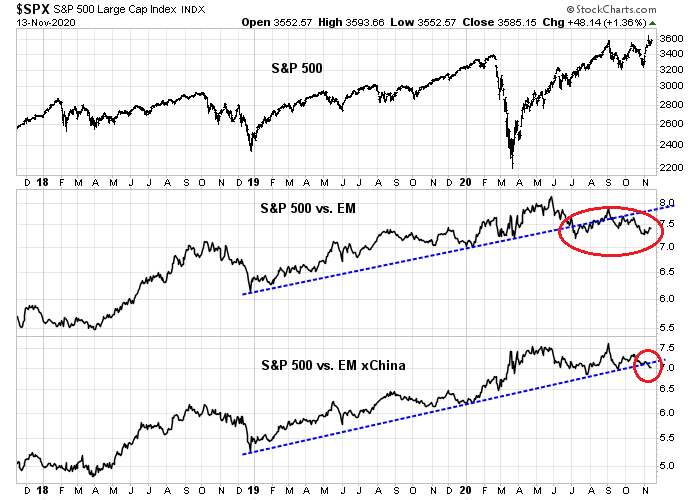
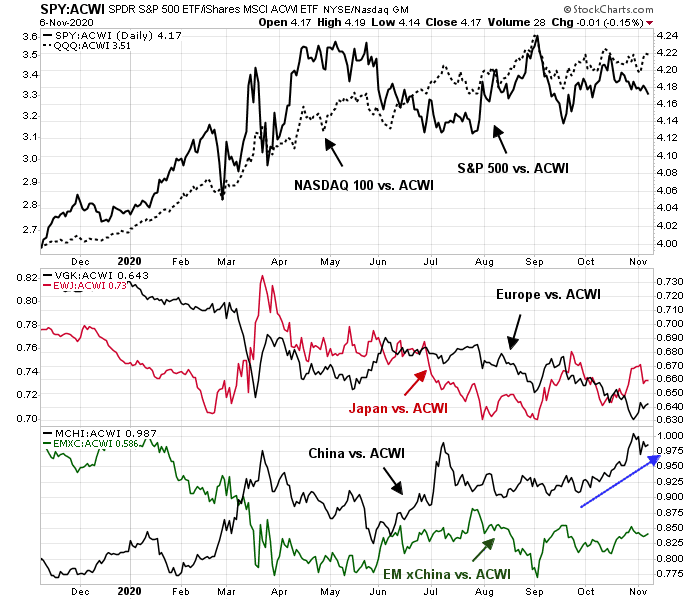
A glance at the chart of global relative performance shows that US markets were the former leaders but starting to weaken. Other developed markets, like Europe and Japan, have been trading sideways relative to the MSCI All-Country World Index (ACWI). It is China that has emerged as the new leadership (bottom panel).
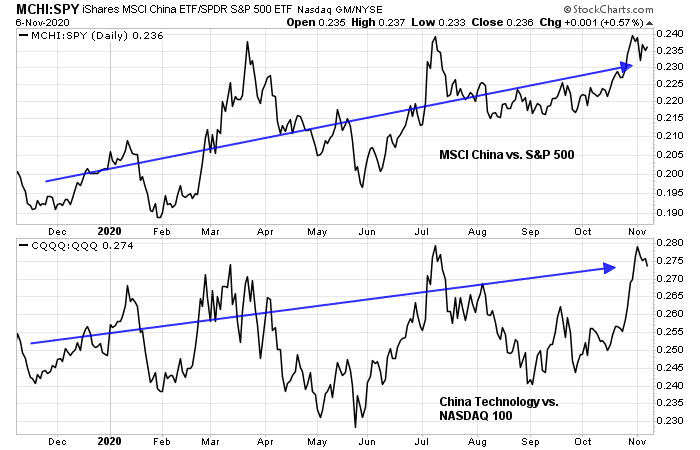
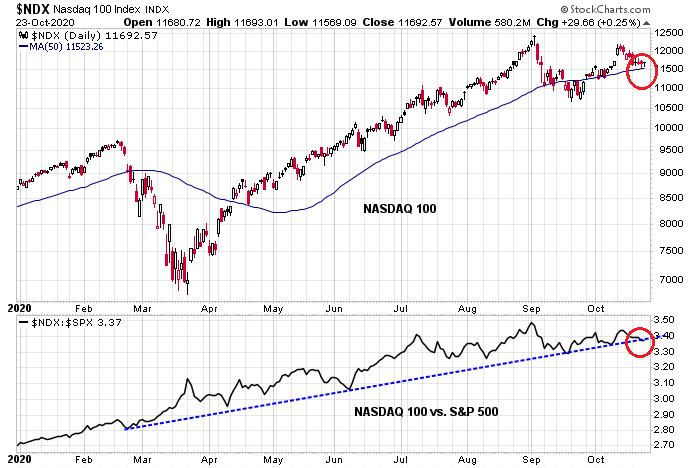
On a relative basis, MSCI China has outperformed the S&P 500 this year, and Chinese technology stocks have beaten the NASDAQ 100, albeit in a choppy manner.
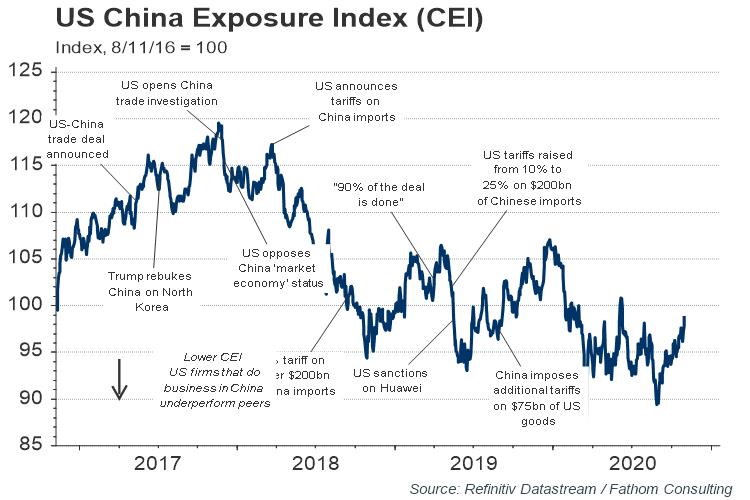
Within the US, the China Exposure Index, which measures the returns of US stocks exposed to China, has performed well.
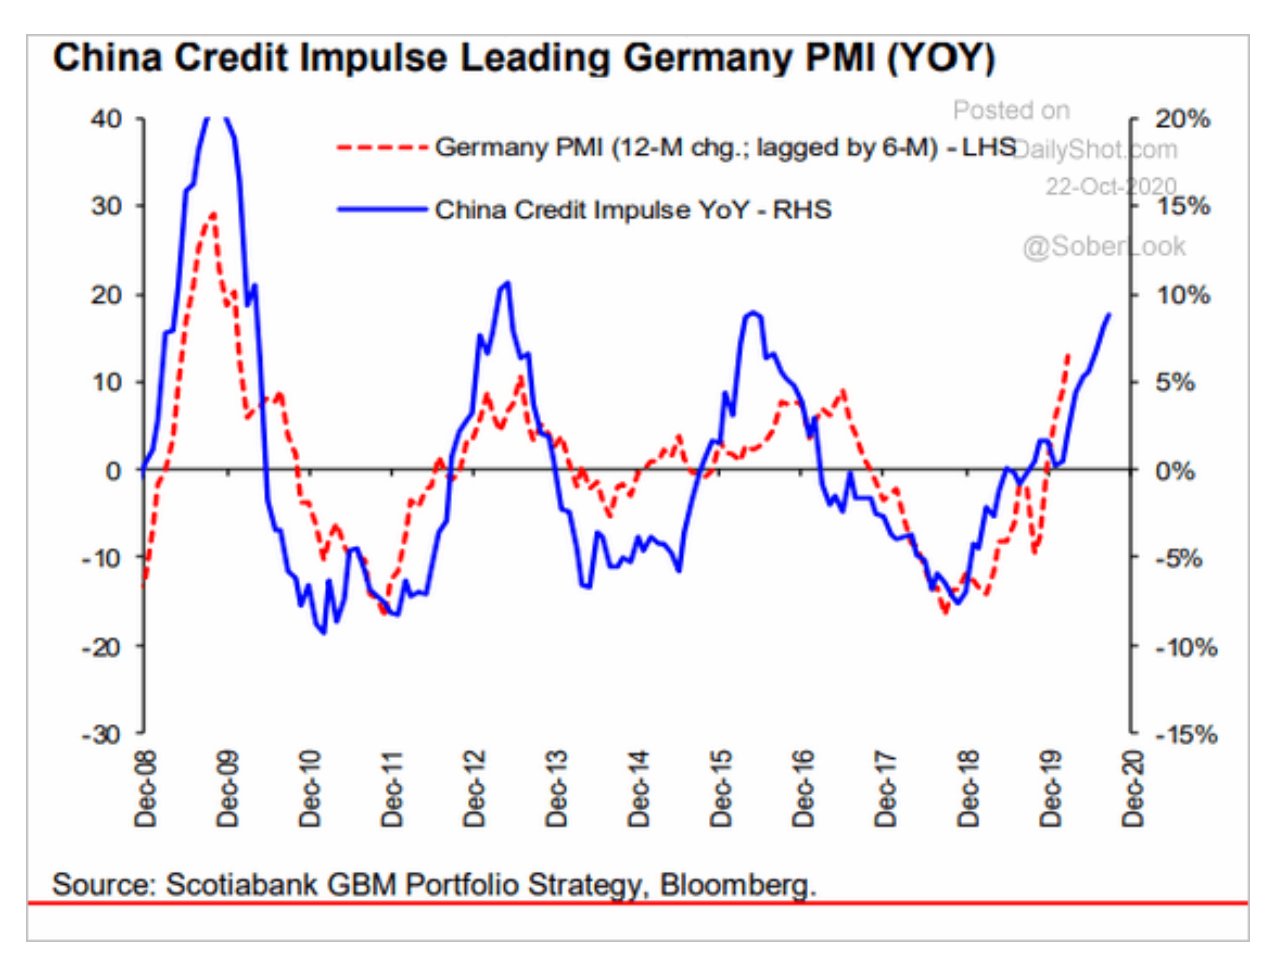
China’s economic recovery has proved to be a source of global demand that has become the locomotive for a global recovery. To be sure, the rebound was powered by a credit-fueled boost to production and not household consumption. Nevertheless, there is a strong lead-lag relationship between China’s credit impulse and German manufacturing PMI. Strength in China begets German, and therefore eurozone growth.
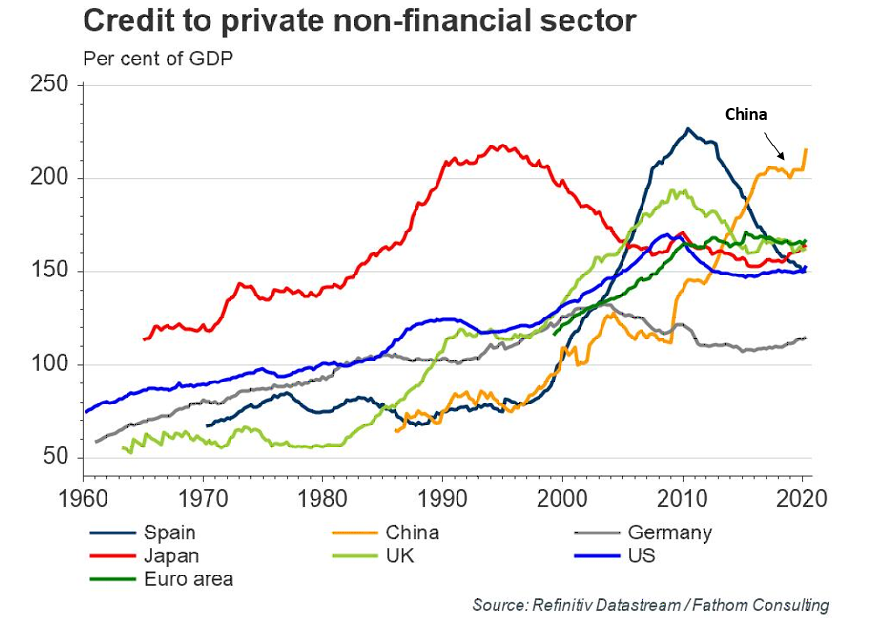
As the China bears’ favorite chart shows, the debt buildup is unsustainable, but that’s a problem for another day. Today, we party, and worry about tomorrow later.
No Blue Wave = Fiscal cliff?
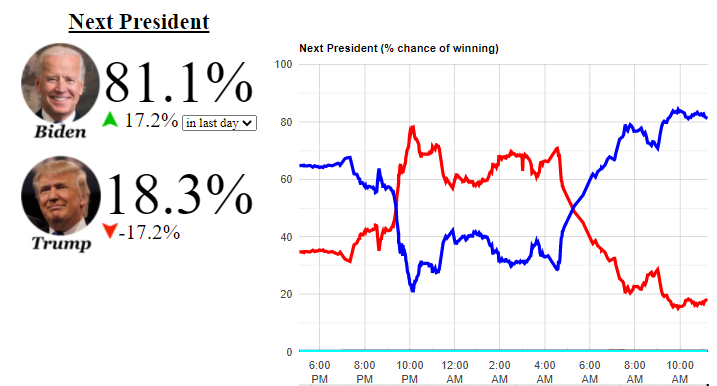
Turning to the US, the markets had been anticipating a Blue Wave, where the Democrats sweep the White House, Senate, and House in the election. Such an outcome would have produced a large fiscal stimulus plan to boost domestic demand. Instead, Biden eked out a marginal win in the election. Any plans of significant fiscal expansion have been handcuffed by a Republican-controlled Senate. The hopes of the American consumer becoming a significant source of renewed global demand in 2021 were dashed on November 3. The markets melted up in the wake of the election. Has the narrative changed? What happened?
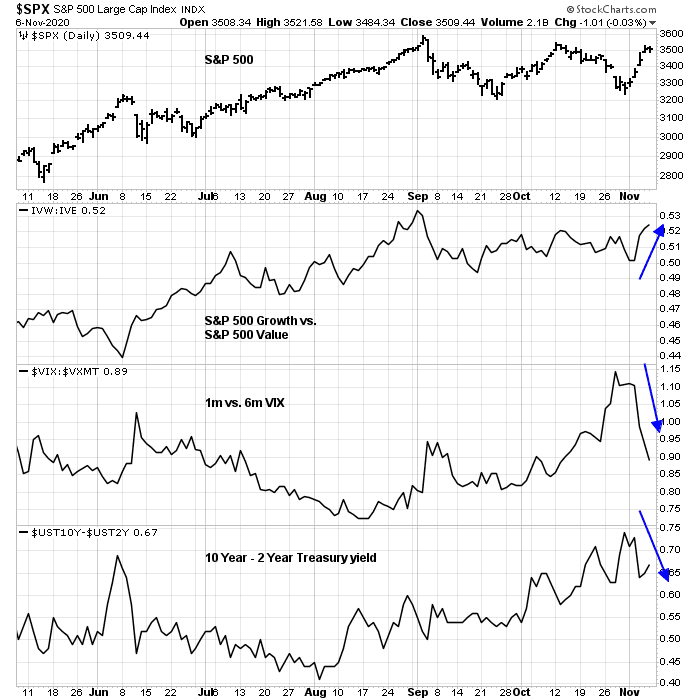
The analysis of market factors tells the story. As we approached the election, market anxiety rose, as evidenced by a steady rise in the 1-month VIX against the 6-month VIX. As well, the market began to anticipate the growth boost provided by a large fiscal stimulus of a Democratic sweep, as shown by a steepening 2s10s yield curve. Growth had been dominating Value but they lost their mojo as we approached the election. and growth/value traded sideways.

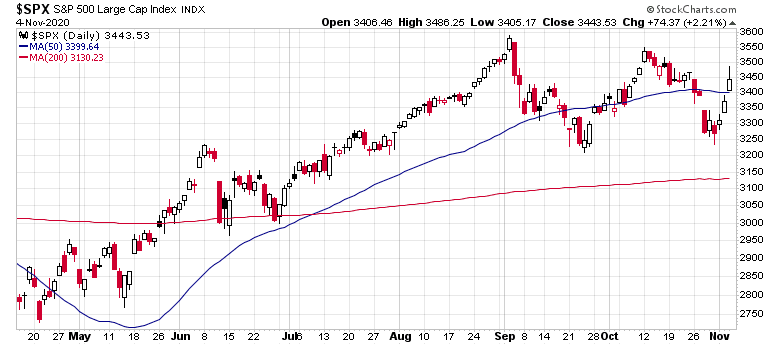
When it became evident that Biden was likely to be the new President, and the Republicans control the Senate, the narrative changed. Growth stocks rebounded strongly. As Big Tech stocks (technology, communication services, and Amazon) comprise about 44% of the S&P 500, the index soared. The market internals of the rally tells the story of narrow leadership. Even as the S&P 500 surged by over 2% on Wednesday, declining volume outpaced advancing volume on the NYSE. This has never happened before, ever! In other words, the market isn’t rising, Big Tech and Growth stocks are rebounding.
Here is the glass half-full market narrative for equity bulls. Without Trump, the risk of protectionism and trade wars will recede. Investors can look forward to little or no tax hikes, and a legislative status quo. The government’s approach to pandemic control will be more scientifically based, and there is hope for one or more vaccines just around the corner. In addition, the Washington Post reported that Senate Majority Leader Mitch McConnell has opened the door to a compromise stimulus bill of about $1 trillion during the lame-duck Senate session.
As well, the Democratic sweep narrative is not entirely dead. Republican Senate control is not necessarily a done deal. The two Georgia seats are headed to a run-off election on January 5, 2021, and there is an outside chance that the Democrats could capture both seats. While I am not holding my breath for that outcome, it does represent a possible bullish surprise for the fiscal stimulus-induced cyclical rebound theme.
A large fiscal stimulus may not be a necessary condition for an economic recovery. Fed watcher
Tim Duy reacted to last Friday’s strong October Jobs Report this way, “Solid report…As long as jobs keep growing, there will be support for consumption growth. Fiscal support is important for the speed and equity of the recovery but not necessarily the recovery itself.”
Key risks
The main risk to the outlook is how the world deals with the pandemic. Fed watcher Tim Duy made an important point that the surprising strength in US retail sales is deceptive because of a shift in spending away from services towards goods. When you’re stuck at home, you spend more on goods than services, which often involve face-to-face interaction. Until the pandemic comes under control, the service sector will have a hard time recovering.
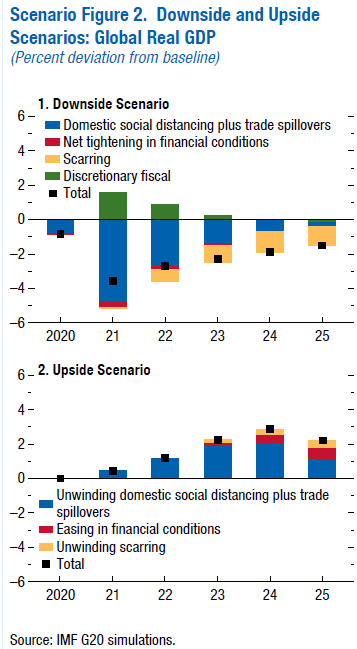
The IMF has projected global GDP growth under upside and downside scenarios.
Under the upside scenario, it is assumed that all things in the fight against COVID-19 go much better than assumed in the baseline. On the treatment front, advances quickly start to reduce the fatality rate, reducing fear and helping to restore confidence. An early and substantial ramp-up in investment in vaccine production capabilities and cooperation agreements in the associated global supply chain lead to earlier, widespread vaccine availability. Complete openness and transparency in the underlying science increase confidence in vaccine efficacy and safety, leading to widespread vaccinations. All these advances will allow activity in the contact-intensive sectors, which have been most adversely affected, to bounce back more quickly than assumed in the baseline. In addition, the overall improvement in confidence will lead to higher spending across other sectors as uncertainty about future income prospects subsides. More buoyant activity will in turn lead to improved prospect for firms and less deterioration in fiscal positions, driving an easing in risk premiums. Further, the faster bounce-back will lead to fewer bankruptcies, less labor market dislocation, and a milder slowing in productivity growth than assumed in the baseline. The improvements in these supply side factors start in 2023 and grow. On the policy front, with the improvement in activity, fiscal withdrawal is assumed to be only in terms of automatic stabilizers, and monetary authorities everywhere are assumed to be able to accommodate the faster growth without imperiling their price stability objectives. Panel 2 in Scenario Figure 2 contains a decomposition of the impact on global GDP of the three key layers under the upside scenario.
Here is the downside scenario.
For the downside scenario, it is assumed that measures to contain the spread—either mandated or voluntary—slightly increase the direct drag on activity in the second half of 2020 as the virus proves more difficult to contain. Further, it is assumed that in 2021 progress on all fronts in the fight against the virus proves to be slower than assumed in the baseline, including progress on vaccines, treatments, and adherence to social distancing guidelines to contain the virus’s spread. This leads to a deterioration in activity in contact-intensive sectors, with the associated income effects spilling over to other sectors. These domestic demand effects are then amplified via trade. Financial conditions are also assumed to tighten, with corporate spreads rising in advanced economies and both corporate and sovereign spreads widening in emerging market economies. The increase in 2020 is quite mild but grows to be more substantive in 2021 as the weakness in activity persists. Financial conditions gradually return to baseline beyond 2022. Fiscal authorities in advanced economies are assumed to respond with an increase in transfers beyond standard automatic stabilizers, while those in emerging market economies are assumed to be more constrained, with only automatic stabilizers operating. Monetary authorities in advanced economies with constraints on conventional policy space are assumed to use unconventional measures to contain increases in long-term interest rates. The more protracted weakness in activity is assumed to create additional, persistent damage to economies’
There is considerable variation between the two extreme outcomes. The local economy could recover strongly starting in 2021, or it could be mired in a period of slow growth for years.
I would also be remiss without highlighting my tail-risk warning of a Chinese invasion of Taiwan (see Emerging tail-risk: An invasion of Taiwan). China recently issued an ominous “Don’t say I didn’t warn you” (勿谓言之不预也) warning to Taiwan through official media. Similar language had been used as a prelude to past conflicts. The SCMP reported on October 18, 2020 that China is preparing for war by upgrading its missile bases.
Beijing is stepping up the militarisation of its southeast coast as it prepares for a possible invasion of Taiwan, military observers and sources have said.
The People’s Liberation Army has been upgrading its missile bases, and one Beijing-based military source said it has deployed its most advanced hypersonic missile the DF-17 to the area.
“The DF-17 hypersonic missile will gradually replace the old DF-11s and DF-15s that were deployed in the southeast region for decades,” the source, who requested anonymity, because of the sensitivity of the topic. “The new missile has a longer range and is able to hit targets more accurately.”
As an illustration of the seriousness of the threat, the article showed a picture of China’s Southern Command Centre, which featured a prominent 3D relief map of southern Taiwan. This is an important indication that China is putting together the capability to invade, though the political will is uncertain. I reiterate that an invasion of Taiwan represents an elevated tail-risk to the bull case, but it is not part of a base case scenario.
Much will depend on the evolution of China’s relationship with the rest of the world. A column in
The Economist shows that the Chinese leadership believes that it is not receiving the level of respect from the US or the rest of the world.
China wants smoother ties with America, said the official. But given their deep roots, present-day tensions will be hard to reverse unless America comes to a new understanding of the world. Westerners are a self-centred and judgmental lot, he charged. They never expected the Chinese—a diligent, studious people—to rival them so soon. No matter which party runs Washington, the official said, “The us has to answer this question: can the us or the Western world accept or respect the rise of China?”
The long-term path of regional geopolitical tensions is rising. The American decision to sell drones to Taiwan will not smooth relations. As well,
Bloomberg reported that China is considering measures to gives its Coast Guard to fire on foreign vessels in disputed waters is another sign of Beijing’s new assertiveness. Conflict seems inevitable unless cooler heads prevail.
The verdict
Notwithstanding China’s saber-rattling, the global economy is not running on a single piston of Chinese growth. US growth could surprise to the upside.
New Deal democrat has been helpfully analyzing the US economy through the lens of coincident, short leading, and long leading indicators. He concluded that the economy is itching to surge, “All three time frames remain firmly positive”, and “the overall dynamic is that of continuing slow improvementIf the pandemic is brought under control due to effective public policy, possibly including a vaccine, by next spring sometime, then the long- and short-leading indicators will start to reassert their true meaning more or less starting now.”
Is the global economy on the path to recovery, and should investors pile into cyclical and reflation themes?
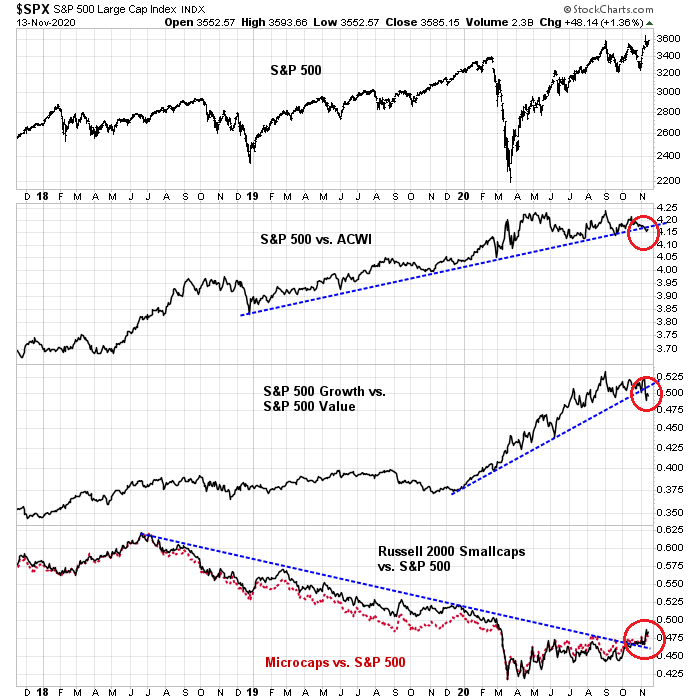
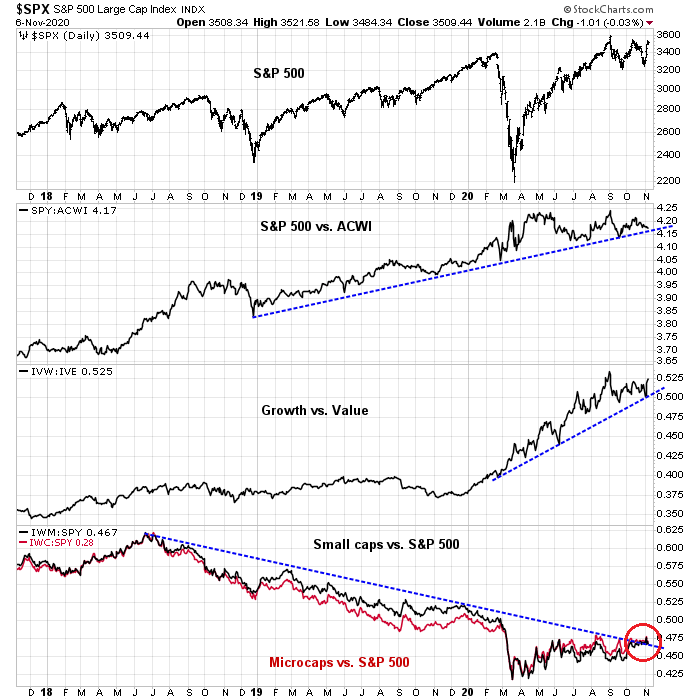
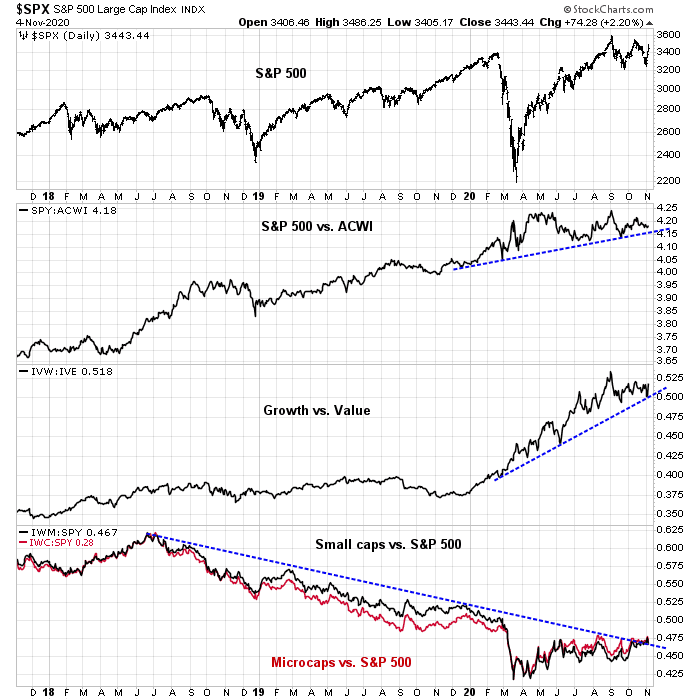
For the final verdict, I turn to the analysis of factor leadership. The market has been dominated by three leadership themes: The US over global stocks, growth over value, and large caps over small caps. New cyclical bulls usually begin with a change in leadership, which we may be starting to see today.
While US stocks remain in a multi-year relative uptrend against the MSCI All-Country World Index, its relative performance trended sideways for most of this year, and it is at risk of breaking the uptrend line. As I already indicated, Chinese equities have become the new leadership. A break in the US relative uptrend could be a signal of leadership shift.
Growth has been handily beating Value for 2020 as the pandemic-induced recession raged. Investors flocked to growth stocks in a world starved for growth, but that relative uptrend is also being tested. I will be monitoring this relationship for signs of a break.
Lastly, small caps have begun to outperform large caps. The relative performance ratio rallied through a long-term relative downtrend. This is the first sign of a break in the leadership of the Big Three leaders.
In conclusion, the jury is still out on whether investors should fully embrace the cyclical and reflation investment theme. The trend is positive, but we are not there just yet. Keep an open mind as to the outcome, but if market leadership were to turn, that could be the signal of a new cyclical equity bull market.