Preface: Explaining our market timing models
We maintain several market timing models, each with differing time horizons. The “Ultimate Market Timing Model” is a long-term market timing model based on the research outlined in our post, Building the ultimate market timing model. This model tends to generate only a handful of signals each decade.
The Trend Asset Allocation Model is an asset allocation model which applies trend following principles based on the inputs of global stock and commodity price. This model has a shorter time horizon and tends to turn over about 4-6 times a year. In essence, it seeks to answer the question, “Is the trend in the global economy expansion (bullish) or contraction (bearish)?”
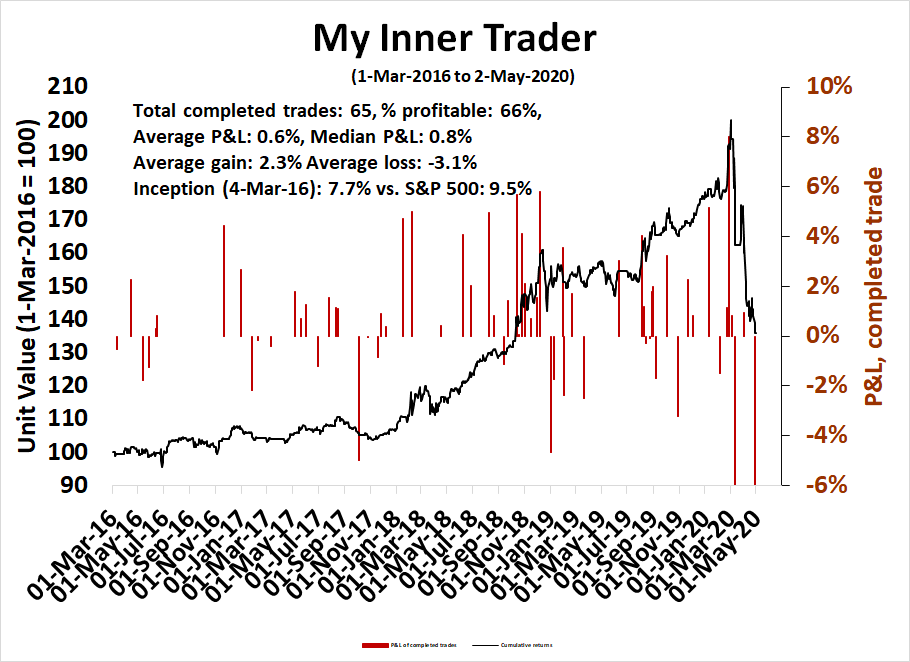
My inner trader uses a trading model, which is a blend of price momentum (is the Trend Model becoming more bullish, or bearish?) and overbought/oversold extremes (don’t buy if the trend is overbought, and vice versa). Subscribers receive real-time alerts of model changes, and a hypothetical trading record of the those email alerts are updated weekly here. The hypothetical trading record of the trading model of the real-time alerts that began in March 2016 is shown below.
The latest signals of each model are as follows:
- Ultimate market timing model: Sell equities
- Trend Model signal: Bearish
- Trading model: Neutral
Update schedule: I generally update model readings on my site on weekends and tweet mid-week observations at @humblestudent. Subscribers receive real-time alerts of trading model changes, and a hypothetical trading record of the those email alerts is shown here.
An AAII crowded short?
Why is AAII sentiment so bearish? Is that contrarian bullish?
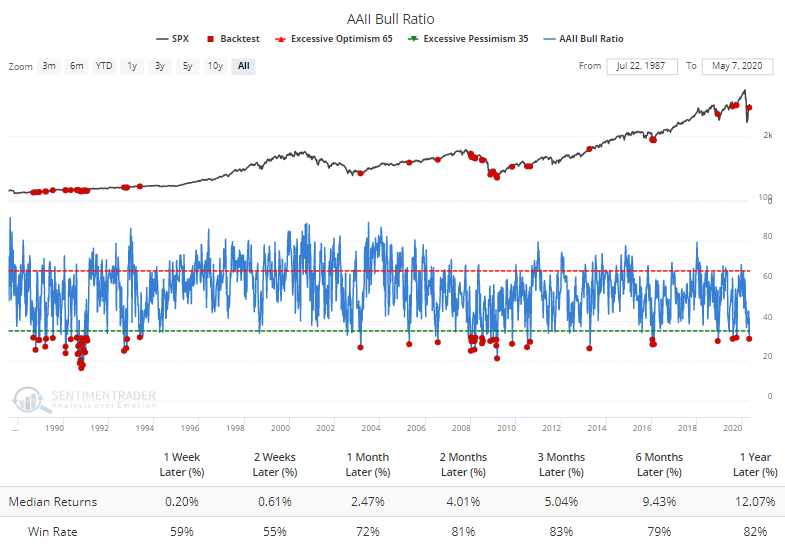
Jason Goepfert at SentimenTrader highlighted how the latest American Association of Individual Investors (AAII) weekly sentiment survey, which showed that bearish sentiment had spiked despite the stock market rally. Readings have become sufficiently net bearish that subsequent returns are bullish.
What’s going on? Is the market climbing the proverbial Wall of Worry?
Sentiment anomalies
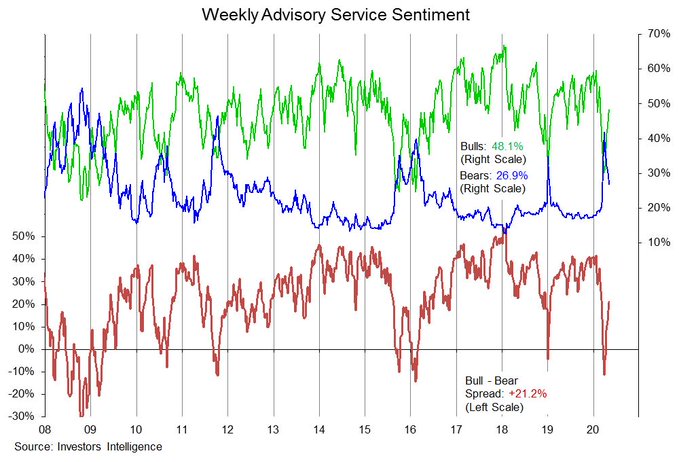
There are a number of anomalous sentiment readings that are inconsistent with the AAII weekly survey. For example, Investors Intelligence is returning to a neutral level after a fear spike and shows no bearish extreme.
The same could be said of the NAAIM Exposure Index, which measures RIA sentiment.

The percentage of Sell Side buy ratings is the highest since June 2015. This is not excessive bearishness, but bullishness.
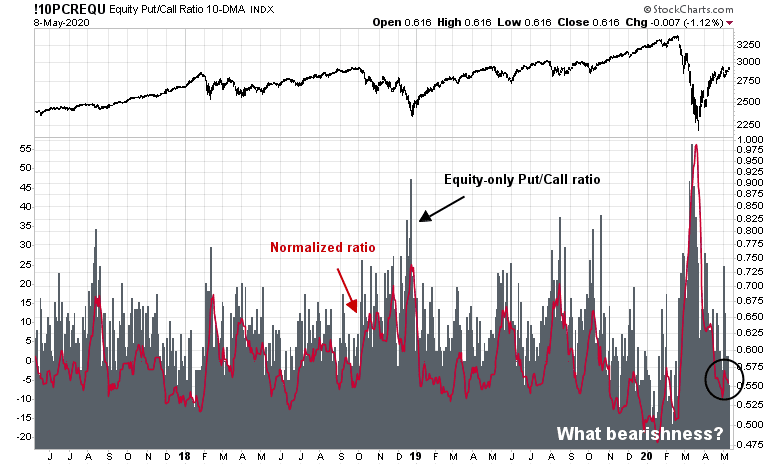
The equity-only put/call ratio is a bit on the low side. This is an indication of mild bullishness, and nearing a crowded long condition.
The AAII survey sample is composed mainly of retail short-term traders. If these traders are so bearish, the bearishness is not showing up in Rydex bear fund activity.

Has something happened to the AAII survey sample? Is the bearishness just a data blip?
A new Tech Bubble?
No, there is nothing wrong with the AAII sentiment survey. It is doing its job by measuring the activity of retail short-term traders. It’s just that retail traders are dominating market movements in the short run.
Retail brokerage Daily Average Revenue Traders (DARTs) tells the story. Powered by the trend to zero commissions, DARTs have exploded upwards across the board. Here is another crazy anecdote. Robinhood had 10 million accounts by Dec 2019, and it added another 3 million new accounts YTD.

This is starting to be reminiscent of late 1990’s Tech Bubble. The zero-cost (except for bid-ask), high confidence and very low knowledge of markets are fueling a contrarian rally based on excessive bearish retail sentiment. While they are bearish on the economy, retail traders are piling into the technology market leaders as the last refuge of growth. As a result, NASDAQ stocks are now positive YTD.
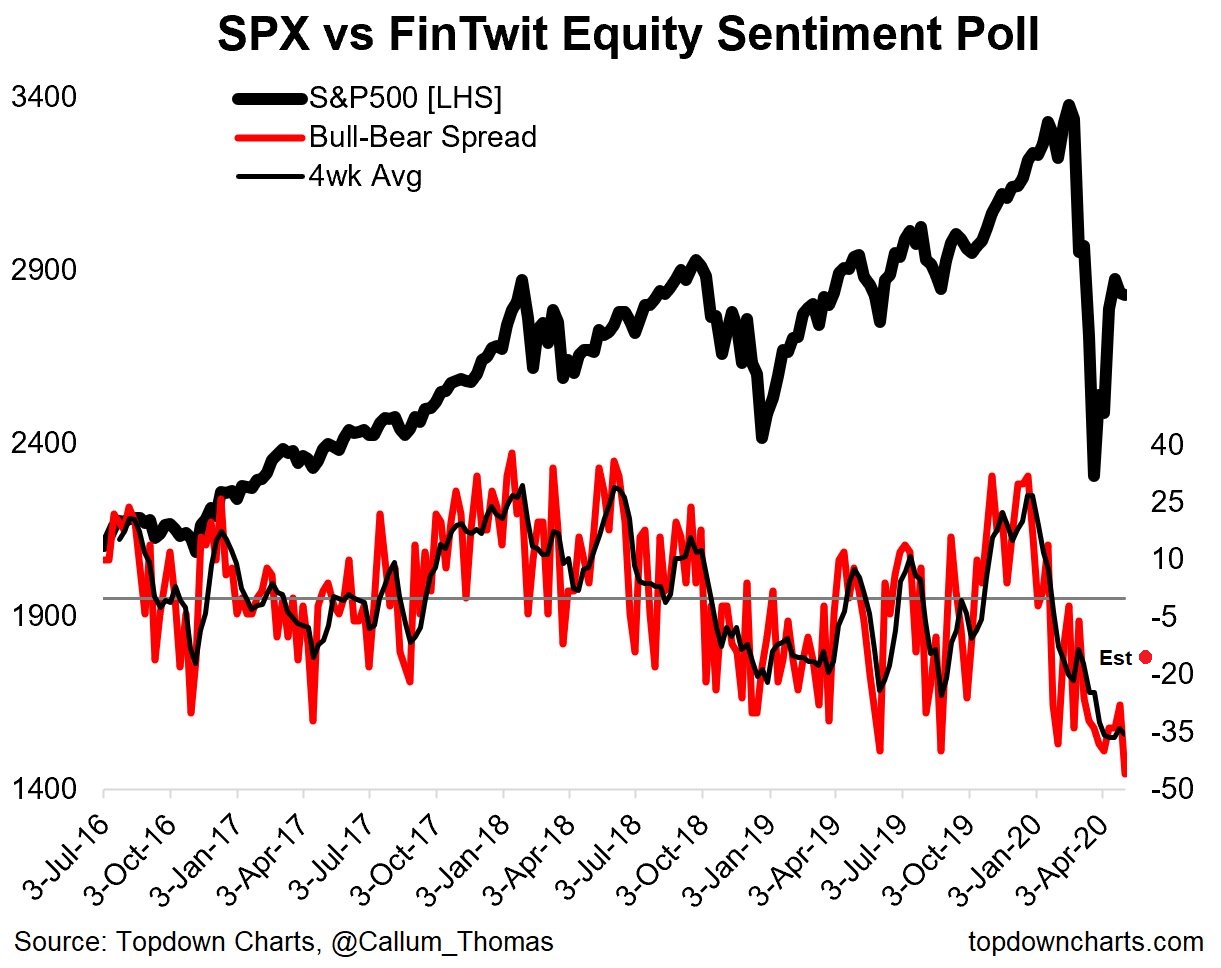
There are early signs that the bears are capitulating. Callum Thomas conducts a weekly (unscientific) poll on Twitter, and the respondent base is probably similar to the AAII sample. As of the time of this publication, the poll is incomplete, but the interim results indicate that bull-bear spread has begun to reset from a record bearish extreme last week to a more neutral level.
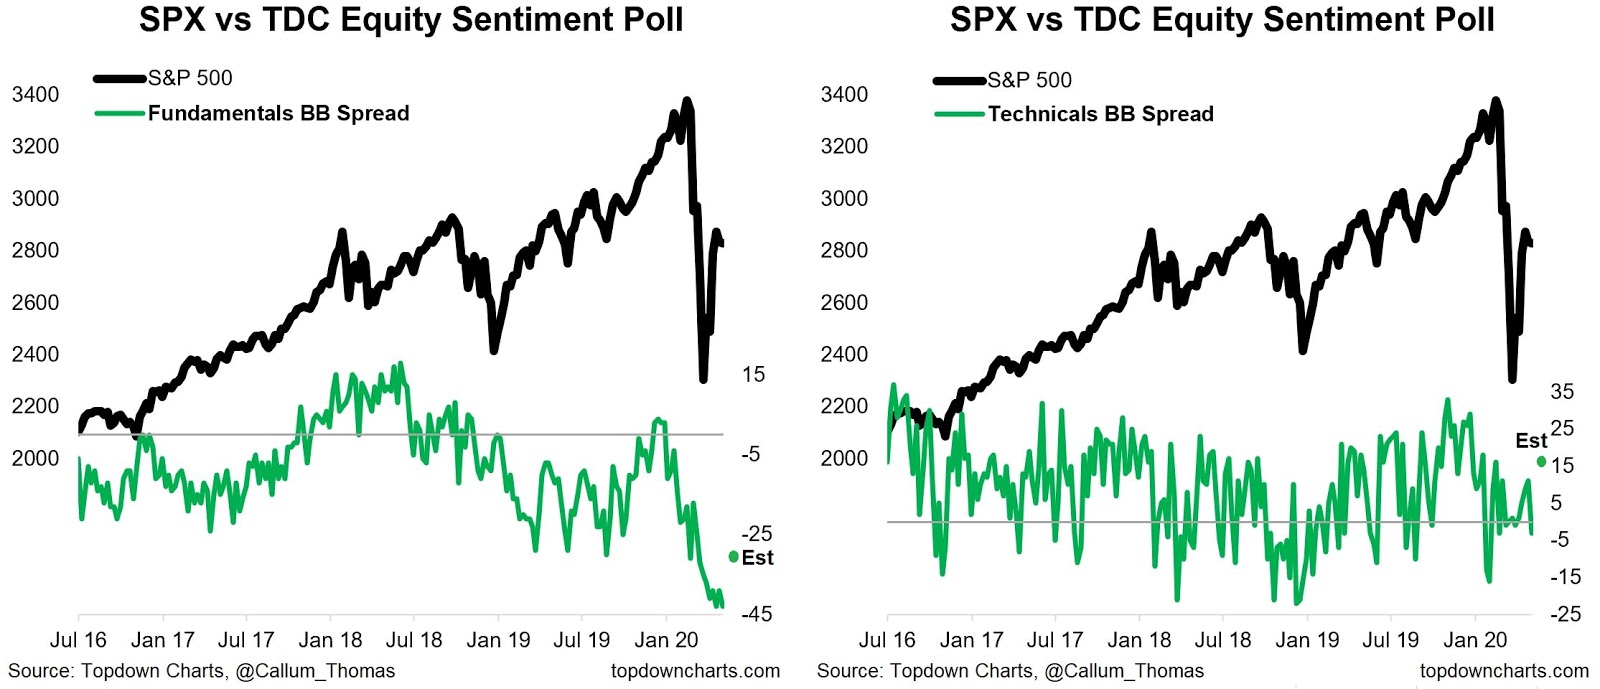
Net bullishness is rising on both fundamental and technical dimensions. The fundamental bull-bear spread has retreated from a record low. The technical bull-bear spread has risen into bullish territory, though readings are not extreme.
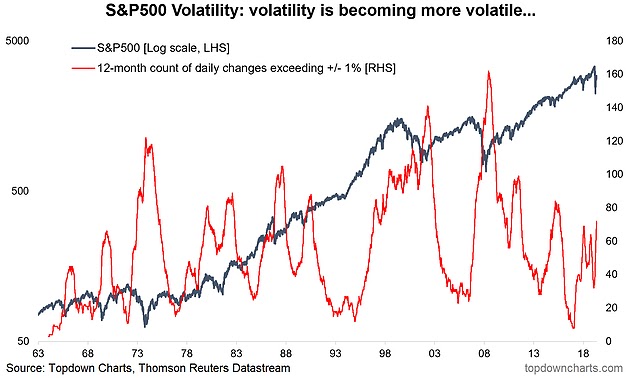
Lurking volatility
While I have no idea of the exact timing, but the market is setting up for the return of greater volatility. Callum Thomas at Topdown Charts observed that volatility is becoming more volatile. This doesn’t mean that volatility just rises, but it becomes choppier – and so will stock prices.
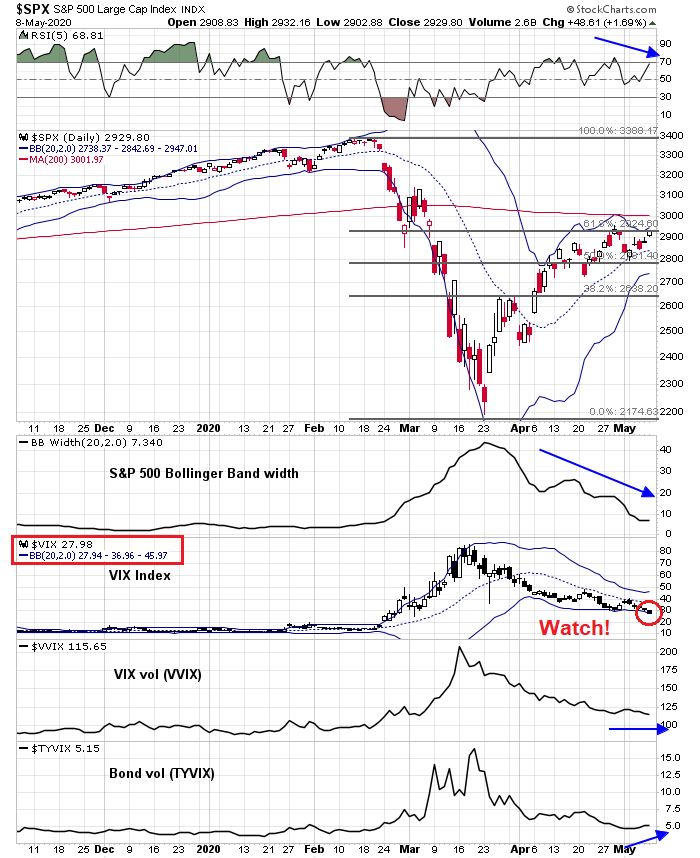
The following chart has a lot of observations to unpack. Here are my main takeaways:
- Realized and implied volatility are falling, as measured by the falling Bollinger Band (BB) width and VIX Index.
- Volatility may be ready to spike. Both VVIX and TYVIX are not buying the decline in the VIX.
- Stock prices may be nearing an inflection point. The market is testing key resistance levels, as defined by a Fibonacci retracement level, and its upper BB, even as its 5-day RSI exhibits a minor negative divergence.
- The VIX Index is nearing an extreme. Historically, a VIX close below its lower BB is an overbought signal for the market and a good time to sell stocks. The VIX closed at 27.98 on Friday, which is just a hair above its lower BB at 27.94.
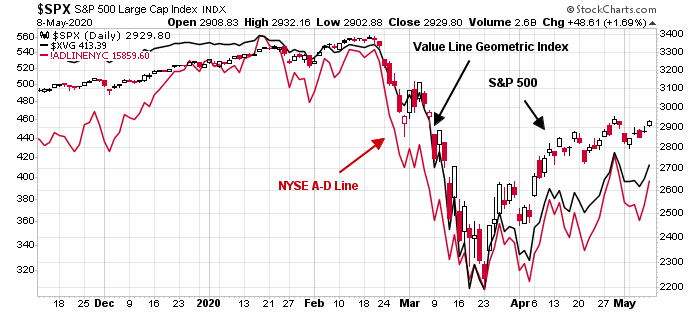
Even as the NASDAQ Index turns positive on YTD basis, broader market indicators such as the Value Line Geometric Index and the NYSE Advance-Decline Line are lagging the broader market advance. This retail supported rally looks like it is on its last legs.
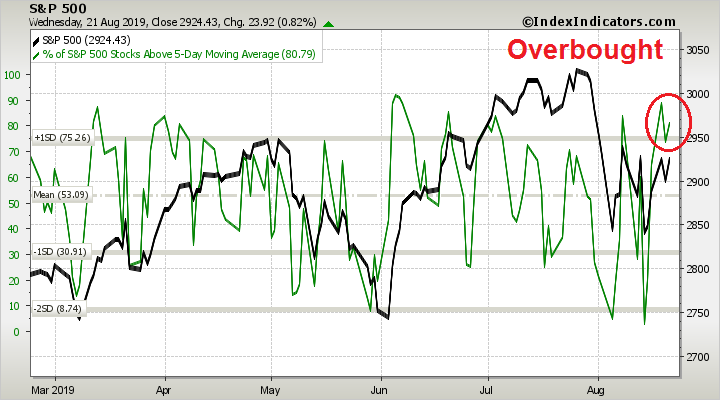
Market breadth is overbought on a 1-2 day horizon, based on the percentage of stocks above their 5 dma.
On a longer time frame, however, they have more room to advance based on the percentage of stocks above their 10 dma.
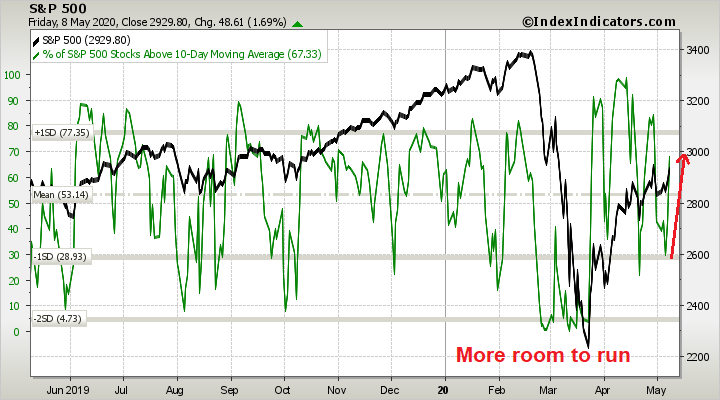
I interpret these conditions as the market nearing an inflection point, but the most likely resolution is a choppy range-bound consolidation until it can find its next major narrative (see What’s the next market narrative?).
Still a bear market
From a long-term technical perspective, this is still a bear market. Bear markets are defined by monthly negative MACD readings. While the bull market (buy) signals work better than the bear market MACD sell signals, major bear markets have ended with deeply oversold 14-month RSI conditions, which hasn’t happened yet.

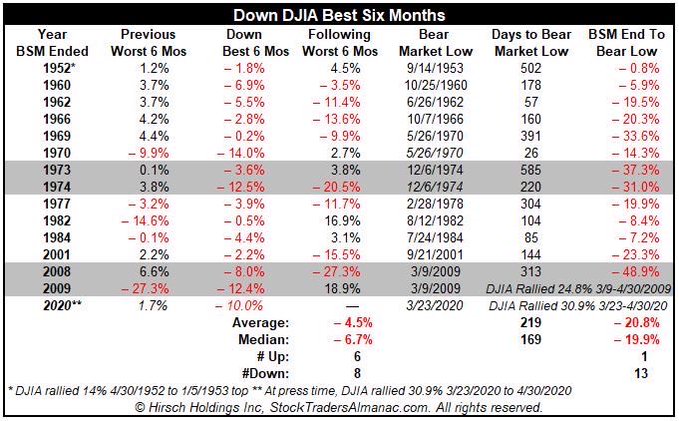
As well, we are entering the “Sell in May” period of negative six month seasonality. Jeff Hirsch at Trader’s Almanac showed what happens when the DJIA can’t even rally in the past “best six months” of the year. The following six months tend to resolve themselves bearishly.
Don’t go overboard and get too bullish.
My inner investor is still cautiously positioned. My inner trader is on the sidelines in cash. However, should the market stage another rally on Monday and the VIX closes below its lower BB, he will initiate a short position, purely on the expectation of a 1-2 day scalp.
Does a sell off in the uber-hot tech and biotech stocks result in a rotation into other investible areas or does it bring down everything with it> ? That would mean a continuation of a real bear market. I note a rather unexpected and significant improvement in the price of WTI and Brent. Robert Millman
My experience says that indicators should be looked at in the context of where we are in the stock market cycle. Early Bear/Late Bear/Early Bull/Expansion Bull/Late Expansion Bull/Peaking/Repeat.
The AAII chart above is a perfect case in point. In the Early Bear phase of the 2008 GFC the members were very consistently and very accurately bearish. Being contrary to them at that point was a big mistake. My sense is that with just a month of decline in this bear (Feb. 19 to March 23), we are in early Bear country.
Note that after markets had plunged nine months later in 2008 there was another string of AAII bearishness. That was Late Bear and one would have been smart to be contrary to it.
Later this year, when markets and investors have been beaten up for a goodly length of time and they give up in a negative bearish funk, that will be time to be contrary.
The new traders at the discount brokers aren’t members of AAII. They are a new breed of Covid locked-in day-traders. My 27 year-old son is amazed at how many of his contacts are doing this. The other day, out of the blue a friend who had never shown any sign of being interested in stock markets said the word ‘puts’ in a sentence about it. My son thought, “How the hell did he learn about puts?”
The other new investors are frustrated locked-down sports gamblers. All the sports league seasons (Baseball, Football, Soccer) are not opening and Los Vegas is a Covd nightmare. If you have a gambling itch, you can scratch it nowadays only at the NYSE and Chicago Futures Pit.
Here is a funny video of a sports better turned day trader.
https://twitter.com/barstoolsports/status/1250402021045407746?s=09
So it is not the shoeshine boy with a tip, the rhyming continues. As far as the DART chart goes…people will point at that in the future as a classic case of retail being sucked into a bull trap. I suppose one could argue that there will be inflation so equities can shelter, only if there is inflation and interest rates go up, equities go down until inflation has boosted the value of the assets. Hyperinflation does not happen overnight. It took years for it to ramp up in Weimar Germany.
Nope, this will be a classic bear market rally…61.8% Fibonacci retracement and the weekly RSI has not moved above 60%…of course anything can happen…markets can be irrational beyond expectations…thats my oxymoron of the day
There are a few short term studies that triggered Friday that are quite bullish. The first is when the Nasdaq Composite closes at an all time high on the day of a jobs report: https://quantifiableedges.com/todays-employment-sparked-nasdaq-rally-appears-to-be-a-short-term-bullish-indication/ The second is a study cited by Urban Carmel that shows a bullish short term propensity when the $NDX close up 5 days in a row: https://twitter.com/ukarlewitz/status/1258763400521211904
Price wise, the NDX never got close to oversold on a monthly or YOY basis. I would not be surprised if it retested previous all time highs.
On the other hand, if you asked me if I think the NDX 100 would be higher or lower a year from now, I would guess lower. In the end, less jobs means less money to spend on products – including accumulating shares or buying options.
Another great post that manages to assimilate information not generally found elsewhere, at least not tied together in one place.
As I read through media reports/ articles/ tweets, once in a while a single observation will jump out – one that manages to strengthen conviction or at least explain market behavior. Several weeks ago it was the observation that the SPX may have formed an island reversal pattern. Two weeks ago it was a single tweet by a trader re a rising wedge. Today it’s Cam’s observation re sentiment anomalies.
There are no doubt many studies underway at B schools exploring the effect of zero-commission trading and/or the the spike in retail trading during the global shutdown on price movements, and perhaps one or more will help to explain the upside overthrow we’ve seen.
On the non-anomalous side of things – the market has always priced in economic reality (ie, market movements will ultimately reflect the state of the economy), but generally via the path of maximum frustration. In that sense, it’s doing what it’s always done.
It’s relatively easy to divorce economic reality from prices on a trading platform – to allow charts, ticks, and indicators drive buy and sell decisions. It becomes an online video game played for real-world P/L results. At some point, traders collectively wake up and begin to price in the real-life consequences of the pandemic. Many of the businesses that line the streets in their hometowns will never reopen. A great many job losses – ones that affect their own families and friends – will become permanent. Industries will undergo major restructuring. The reality of a second (and possibly third and fourth) wave begins to sink in, and extended shutdowns become commonplace. The crowded beach scenes will disappear,
What if a vaccine fails to materiallize (after thirty years, we have yet to come up with one for Ebola or HIV)? The stock market is not the economy – yet the present and future cash flows generated by the companies that comprise the indexes are the reason we invest.
Seven viral futures: possible narratives to consider…
https://www.msn.com/en-us/news/technology/seven-viral-futures/ar-BB13SoTE
It’s always the scenarios that have been assigned low probabilities that should worry us the most. In this case, the low probabilities have already led to the exact behaviors that increase the odds they will occur.
The virus is re-emerging in many European and Asian economies. It might dampen the spirits of stock market bulls in coming days and weeks.
We are also getting close to the settlement date of June oil options on May 20th which will likely drive the oil prices lower and may send a bearish message to bulls on the economy.
I still think that 2,950-3,000 is an upper limit for S&P500 as Cam has articulated in these pages.
More from Quantifiable Edges:
https://quantifiableedges.com/massive-unemployment-and-a-massive-market-rally/
I found this commentary and chart helpful:
@TeddyVallee
Global equities for the second time in a year price in a growth rebound that our Real Time PMI model does not confirm.
https://twitter.com/TeddyVallee/status/1259573771972812800?s=20
Here comes the second wave
https://twitter.com/pzf/status/1259489804519190528
BREAKING NEWS: At least 75 protestors tested positive for COVID-19 after attending a large rally against the stay-at-home order in Wisconsin.
Yes, there’s an outbreak at the White House as well. No one is wearing a mask…
Another one from Macro Charts:
Stocks could rally into month-end, but 3Q20 is at full risk of a bigger Tactical regime shift.
https://twitter.com/MacroCharts/status/1259800420697833472
Worth reading, if you haven’t already:
https://www.erinbromage.com/post/the-risks-know-them-avoid-them?campaign_id=9&emc=edit_nn_20200511&instance_id=18384&nl=the-morning®i_id=95220570&segment_id=27239&te=1&user_id=a2a4457180643d326a5b1fa66404df46
An illuminating article.
Thanks for sharing, Rxchen2.
What do you guys think about this? Not sure if can totally agree.
https://www.nytimes.com/2020/05/10/business/stock-market-economy-coronavirus.html
The stock market isn’t the economy, but stock prices are driven by
1. Long term Return on Capital
2. Long term growth rate of the companies
3. Cost of capital
1 and 2 depend on the economy. While the weights of these factors in the S&P 500 are different from the economy (heavy FANG+), they nevertheless depend on the well being of the US economy. Hard to say that 1 and 2 are flat to up in the current environment.
Cam,
I agree. I don’t believe Stocks/Markets can stay up when there is so much damage to the Real economy. And yes as you said, 1 and 2 are the real drivers of the stock markets, with the economy where it will be post-Covid, how are those conditions going to be met to keep the markets as high as they are?
I also wanted to share the article to show people what Counter narratives others could be looking at (rather, deceiving themselves with) when we see the stock market rising without any fundamentals. I don’t see the reason for the strength, just like everyone else on your blog has mentioned. I believe, what other have pointed out, Gamblers/Fed/Newly formed Day traders are keeping it going. Seems like all Fluff.
Thanks for your great work.
An interesting link here:
https://lipperalpha.refinitiv.com/2020/05/sp-500-17q1-earnings-dashboard
Suggests that earnings will magically rise by 60% in 21Q2. This must suppose that a vaccine is found, all are innoculated and pent up demand just busts out all over and 2020 is just like it never happened. The stock market seems to be behaving that way and looking to 2021 for EPS price guidance.
However, as many have pointed out, S&P500 – big technology / Amazon type stocks is down 13% (+/-).
Ed Yardeni forecast for EPS for 2020 is 120 and for 2021 is 150:
https://www.yardeni.com/pub/yriearningsforecast.pdf
If you use the fabled 20x EPS for S&P500, you get to 2400 for 2020 and 3000 for 2021. Pessimistic15x gives 1800 (2020) and 2700 (2021).
Or maybe my understanding is just too simplistic, which is why I subscribe here to someone who knows much better than me!!
The FactSet bottom-up aggregated estimates tell the same story of an earnings rebound (page 24, 2nd chart)
https://www.factset.com/hubfs/Resources%20Section/Research%20Desk/Earnings%20Insight/EarningsInsight_050820.pdf
Historically, the markets have bottomed out at 10x forward earnings. If you use Yardeni’s estimates and a range of 10-13x forward earnings, you get an S&P 500 target of somewhere between 1300 and 1700, depending on when you calculate the forward earnings in 2020.
Cam, I think just like your opinion, S&P500 may stall under 3,020. What do you think of Nasdaq? It still seems to have a lot of momentum.
A lot of good minds coming up with alternative explanations for the ‘V’ move. Dwyer points out that the sectors which have led the move actually indicate a protracted recovery.
https://www.marketwatch.com/story/why-the-stock-markets-stay-at-home-rally-isnt-really-signaling-a-v-shaped-coronavirus-recovery-2020-05-11
Dwyer said he would characterize the market’s “extraordinary move” since the March 23 low and the Federal Reserve’s April 9 announcement of a plan to inject an additional $2.3 trillion into the economy as “economically defensive,” driven by “those megacap growth stocks that benefit from a longer stay and work-from-home economy, or the health care sector involved with the COVID-19 response.”
Dear Cam, today VIX closed below its lower BB. On the other hand ukarlewitz:
$COMPQ up 6 days in a row. Last 5 years, n=13. $NDX closed higher than Day 6 w/in next 5 days 100% of time by avg max 1.1%. $SPX closed higher 85% of time by avg max 0.7%. R/R >3:1 pos.
I ASSUME NO ACTION. STATISTIC SOUNDS GOOD BUT…
MAJOR RESISTANCE ZONE AHEAD, SEASONALITY SHORT TERM (OPEX) – BAD, LONGER TERM ALSO BAD, EVERYBODY AROUND ME IS LONG+
VIX 27.57, lower BB 26.61