Mid-week market update: What should one make of sentiment readings? Credit Suisse reported that long/short hedge funds are now in a crowded long position:
One result of April’s latter month short covering is an all-time high net long exposure among equity long/short managers globally, albeit on a historically low gross exposure.
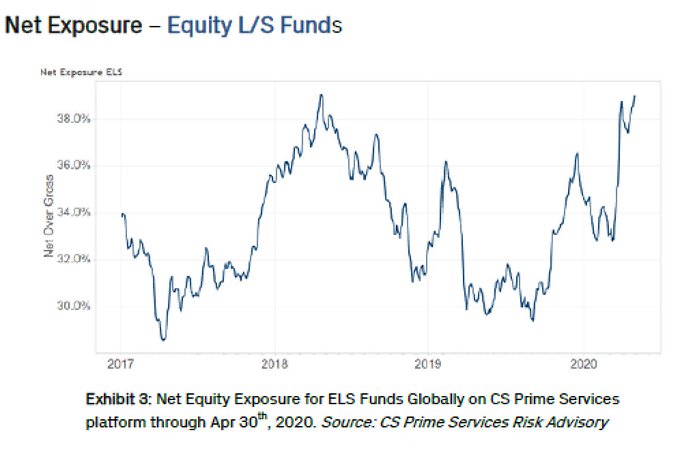
That’s contrarian bearish, right? Yes, but that snapshot isn’t the whole story.
Sentiment is very diverse, and different market participants have different views of the market. Bloomberg also reported on the Credit Suisse findings of long/short fund positioning, but also highlighted a very different position taken by global macro hedge funds and commodity trading advisors:
As for macro managers and commodity trading advisors, which mostly speculate with futures, net equity exposure is the lowest in about a year, according to the bank’s data.
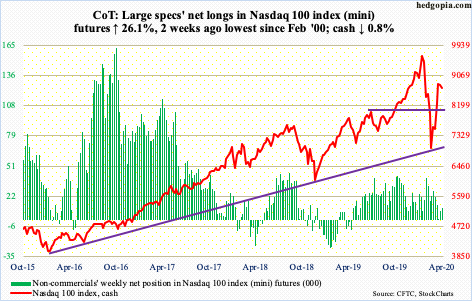
As hedge funds can take either long or short positions, I interpret low net equity exposure as a neutral and not bearish positioning. Indeed, CoT reports of large speculator positions in equity futures like the NASDAQ 100 are not extreme.
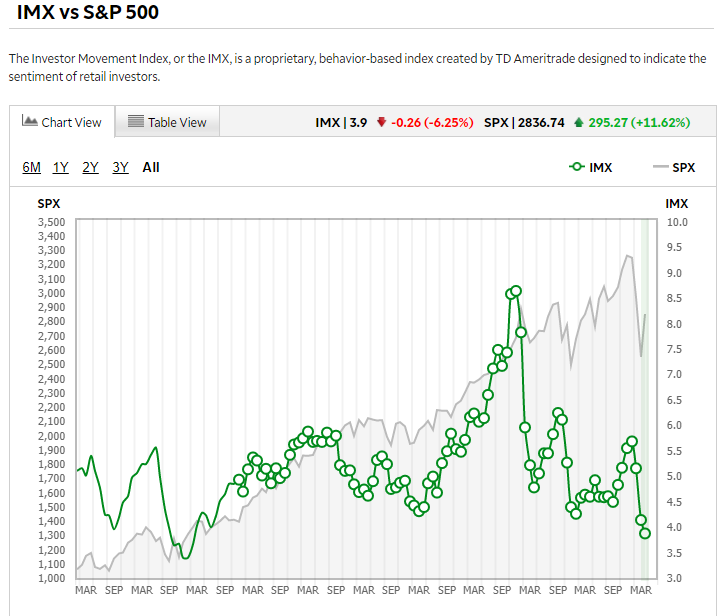
The retail investor enigma
The retail investor is another story. the T-D Ameritrade Investors Movement Index (IMX), which measures the risk appetite of the firm’s retail investors, shows a deeply defensive condition that was only surpassed in late 2011.
While IMX shows excessive cautiousness, which is contrarian bullish, data from the AAII sentiment surveys are a bit of a puzzle. On one hand, the weekly sentiment survey normalized from a bearish extreme to a slightly bearish, but neutral reading.
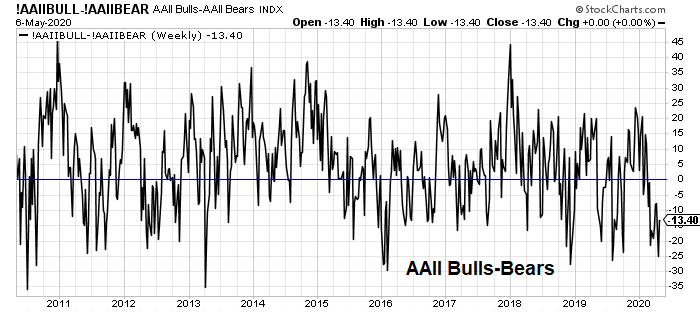
On the other hand, a supplemental survey of AAII members of what how they are coping with market volatility shows a bullish bias.

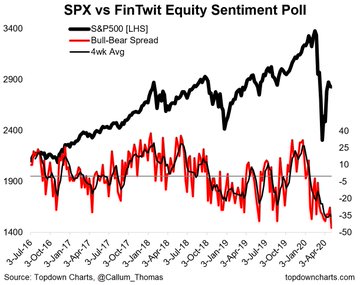
Here is another head scratcher. Callum Thomas’ weekly Twitter poll has moved to an all-time low in net bearishness, despite the market rally. In the past, sentiment has moved more or less in line with price momentum. Not this time. Bearishness has been rising for fundamental reasons, while the technical view has been roughly neutral.
Resolving the contradictions
Here is how I resolve the contradictory conditions from the different sentiment models. First, most of the models cited focus on actual positioning, or what different investors are doing with their money. Sentiment surveys, like the AAII weekly survey, are more volatile because it only asks the respondents’ opinions about the market. Opinion surveys are therefore less reliable than positioning surveys.
Sentiment readings are not extreme. While there are some pockets of excessive bullishness or bearishness, market players are diverse and their aggregate views cannot be characterized as extreme panic or greed. However, the bullishness expressed by the AAII supplement survey suggests there is a group of short-term retail traders who were whipsawed by selling out at the bottom, and now don’t want to miss the rally. On the other hand, the record level of bearishness shown by the Callum Thomas weekly FinTwit survey is also likely to put a floor on market prices should the market weaken.
In the short run, my base case scenario calls for a trading range between 2750 to 2950 as the battle of bulls and bears rages on. The S&P 500 breached an uptrend line and started to trade sideways on April 21, and the range-bound pattern is starting to be defined. In addition, the daily stochastic recycled from an overbought condition into neutral territory on April 30, indicating a loss of momentum and the bulls had lost control of the tape, but market’s failure to test the 50 dma is an indication that the bears do not have control of the tape either.
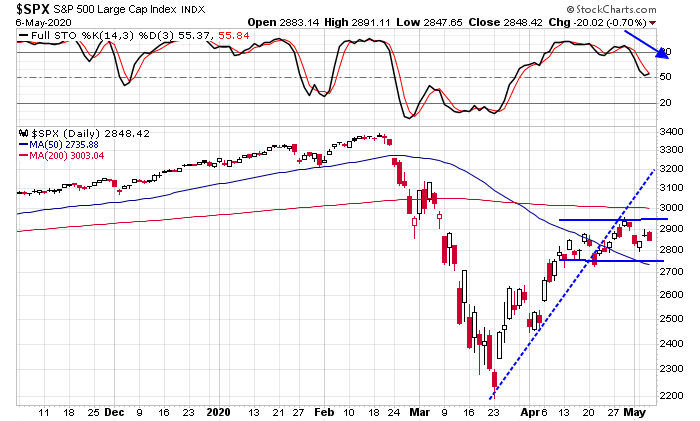
The market became extremely oversold on a 1-2 day time horizon last Friday, and it was not surprising to see price recover. However, the bullish impulse failed soon afterwards, which is supportive of the trading range scenario.
Until we see either an upside breakout or downside breakdown, the current environment calls for a strategy of selling the overbought rips, and buying the oversold dips. As the market is neither overbought nor oversold on a short-term basis, my inner trader is content to stay on the sidelines in wait of better opportunities.
When a bubble pops, the first upleg in the new bear market has investors still in the mindset of the previous long bull market. Look back at the Dot.com and 2007-8 real estate crashes. Investors in those huge bull markets become accustomed to buying the dips and ignoring the warnings of experts. When they made their first big rally in their new bear markets, investors thought the worst was over and the bull market narratives (the internet will change the world and real estate never goes down nationally) were back in play.
Remember, the bottom of March 23 was only just about a month after the Feb. 19 all-time high. The optimism that built up over the ten years from the GFC onward wouldn’t be gone in a month. It is going to take a long and hard dose of bad earnings, dividend cuts, social unrest and terrible economic numbers to smother that hot-blooded ingrained optimism.
Simply put, the fact that the S&P 500 and especially the Small Cap index are down so little from their highs compared to the Main Street carnage (some of which will surprise and be permanent) screams that investors are extremely optimistic in comparison. to the new realities.
During the 2000 – 2003 bear market the 200 dma (either sma or ema) repeatedly served as resistance. It’s a bit eerie to note that the current rebound has halted at that point. Maybe this time the 50 dma will serve as support but if not, watch out below.
For what it is worth, S&P500 and DOW daily MACDs just crossed down today, and the Nasdaq daily MACD isn’t too far behind. The probability of a big uptick from here looks much more remote than it was at the beginning of April or even mid April. The daily MACD sees to be a pretty reliable down turn indicator, but how much down? I sure don’t know.
Also, the monthly MACDs for S&P500 and the DOW are crossed down and have been for some time – they seem quite a reliable indicator of trouble ahead for the indices.
When trying to come up with a psychological analogy, it’s the the post 9/11 market that comes to mind.
The world changed overnight. Airlines/ insurance companies took a hit. The travel and entertainment sectors ground to a halt. Oil prices spiked (rather than declined). Stock exchanges were closed for a week. Financial firms were unable to function. A wave of Job losses, albeit concentrated in NYC.
It’s not a perfect analogy, of course. But changes were implemented that endure to this day, and life returned to a semblance of normality relatively quickly. Might the 2020 recovery follow a similar path in terms of speed and resilience?
The rational expectation is that market indexes need to pull back further to fully price in the damage to today’s global economy. However, the questions to ask might be (a) why have they yet to retest the March lows, (b) is it inevitable that they will, and (c) given that every transaction entails two parties – who’s buying every attempt by the bears to take this market down?
The difference is the corporate and sovereign debt bubble that in 2020 became so big that any recession would be devastating. Suddenly we had that recession and the corporate debt market was broken. The FED was aware of the risks and are moving heaven and earth to fix it with massive purchases. We don’t know if Humpty can be put back together again.
rx I’ve been trying to make sense of these short term signals in institutional investor buying. I cannot tell if the large hedge funders “know something we don’t” but it seems likely Mnuchin is highly invested in keeping the market inflated this election year. whether that will be successful long-term is of course unknowable. the large buyers seem to make big purchases days before market shifts, including those related to Fed announcements. Check this out if interested. https://squeezemetrics.com/monitor
Who knows – despite all of the counter arguments made by sophisticated market players, maybe it all really comes down to ‘Don’t fight the Fed.’ It worked for Marty Zweig over his 30+ year-career, probably worked long before he coined the phrase, and will probably continue to work long after we’re all gone.
Seems like in this cycle “don’t fight the Fed” will work until it doesn’t, if that makes sense… if only we could figure out exactly when that will be!
Interesting story that predicts deaths due to tuberculosis will increase substantially following the Covid-19 lockdown:
https://www.scmp.com/news/world/united-states-canada/article/3083150/coronavirus-lockdown-could-trigger-14-million-extra
There is a current joint US-Taiwan research going on TB vaccine effect. Taiwan’s CORVID19 fatality rate is extremely low. There is evidence of benefit from TB vaccine (input from one of my friends, a researcher in a college in Taiwan). In Taiwan every child is vaccined against TB for free since 1950’s. Everyone above 50 receives pneumonia vaccine once and yearly flu shot free since early 2000’s. This has greatly reduced number of older people from serious lung infections and saved a lot of money for the universal care system. We should do the same here in the US.
We last visited Taiwan in 2017. If it wasn’t for the climate I would actually consider retiring there.
I’m reading that meat prices are up 8%.
I still recall the 1970’s inflation. For sale ads :
Prime Rib Roast for sale.
Take over payments.
I’ll always remember the beaming coworker who scored 11% financing on a new Mustang in 1985.
And my first mortgage in the early Nineties ~7%.
Stampede into online brokerage accounts
TD Ameritrade (NASDAQ:AMTD) disclosed a record 608K new funded accounts for Q1, as well as more than 3x the number of users in March Y/Y, while brokerages like Schwab (NYSE:SCHW), Fidelity and E*Trade (NASDAQ:ETFC) also reported record new users. Earlier this week, millennial-focused trading app Robinhood also closed a $280M Series F funding at an $8.3B valuation. In fact, finance apps have seen 55% growth in usage time from the end of 2019 to the week ended April 18, according to data from App Annie.
Increasingly hate TDA and may move to IBKR if they aren’t worse. All kinds of problems, CS is useless.
Hi, Thank you for this piece.
I think the CS chart is very misleading as you said because the net to gross ratio is irrelevant when gross is too low. Currently, the different prime brokers are showing net exposures for the L/S the low historical percentiles and l/s funds are showing low beta to SPX.
In general I believe market participants are under exposed to equities:
Mutual Funds had cash at their highest levels since at least 10y; Vol control, Risk Parity and CTA players were all underexposed because of either price momentum or high realized volatility; long only players have low beta to the market.
On the other hand this rally looks like it was bought by retail through both options and cash on low volumes after the group had capitulated in march.
So the pain trade is probably higher. Now we have seen short covering in the last weeks so the speed of the rally will most likely be slower but i definitely agree that the market will probably be bought on dips.
All in all I believe like you that 2750 is probably a strong resistance now. 2950 i’m less sure as positioning points to general underexposure of the main players.
On a higher level note, the Fed has definitely backstopped the economy and while we could have issues with the reopening of the economy and a second wave, it seems like a lot companies will be able to finance themselves through this which does solve the hurting locally in time but saves jobs in the longer run.
Vol is still high so my conviction is to sell puts around 10% below current spot. I believe it’s a great risk reward and ties everything together.
Just my 2 cents.
Does anyone have insights into the 10 year Treasury action today?
My question also. Seems unusual to have such a drop in yield when the stock is up.
They say that the bond market is smarter than the stock market. We’ll find out in coming days and weeks.
NASDAQ 100 is up for the year.
Which may provide secondary support for the SPX and DJIA – I think that’s where under-invested fund managers will look when trying to catch up.
What are the odds of seeing SPY>294/ SPX>2954.86 either tomorrow or Monday? Probably better than 60/40. Even a bad jobs report wouldn’t derail those odds. JMO.
SPY>294.88.
It doesn’t look like the jobs report surprised anybody. Not sure what’s driving the market up, but its obvious that fundamentals are being discounted.
Jim Bianco is out with a Bloomberg column.
“Even with output returning to 90% of its previous levels, it’s likely that the recession the economy is now in would be twice as bad as the one during the financial crisis, suggesting the recent rebound in equities has gone too far.”
https://www.bloomberg.com/opinion/articles/2020-05-06/buying-what-the-fed-is-buying-won-t-work
It is the length of the recession and not the depth (Greg IP, WSJ; Cam’s quote in the last month). What we now need to monitor is if state after state starts to see an uptick in cases and are forced to reimpose the lock down. If that were to happen, this would be a great time to lighten up on equities, further.
D.V., it is all about the unprecedented support for the economy by the Federal Reserve and the U.S. government . The fundamentals and reality will catch up eventually.
There have been plenty of CV reports outlining some sort of rolling scenarios for the virus. I think that is baked into the pricing.
UCSF Grand Rounds covering vaccines and treatment prospects today https://www.youtube.com/watch?v=OTbVyBdXXpk&feature=youtu.be
Pretty sobering stuff, especially projections published in the NYT re 200,000 cases ‘per day’ + 3000 fatalities ‘per day’ by June 1. So rather than a decline, we’ll see a leveling off, followed by another rise, which is totally ‘a consequence of behavior – people congregating, not wearing masks, doing all the things they’re not supposed be doing.’
Numbers above (200,000/ 3000 per day) refer to cases/fatalities in the US. Not sure if any worldwide projections were made.
Compared to the Spanish Flu pandemic, it appears that Covid-19 cases peaked, dipped slightly, and have already begun to increase again as we approach the summer months – which ‘may mean we’re headed for a very large outbreak in the Fall, making what we’ve seen so far pale in comparison.’
Very much agree, the epidemiological section was extremely concerning. The June data sounds horrible.
Seems to me the market is telling us that this was an overreaction and very soon businesses will be back to normal (without all these capacity restrictions) as the world realizes that covid is not fatal (nor requires hospitalization) for the vast majority of the population.
The bond market does not seem to totally agree with that sentiment. As I have read, there is a divergence occurring between bons and stocks with bonds being far more muted than stocks….
Osterholm Update: COVID-19
Episode 7: Pandemic Wave Scenarios
May 6, 2020
In this episode, Dr. Osterholm and host Chris Dall discuss future scenarios for COVID-19 based on previous pandemics, the shifting epidemiology of the disease and those it infects, and the possibility of college students returning to campus in the fall.
The podcast is available on Apple Podcasts, Spotify and Google Play. Here is the link:
https://www.cidrap.umn.edu/covid-19/podcasts-webinars/episode-7
A good article on the progression of the virus.
https://www.nytimes.com/2020/05/08/health/coronavirus-pandemic-curve-scenarios.html?action=click&module=Top%20Stories&pgtype=Homepage
The market action this week is somewhat reminiscent of 2000. The SPX peaked ~1550, plunged -15% as the Naz tumbled, then remarkably retraced almost 100% of the decline by late Summer.
I just happened to be listening to Bob Brinker on the radio while driving home one afternoon in August as the SPX appeared ready to return to new highs. One caller asked if she should be selling. Brinker’s reply was a little unexpected, yet resonated with me – ‘How many times do you expect the market will allow you to return to the trough?’ The following trading day, I liquidated all positions and moved to cash.
History doesn’t repeat so much as it rhymes. The SPX isn’t even close to retracing 100% of the March decline – on the other hand, the Nasdaq 100 is now green YTD. That might be close enough to call it a ‘repeat.’
My take truly changes on a daily basis – but that’s probably because crowd behavior changes on a daily basis. Monday’s trade was to open a position in VT on a bet the SPX would retest at least 2950, if not 3000. That may not happen. However, the morning high of 2924 comes pretty close, and represents about a +3% gain from Monday’s close. That’s good enough for me.
As for the remainder of my portfolio – I think Cam has it right and I’ll be moving to 100% cash (my version of maximum defense) at today’s close.
A nice chart. S&P500 w/out the FANGs.
https://twitter.com/TheChartReport/status/1258855198740660224
https://www.marketwatch.com/story/everything-you-know-about-growth-and-value-stocks-is-about-to-flip-2020-05-07