Preface: Explaining our market timing models
We maintain several market timing models, each with differing time horizons. The “Ultimate Market Timing Model” is a long-term market timing model based on the research outlined in our post, Building the ultimate market timing model. This model tends to generate only a handful of signals each decade.
The Trend Asset Allocation Model is an asset allocation model which applies trend following principles based on the inputs of global stock and commodity price. This model has a shorter time horizon and tends to turn over about 4-6 times a year. In essence, it seeks to answer the question, “Is the trend in the global economy expansion (bullish) or contraction (bearish)?”
My inner trader uses a trading model, which is a blend of price momentum (is the Trend Model becoming more bullish, or bearish?) and overbought/oversold extremes (don’t buy if the trend is overbought, and vice versa). Subscribers receive real-time alerts of model changes, and a hypothetical trading record of the those email alerts are updated weekly here. The hypothetical trading record of the trading model of the real-time alerts that began in March 2016 is shown below.

The latest signals of each model are as follows:
- Ultimate market timing model: Sell equities
- Trend Model signal: Neutral (upgrade)
- Trading model: Bearish
Update schedule: I generally update model readings on my site on weekends and tweet mid-week observations at @humblestudent. Subscribers receive real-time alerts of trading model changes, and a hypothetical trading record of the those email alerts is shown here.
A sideways pattern
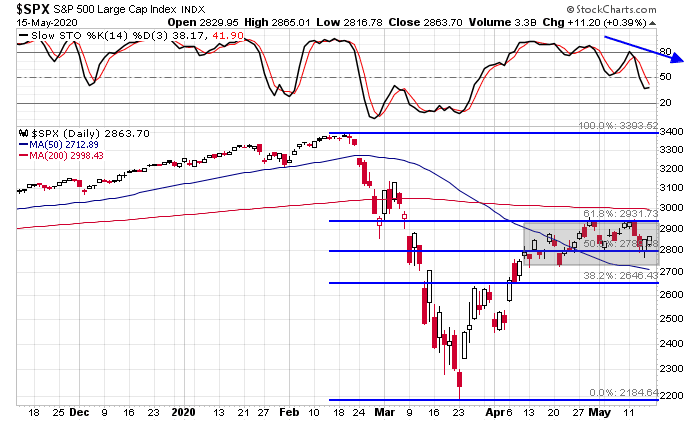
Stock prices have been chopping sideways and gone nowhere in the past month. After a strong rally off the March low, the rally stalled repeatedly at the 61.8% Fibonacci retracement level while the stochastic recycled from an overbought condition. It is becoming evident that the bulls have lost control. That doesn’t mean, however, that the market is ready to go down. Instead, the sideways consolidation could continue for some time.
What’s next? Will we see further chop sideways, or have the bears seized control of the tape?
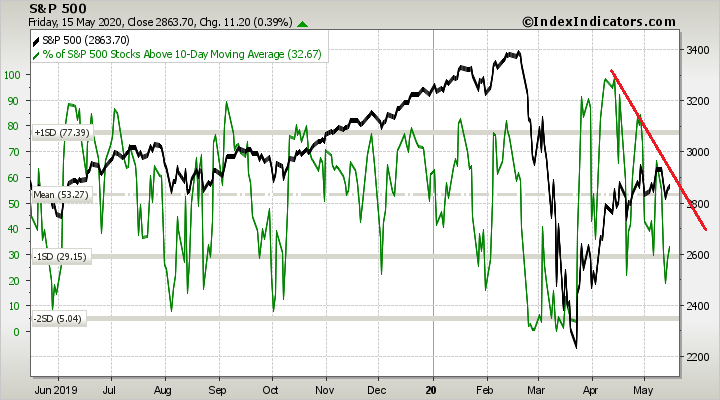
Breadth outlook: Flat to down
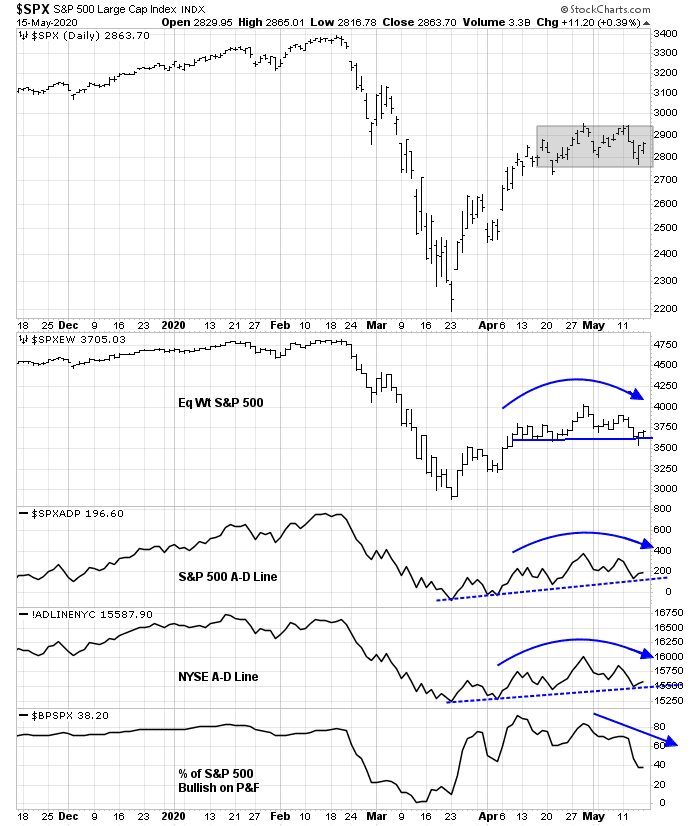
Breadth signals indicate a flat to down outcome. Here is the case for further sideways consolidation:
- The S&P 500 remains range-bound.
- The equal-weighted S&P 500 is holding key support.
- Both the S&P 500 and NYSE Advance-Decline Lines remain in uptrends. The market is not going to decline significantly until these breadth indicators break their rising trend lines.
Here is the bear case:
- The equal weighted S&P 500, the S&P 500 A-D Line, and the NYSE A-D Line are all rolling over.
- % Bullish is exhibiting a negative divergence.
NASDAQ breadth tells a similar story. The NASDAQ A-D Line remains in an uptrend, but % Bullish is also exhibiting a negative divergence.

The risks of narrow leadership
The market has been rising mainly on the leadership of the large cap FANG+ stocks. Even the relative performance of healthcare stocks, which should be surging during this pandemic, have faltered and turned range bound.
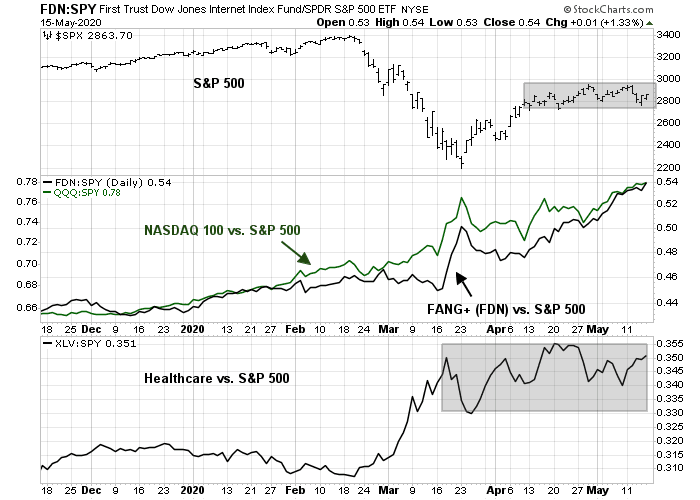
The market’s reliance on FANG+ names brings to mind Bob Farrell’s Rule 7. “Markets are strongest when they are broad and weakest when they narrow to a handful of blue-chip names.”
A bearish catalyst for Big Tech may be on the horizon. In the wake of the Trump Administration’s decision to bar American semiconductor companies from selling chips to Huawei, Chinese official media Global Times reported that Beijing is preparing retaliatory measures. Major targets include companies like Apple and Boeing.
China is ready to take a series of countermeasures against a US plan to block shipments of semiconductors to Chinese telecom firm Huawei, including putting US companies on an “unreliable entity list,” launching investigations and imposing restrictions on US companies such as Apple, and halting purchase of Boeing airplanes, a source close to the Chinese government told the Global Times…
The measures include adding related US companies to China’s “unreliable entity list,” imposing restrictions on or launching investigations into US companies like Qualcomm, Cisco and Apple according to Chinese laws like Cybersecurity Review Measures and Anti-monopoly Law, and suspending the purchases of Boeing airplanes, according to the source.
The US companies mentioned, such as Apple, Qualcomm, Cisco and Boeing, are all highly dependent on the Chinese market.
When the shooting starts in the trade war, Apple makes a big fat target. The stock is the second largest stock in the major market indices, behind Microsoft, and comprise 5.1% of the S&P 500 and 10.1% of the NASDAQ 100.
What are “smart investors” doing?
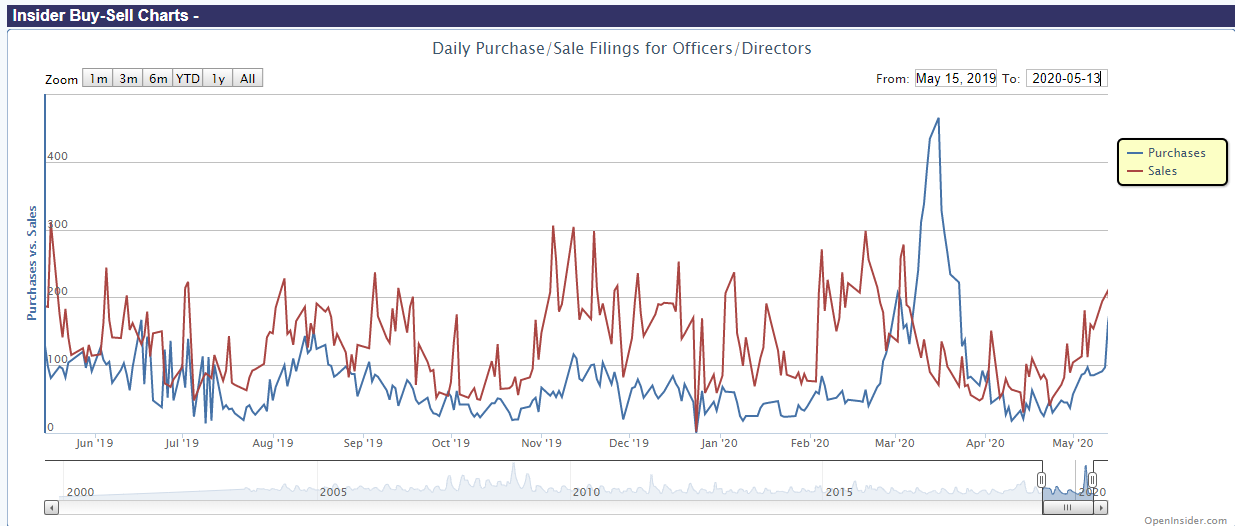
The behavior of smart investors also presents a mixed flat to down narrative. Insider buying spiked when the market hit an air pocket late last week, but sales were above purchase activity. In the past, clusters of strong insider buying have been reasonable buy signals, but high insider selling have not been actionable sell signals. I interpret these conditions as a neutral signal.
On the other hand, a quirky analysis of US senator trading activity shows a flood of recent sales. This signal was timely going in when senators bought in mid-2018, sold ahead of the COVID-19 crash, and bought afterwards/ What should we make of this sudden flood of sales?

Sentiment bifurcation
Last week, we discussed the continuing puzzle on the sentiment model front. The weekly AAII sentiment survey shows a crowded short condition, which is contrarian bullish.

By contrast, most other sentiment models focused on short-term retail “dumb money” traders were in neutral territory.
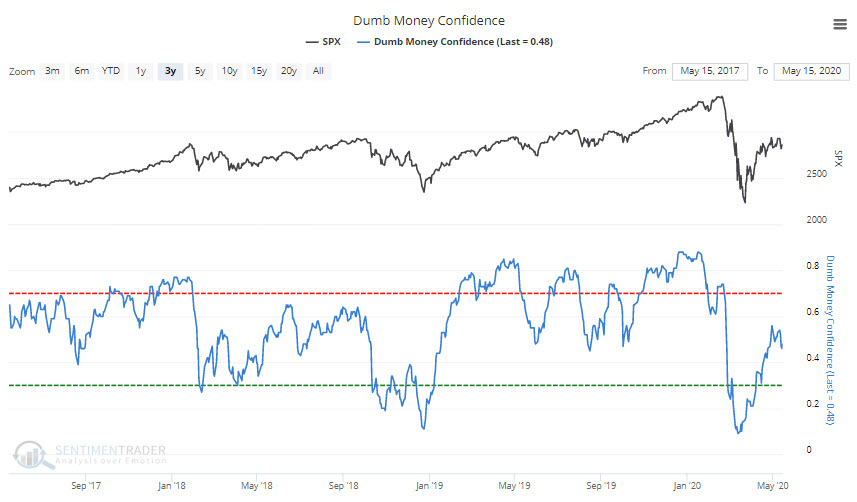
One likely explanation is the AAII survey is capturing the sentiment of new low-information traders that have recently entered the market, attracted by zero commission trading. Indeed, online brokerage firms’ Daily Average Revenue Trades (DARTs) have surged across the board.

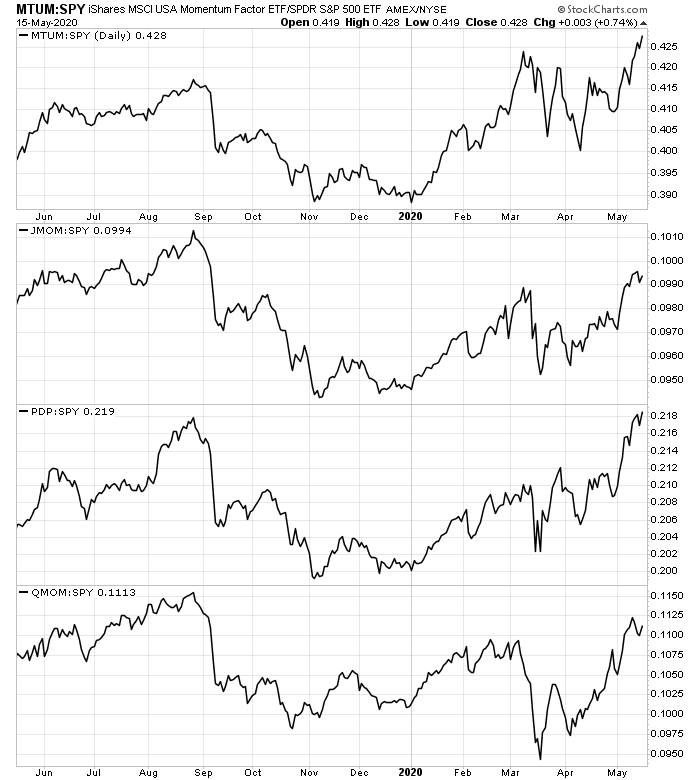
Further age demographic analysis shows that most of the new accounts are young millennial traders. Some analysts have also advanced the unproven hypothesis that the current lockdown environment has deprived Americans of live sports, and hyper day trading of stocks is a substitute for sports betting. In that context, the stampede into FANG+ stocks makes sense. No matter how you measure price momentum, the factor is exhibiting positive returns right now.
A recent Investopedia investor survey confirms the millennial appetite for risk, but also shows a generational bifurcation of risk appetite.
Investopedia’s latest survey of active investors reveals that the recent market turbulence has caused a broad re-thinking of risk: two-thirds of respondents state they have changed their overall investing approach, but how they’re changing appears split down the middle. Those going bigger, buying blue chips on a bargain and grabbing shares in the beaten-down airline sector tend to be Millennials, though there are some Gen Xers and Boomers in the bunch. By contrast those seeking safer havens like money market funds and high-yield savings tend to be Boomers.
The Boomers tend to be more cautious, while younger investors tilt bullish.

The new young investors are bullish, and they trade more. The Boomers are net sellers, but they are likely to trade less frequently. Who wins this tug of war?
In the end, the big money Boomers are likely to win, but not before the market sees a bearish break and the new investors capitulate. In particular, investors should pay special attention the Fed’s warning in its Financial Stability Report, which was released late Friday after the market close.
Asset prices remain vulnerable to significant declines should the pandemic worsen, the economic fallout prove more adverse or financial system strains re-emerge.
The market could trade sideways for some time as the bulls and bears battle to a stalemate, but watch for a cascade should the dam breaks.
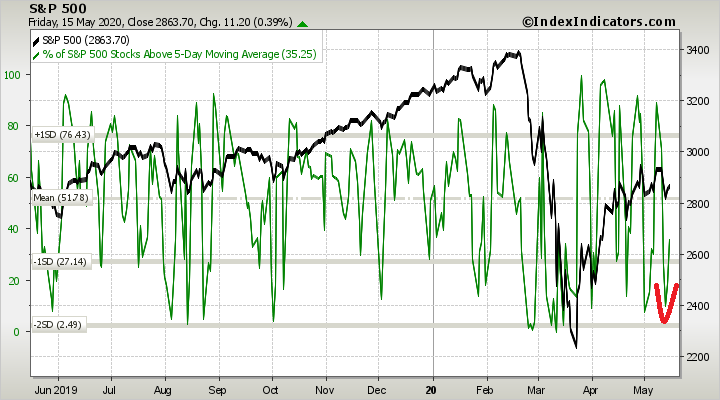
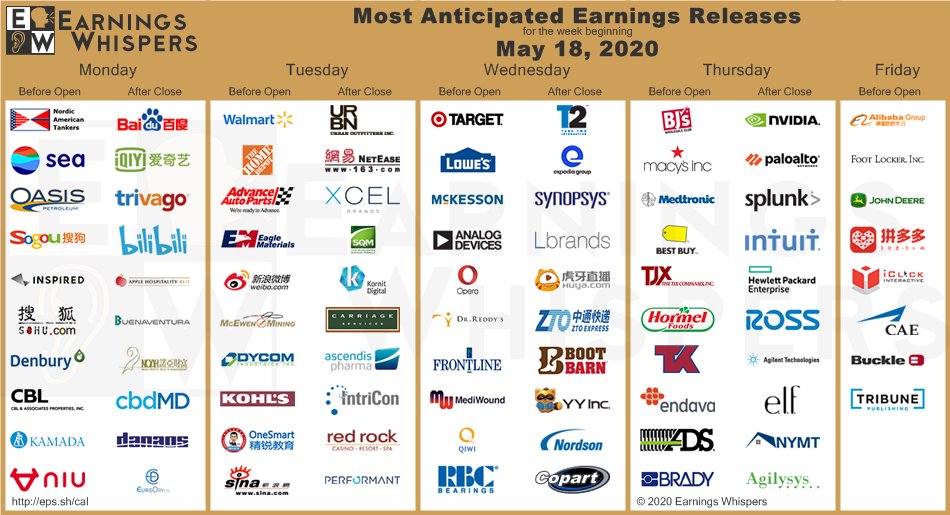
The week ahead
Looking to the week ahead, the market tested support late last week and began a relief rally. Short-term breadth is recycling off an oversold extreme. Barring further unexpected bad news, the market should see a bullish bias early in the week.
Friday’s retail sales print was awful and below market expectations. Many of the retailers report in the coming week, and their reports could prove to be a bearish catalyst for the stock market.
The challenge for the bears is to defend the trend of lower highs in market breadth.
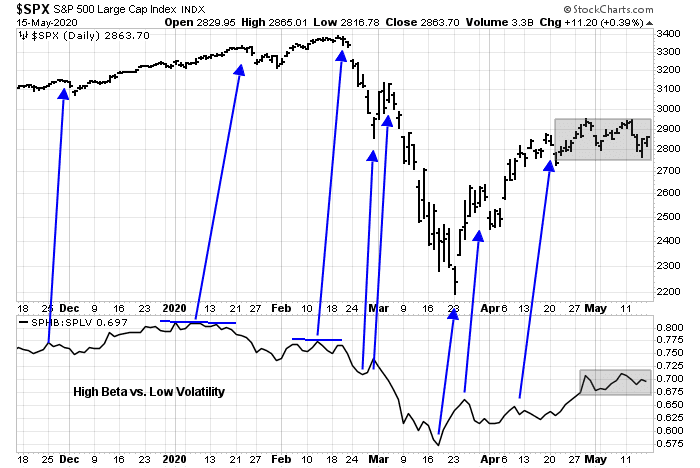
My inner trader initiated a short position last Wednesday, and took partial profits Thursday, but he is still short. He is likely to add to his short position on a rally. Until we see a breakout of the trading range between 2740 and 2950, my base case scenario calls for choppiness. Even the high beta to low volatility indicator, which is a measure of equity risk appetite, has been stuck in a narrow trading range.
The market’s sideways consolidation in the past month has moved the Asset Allocation Trend Model from a bearish to a neutral reading. My inner investor is cautiously positioned, but he will gradually move back to a more neutral view of risk should the choppy range-bound trading continue.
Disclosure: Long SPXU
Thanks, Cam. The proper approach to a range-bound market is to simply trade the range. I recall you did a great job with that last summer.
Interesting find on “US senator trading activity”. W.r.t. the insider index, I wonder if the option exercise counts as buying. If insiders want to take profit on their options, they need to exercise it first and then sell.
It depends on the model, but usually the decision to exercise an option is excluded from insider buying.
Thanks Cam, as always for your analysis, that I enjoy reading every weekend.
I am not sure if the possible Chinese countermeasures, however, are really a bearish catalyst for the FANG+ stocks. We have been observing cloud and software related stocks being bid higher and higher recently, including Friday’s session. Even Druckenmiller’s largest recent buys have been Amazon and Netflix. As growth is ever more difficult to find, the shares of those companies that are still growing in the current environment are becoming the subject of crowded long positions. That trend could continue as the economic outlook does not turn to the positive.
Apple is a singular interesting case…the risks surrounding Huawei have been known for a while, but shares of Apple have been doing well during that period. The logic behind this is that Apple’s most potent competitor (Huawei) is in the crosshairs of the US administration while China wants to keep the economic benefits of having at least parts of Apple’s supply chain in their country. At some point it is possible that China could take material action against Apple, but they certainly want to keep their friendly smile towards companies that are willing to make investments in China and Apple is rumoured to give Chinese company Luxtech some share of it’s business. Possibly part of Apple trying to play a “balancing act” while they are moving other parts of their supply chain out of China.
Another interesting development is the growing hostility between China and Europe, that is emerging now, as Europe is fearing that Chinese investors want to snap up stakes in European companies on the cheap.
The Quiver Quantitative website has some really interesting information. Thanks for posting the U.S. Senator buy/sell chart, Cam. I think the delay in the reporting makes the usefulness of the data questionable. Although, the recent liquidation is timely and interesting.
Looking at the performance of some Senators is quite enlightening. A few I have contempt for are really doing badly. LOL I am surprised that my Texas Senators seem to be particularly bad investors, too. There are also some who have stellar performance histories. Albeit, short term.
Thanks Wally for this interesting website with a wealth of data.
I forgot to put a link in my post, D.V.
https://www.quiverquant.com/sources/senatetrading
https://www.federalreserve.gov/publications/files/financial-stability-report-20200515.pdf
Thanks Cam and len g for posting this extensive, detailed report. The report is very very alarming and worth reading for all those who monitor underlying risks in the economy. The report reads like a GFC ‘lite’ and a mini rerun of 2008 crisis. The US Fed has done an exemplary job of seeming and shoring up the financial system, no doubt about it and the old adage “don’t fight the Fed rings true, so far. That said, it appears that the financial markets are balanced at a knife point and significant risks still remain. Cam’s warning of reducing equity exposure needs to be amplified a hundred times, especially if the pandemic continues unabated.
Please read.
Maybe someone can enlighten me on something in the Fed report D.V. posted. On page 20 is a table of outstanding asset valuations. Under Treasuries it shows the total Outstanding valuation is $16.629 Trillion yet the government is are about $25 Trillion in debt. Where is the other $9 Trillion in debt? If the Fed is holding $9 Trillion in Treasuries wouldn’t that still be included in the total outstanding Treasuries? I’m curious where the other $9 Trillion of debt is located.
What’s your source for the $25T? Table in Fed report is as of Q4 2019.
News reports after the Covid spending. Still I think I have seen reports of $20 T around the beginning of the year. I know it was more than $16 T at the end of last year.
https://usdebtclock.org/
Live stats on the national debt, along with many other interesting figures.
Thanks, RX. Those numbers would speed up considerably if I stopped paying my taxes. LOL
The Stability Report shows how the Fed is amazingly putting fingers and toes in the cracks in the dike. Hopefully, they aren’t overwhelmed by investors running for cover.
The most disturbing thing I read was the situation of insurance companies. Because interest rates for government bonds has been so low, they were the leading buyers of all the innovative financial instruments that are under stress and may turn from bad to ugly. The Insurance ETF is down over 30% this year. Ominous. Remember 2009.
An area of corporate problems not discussed is pension funding. A bear market in stocks and corporate bonds results in high refunding expenses, especially for old-line companies that have defined benefit programs.
Reminds me of the road signs in the Rockies – “Watch For Falling Rocks”
https://www.foxnews.com/us/colorado-highway-closed-boulder-rockslide-roadway
Many countries are taking calculated risks and slowly reopening economies under the assumption that a vaccine won’t come soon enough.
https://apnews.com/77811f188de90cc53306d929b365d2d2
RX, if they wait they may lose their economies and practically have to start from scratch. And, I’m reading some articles that are really questioning the death rates. Like cancer diagnosis are way down and so many cancer deaths may be attributed to Covid-19. There seems to be pressure on doctors from somewhere to classify deaths from just about anything as Covid deaths.
No doubt there are a lot of deaths due to Covid-19 but the media and others seem to want to keep the numbers inflated.
Not necessarily saying they’re making the wrong decisions. If you’re running a country, there must be immense pressure from all sides right now. At the end of the day, you need to come up with something – I’m sure they’ve considered every possible angle in arriving at their final directives.
There are a couple articles that talk to death rates. It seems to me that if you tale the “normal” death rate and then look at equivalent periods since Covid kicked in, it’s not unreasonable to assign the additional deaths (if any) to the pandemic hit. So, for example, the province of Quebec in Canada saw a 35% increase in deaths in April:
https://nationalpost.com/health/covid-19-appears-to-have-increased-total-number-of-quebec-deaths-recorded-in-april-by-35-statistics
By my calculation that puts the deathrate for April at 0.017%. I believe that that is about the TOTAL for any flu season. Make an assumption of 5% of the Quebec population has got the disease so far, the the death rate for the province (linearly) would put the death rate Covid at about 0.35% (or 20x the flu death rate).
The other article shows many spikes for multiple countries:
https://www.nytimes.com/interactive/2020/04/21/world/coronavirus-missing-deaths.html
The accompanying table in the article is quite compelling.
Great article and charts, Joyce. I’m surprised the NYT didn’t include a chart showing the U.S. EX-NYC.
I was too, but I could not find monthly stats for NY or NYC. However, the ambulances running back and forth and body bag storage in freezer trucks on an NYC pier suggests that the number of deaths is extra-ordinary. 35% up? Who can say at the moment? But certainly more than usual….
There is overlap. Some covid deaths are shall we say “pure covid”…eg..a.previously healthy person who would not be likely to die in the next year. Then you have some with a guarded outlook for the next year…doesn’t matter if it is heart, Alzheimers,copd,renal….whatever…well, if someone like that gets covid, the odds are they may die with covid and so they add to the statistics….just like when you borrow you pull consumption forward. So what is the real risk of this virus? Probably less than the numbers indicate, but definitely not zero. Think about those people you see on motorized wheelchairs with the oxygen bottle, they don’t likely have 10 years to live, if they get covid odds are against them. I have a friend who runs a large HIV clinic in NYC and he is impressed by the virulence of this disease. I think for this market the long term effects of the job losses and changing behavior of consumers…esp..movies, restaurants, large events..etc will be hard to overcome. Unless the Fed starts buying insolvent companies or ETFs that include zombie companies the market is bound to go down. But, this is my bias which I am unable to shake…I don’t believe this market…it was overdue for a drop before covid…or PE of 40+ can be the new normal, because there is no way that earnings are not going to hurt. If banks tighten the credit because borrowers are more risky, where will consumption come from.
So, maybe at some point we see less than expected deaths if some of them were unfortunately pulled forward
More like a compulsory “culling” of the human herd. And reopening before the sickness / death rate is brought under control may well prove to be a very foolhardy thing to do – if one cares about one’s fellow citizens.
Spot on Joyce. Keeping fingers crossed. We do not have to wait that long. Texas opened on May 1 and is already showing a spike in cases.
There is a move to re jig supply chains from China to other countries. The idea of Just in time inventory is being changed to Just in case inventory. Some of these supply chains may return to more advanced nations that have higher costs of doing business. It worries me no end that we may be looking at inflation in the pipeline (though moderate inflation is usually good for stocks). So far no inflation in site, though.
https://finance.yahoo.com/news/modernas-experimental-covid-19-vaccine-113945501.html
So here we are, 20 minutes before opening and the SP500 futures are up nearly 3% on the belief of more stimulus. Is it possible that there is no big low in the future and that we should all jump in with both feet here. Is it in fact:
“The BEARS are losing control, what’s next?”
And some very preliminary Phase 1 vaccine results, lol. COVID is cured!!!!
Unreal.
Scott Gottlieb’s opinion piece pointing out doctors get COVID treatment guidance from Twitter now with a silent CDC. I’ve seen much of this on Twitter.
https://www.wsj.com/articles/cut-through-the-fog-of-coronavirus-war-11589738903
lol.
I think Joyce poses a valid question.
Always consider alternative scenarios. There are a lot of smart people with informed opinions, all of which feed into market pricing. In the end, it’s price that deserves our attention.
Exactly, rx. We seem to be in a range at the moment. But with stimulus and the pump and trump attitude of the political leaders in the US, it seems there is a good chance that the range bound resolution could well be up while eps goes extremely high. The markets seem to be “good news only” at the moment.
Howard Marks points out the policy choice is the fed extends endless support, owning more and more non performing debt or allows large declines.
Will they make history? Could anything possibly go wrong? lol
https://www.bloomberg.com/news/articles/2020-05-18/oaktree-s-marks-says-fed-support-isn-t-forever-distress-coming
the Potemkin market (about 34:00) (with 20% unemployment)
It’s almost always a tough call when timing the market.
I hedged my bets and closed half of a SPY position (which was itself only a 25% allocation) on Friday ~286. I considered adding back this morning ~293 but opted not to – now it’s >295.
Cam’s base case scenario appears to be nearing a decision point as the SPX breaches 2950.
In the meantime, cashing in the lottery play on airlines.
Maybe the key to understanding this covid19 crash and its subsequent meteoric recovery off of the low is to figure out the main players that crashed the market and the ones that initially helped lift it. I don’t think the retails were buying when it was near the lows.
I came across this article: https://www.thinkingaheadinstitute.org/en/Library/Public/Research-and-Ideas/2019/11/TPA
Huge and small institutions seem to be adopting Total Portfolio Approach instead of Strategic Asset Allocations with a focus on foregoing benchmarks/alphas and focusing instead on total returns and responsive/dynamic adjustments to their portfolios. This responsive/dynamic adjustment part sounds spooky and sounds like risk parity. Maybe that was what crashed the market but not sure what lifted it from the lows.
Closing the remainder of SPY here @ 295. Sure, there’s room to run higher, but probably not before a decent pullback. Today will likely mark the third closing print higher following last Wednesday’s close of 281.6 – odds of a fourth day aren’t compelling.
The SPX intraday high of 2957? Just enough of an overthrow to suck in breakout buyers. 295 feels like a place to reduce, not a place to add.
“Our readers’ recent behavior and overall market activity tells us a few things, besides the obvious. The extreme volatility of the past several months has not scared individual investors out of investing altogether. Older generations may have bailed on the stock market for now, and maybe forever, but they have been making methodological moves with their money to protect their nest eggs and prepare for a long downturn.
Younger and riskier investors, who may not have suffered losses in the Great Financial Recession, are playing two hands at the table. One bets on past winners, piling into the blue chips that have been driving market performance. The other is bravely venturing into the most devastated sectors of the stock market, searching for alpha amid the ruins.”
https://www.investopedia.com/recent-market-volatility-has-caused-risk-split-among-investors-4844916
Thanks, Sanjay. That view resonates with me.
Joyce- I’ll take a stab at addressing your question, including the many questions that lie behind your statements.
1. When timing the markets, it’s inevitable that we’ll be wrongly (ie, badly) positioned at times. Looked at another way, what are the odds that we’ll be correctly positioned 100% of the time?
2. It always feels worse to be left behind when the market goes up (whereas going down with everyone else just feels run-of-the-mill bad). Try ‘netting’ the experience against the many times you’ve watched the market pull back while sitting in cash.
3. Being a good investor does not translate into winning on every trade, or even winning every year. The last I heard, Warren Buffett is down around -25% ytd – more than twice the decline in the SPX.
4. The SPX is up >800 points/+35% from the March lows – does that sound like a good time to jump in with both feet?
5. SPY traded -7% lower (~273 intraday) than today’s close last Thursday. That’s an average year’s return in less than two trading days. Why open a position @ 295 (~220 SPX points higher)?
6. Along the same lines – it’s a highly volatile market. If it’s possible to capture a +7% gain in two trading days, why not wait for the next setup? If you’re into playing both sides, Cam has already offered the odds-on ‘next setup.’
7. If you’re restricted to long plays (which happens to be my preference) – decide how likely the market is continue up in a straight line from here. It’s possible, but unlikely. In which case, just wait. The next opportunity lies around the corner.
8. It’s your money. Be price-sensitive. An attractive entry will present itself at some point (ie, let asset prices come to you, rather than chase after them). The SPX may be headed to 3000 within the next few days. That’s OK. There are traders willing to pay up to own the index. You’ll probably feel better waiting for a discount.
9. Your time horizon matters. If you’re certain the SPX will be back to new highs within six months, then buying in here might make sense.
10. Finally, if it was easy none of us would be here. It’s not easy. That’s why market returns are so much higher than the interest on CDs. I actually own a couple of short-term CDs staggered three months apart in a savings account reserved for potential emergencies – which guarantees that any sales of stocks/bonds will be on my terms.
I think we all understand exactly how you feel right now. Unless one was fully invested heading into this morning, we’re experiencing the same frustrations. It’s a double-edged sword. Anyone fully invested today was probably also fully invested a week ago – and as of today’s close is simply back to about even with last Monday’s closing balance.