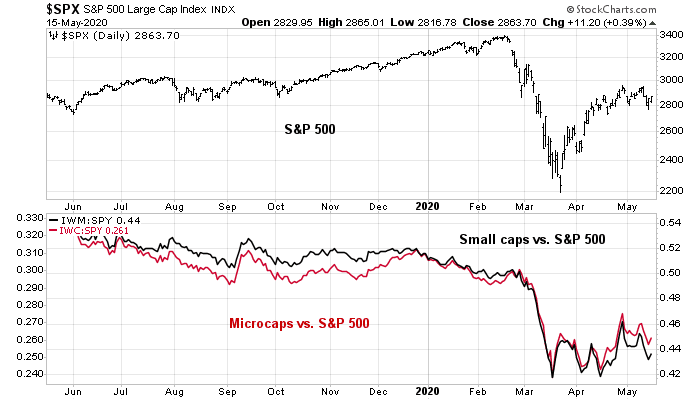
During past major market bottoms, the outperformance of small cap stocks has coincided with economic rebounds. The relative returns of small and microcaps appear to be trying to bottom. It is time to check in on how these stocks are doing.
One way to monitor the progress of these stocks is to check in on the health of small businesses. Small businesses are the backbone of the economy. According to the Small Business Administration, US small businesses provide 47% of private sector employment. Equally important to the check-up is the poor bargaining power of small firms, as they act as a sensitive barometer of economic health.
Good news and bad news
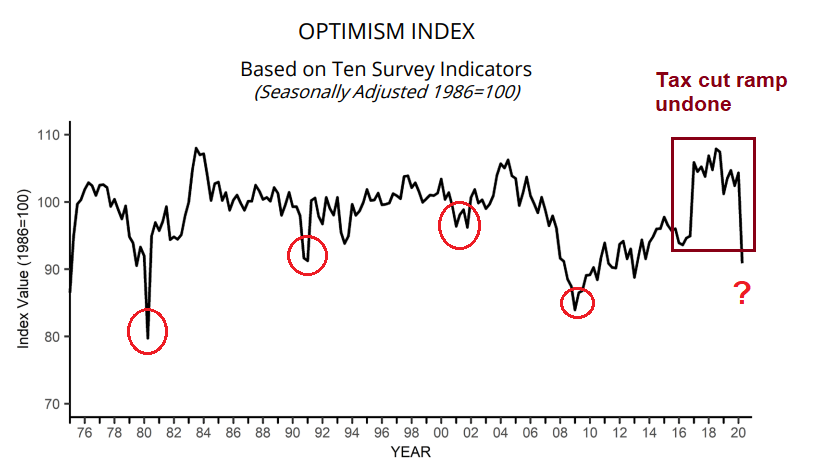
The National Federation of Independent Business (NFIB) April survey had both good news and bad news for investors. Not surprisingly, small business confidence plunged, but the figure was above expectations. The current confidence reading of 90.9 presents a mixed bag. It is roughly the level seen at the bottom of the 1990 recession, and below the 2002-03 bottom, but it is above the levels at the 1981-82 and 2008-09 bottoms.
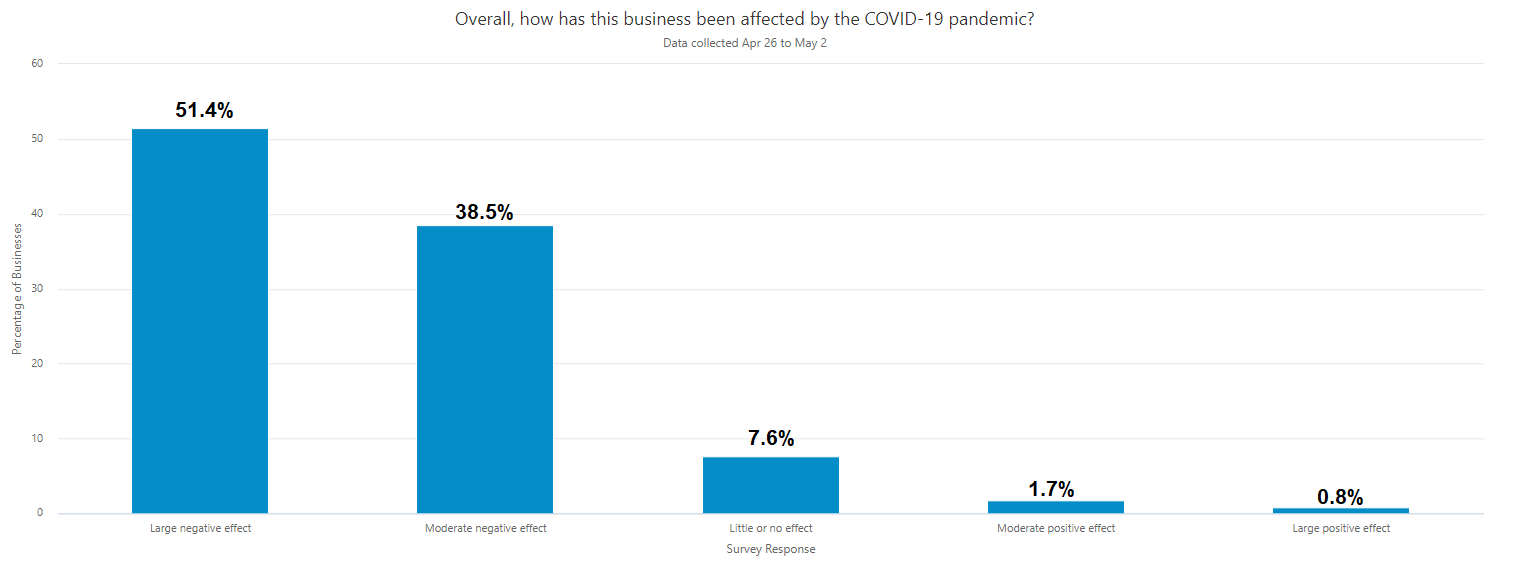
A US Census survey provided more details of the health of small business. About 90% of firms reported either a large or moderate impact from the pandemic.
Equally important but less noticed in the NFIB survey is small business confidence has unwound the ramp up from the 2017 tax cut. As small business owners tend to lean small-c conservative, their souring mood could have electoral implications in November. Marketwatch recently reported on Goldman Sachs strategist David Kostin’s call for an 18% correction. Lost in the headlines is the prospect of a Democrat victory in November, and the possibility that the 2017 tax cuts could be unwound.
Finally, domestic and global politics could conspire to create stock-market volatility going forward. With a U.S. presidential and congressional election just months away, there is a significant chance that Democrats could win enough power to reverse the 2017 corporate tax cut, slashing the 2021 S&P 500 earnings-per-share forecast by $19, in Kostin’s view.
The top-down consensus earnings estimate is about $120-$125 for 2020, and about $150 for 2021. A cut of $19 earnings per share in 2021. Under such a scenario, the market’s 2021 forward P/E of 21.9 would make the stocks very expensive, even for any investor willing to “look over the valley” of this year’s devastation.
How stressed are small firms?
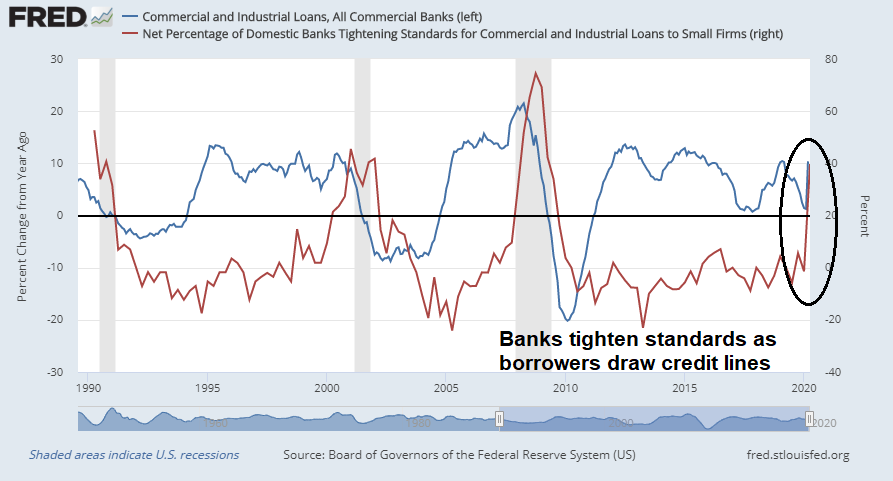
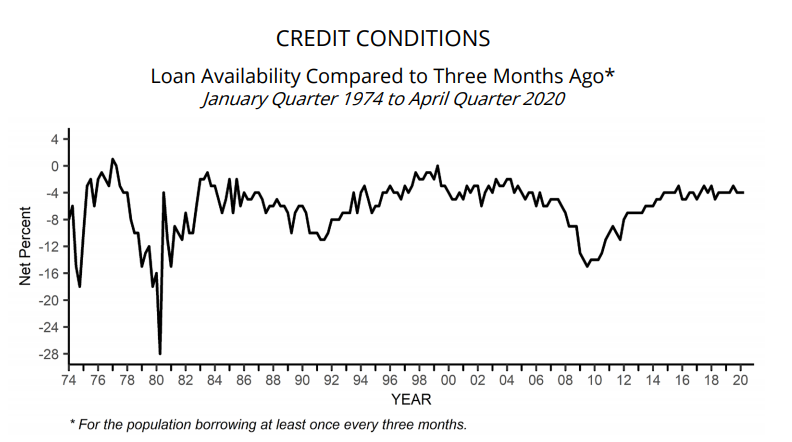
In the current crisis, any analysis of small businesses has to begin with the level of stress facing these enterprises. From a top-down perspective, the loan officer survey indicates tightening credit standards. Banks have also reported a spike in outstanding loans, likely the result of borrowers drawing on their credit lines during these difficult conditions.
Here is some good news. The NFIB survey reported little signs of a credit crunch. Credit conditions are still loose, possibly the courtesy of Fed actions.
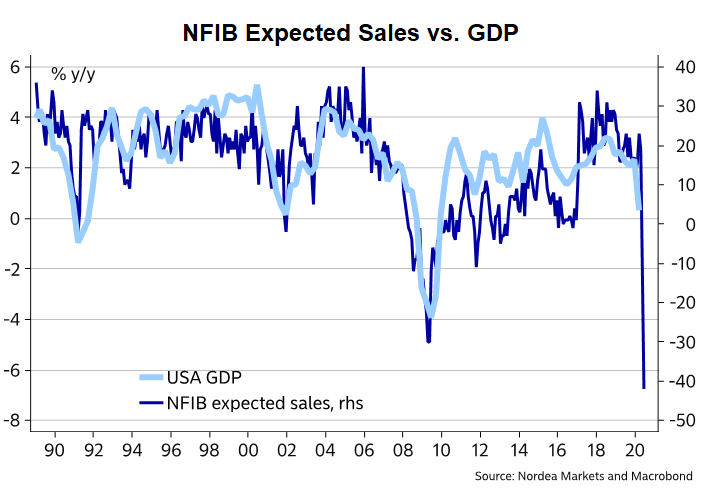
The problem is a lack of sales, not the availability of credit. Sales expectations paint a poor outlook for GDP in the near term.
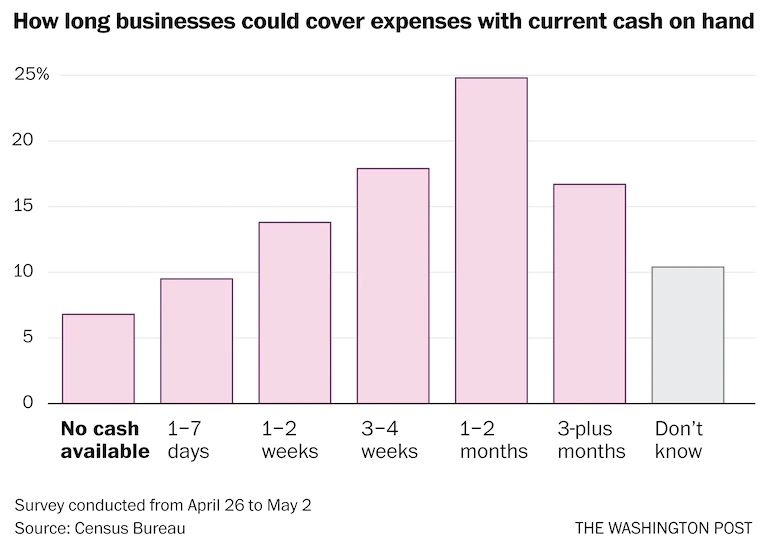
This also shows the limitations of the monetary and fiscal policy. The Fed can ease credit conditions, but it cannot magically conjure up sales. Fiscal support like the Paycheck Protection Program (PPP), has been unable to offer much of a safety net. The Small Business Administration has reported that it disbursed emergency loans to 4.2 million small businesses, but that may not be enough. The US Census reported that 75% of small businesses had applied for PPP relief, but only about half, or 38%, had received any funds. In addition, only about half of the small firms had enough cash on hand to cover expenses for more than a month, assuming that sales dropped to zero. This indicates the poor capitalization of these enterprises.
Restaurants economics
The restaurant industry is a window into the plight of small businesses. An SF Gate article summarized the rule of thumb of restaurant economics:
Of every dollar a full-service restaurant brings in, it spends roughly a third on food and alcohol; another third on salaries, wages and benefits; up to 10 cents on rent; and up to 20 cents on other costs such as marketing, according to studies by restaurant associations. That leaves about 4 cents of pretax profit.
In other words, the typical EBIDA margin (before financing costs) of an independent restaurant is around 4%. An inspection of the finances of publicly listed restaurants shows slightly higher EBIDTA margins. Cheesecake Factory, which recently told landlords that it wasn’t paying rent, has averaged 7-8% in the past few years. Darden Restaurants, which operates a series of different chains, shows an EBIDA margin of 12-13%.
One reader alerted me to the plight of McDonald’s franchisees, which is a group small business that most of us can understand or relate to. CNBC reported that McDonald’s recently deferred the rent and service fees for some franchisees:
McDonald’s is deferring rent for three months for franchisees to lessen the financial blow of social distancing measures. Only about one-third of its U.S. franchisees will be asked to pay March rent. Operators who have seen the sharpest sales drops are also receiving deferrals on service fees.
However, a request for a delay in April payments was denied.
The National Franchisee Leadership Alliance, which officially negotiates with McDonald’s on behalf of franchisees, asked for a two-week extension on service fees and rent due April 10, citing the uncertainty surrounding the Small Business Administration emergency loans. McDonald’s operators make a base rent payment on the first of the month and then pay rent and fees on the tenth, based on the prior month’s revenue for the location.
McDonald’s management denied the request on April 3.
Nation’s Restaurant News reported that estimates of same-store sales are down 20-25% in the second week of April, though it’s an improvement from a decline of 25-30% in the first week. In light of the economics of operating a restaurant, such levels of sales reductions will make most operators unprofitable. As well, the lump sum deferred payments to McDonald’s will be due soon, and could put further stress on franchisees.
In the latest “McDonald’s Franchisee Survey” by Kalinowski Equity Research, analyst Mark Kalinowski projected same-store sales at the quick-service chain had decreased 20% to 25% in the second week of April. That compares with a projected decline of “25% to 30% in the first week of April,” Kalinowski wrote.
Here are just a few selected anonymous comments from the Kalinowski survey:
- “My stores that have no drive-thrus are down by about -40%, but my stores with drive-thrus are down by about -15%.”
- “The ship has a massive hole, right now staying afloat is the priority. Forget growth, it’s gone for a very long time,” one franchisee stated in the survey.
- “The last half of March was the end of the world, but with the limited menu we’ve been able to speed up our drive-thrus to the point we are now only down about -15%. Many stores are still down -20% or more. Let’s keep the limited menu!”
- “There is no fun on the business side. Employees have been great during this whole ordeal. The media continues to incite the negative and place uncertainty on life, economy, etc. — they could help by being positive about the future.”
- “We went from -15% a week ago to -35% the last three days. Won’t come back for a VERY long time in my opinion.”
- “Other companies are doing FAR MORE for their franchisees than McDonald’s. We get useless rent deferrals; others get rent ABATEMENTS.”
- “Deferrals only kick the can down the road. When the balloon comes due 25%-35% of Operators will go bankrupt!”
- “I believe that the McDonald’s system is in a better position to survive than most. Once this is over many ‘mom and pop’ restaurants will not re-open.”
- “Ninety days of decreases like this and we will lose a lot of the smaller franchisees.”
If McDonald’s franchisees, who operate with proven business plans, are struggling, what does that tell us about less well-run independent operators, especially if they are under-capitalized.
How are the customers?
No analysis of small businesses would be complete without channel checks on the health of their customer base. A look at the dynamics of the labor force reveals a good news, bad news story.
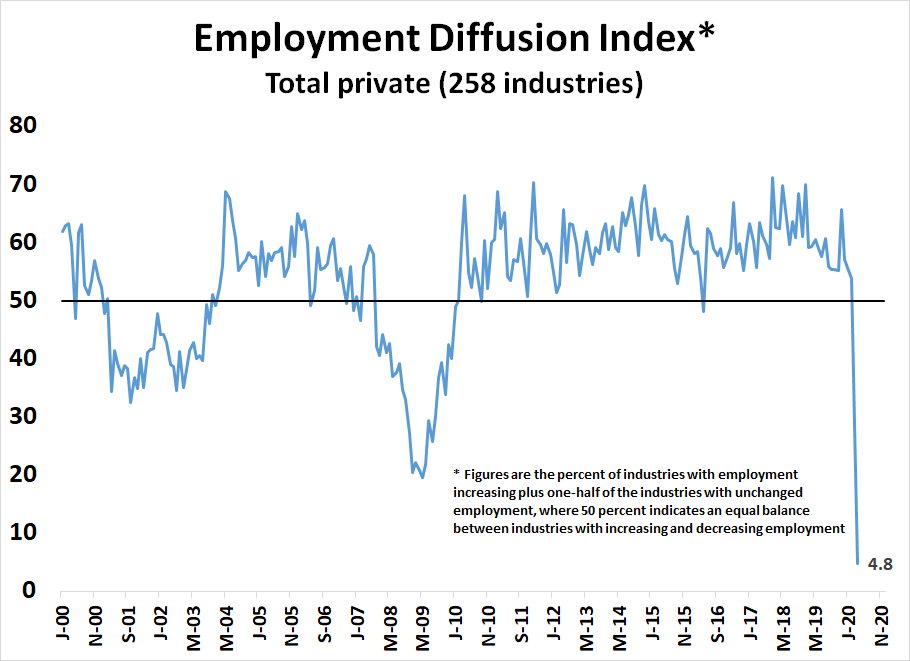
The dismal employment picture is well known. Beyond the headline of over 20 million jobs lost in April, and the cumulative initial claims report of over 36 million jobs lost since mid-March, the diffusion index shows the widespread nature of job losses. No industries are safe. There is nowhere to hide.
Various commentators, including Fed officials, have pointed out that low-skilled and low-pay workers have borne the brunt of the economic pain. Controlling for other demographic factors, 25-64 college educated workers have largely been insulated from the storm.
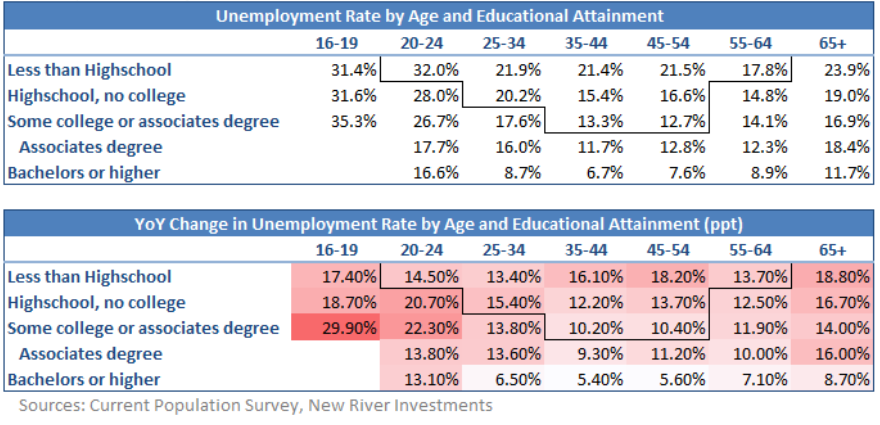
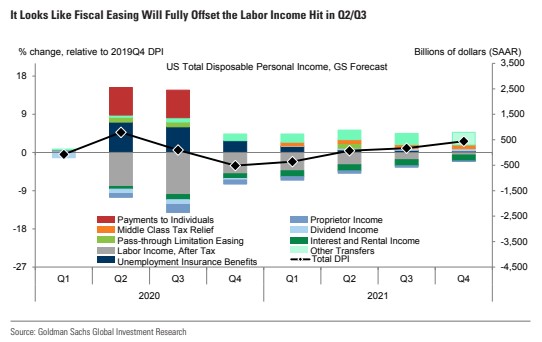
Here is the silver lining in the dark cloud. Since the job and income losses are concentrated among poorly paid workers, Goldman estimates that the fiscal income support will offset the effects of the employment income losses for Q2 and Q3 because of the low level of pay that has to be made up.
Disappointment may lie ahead. The New York Fed’s survey of consumer expectations indicate that job security expectations are plummeting.

The Fed’s Household Economics and Decisionmaking supplemental survey shows that, of those who lost a job in March 2020, 91% anticipated they would return to work for the same employer. However, a recent University of Chicago Booth School of Business paper estimates that 42% of recent layoffs will become permanent. The biggest and more important question is how long will white collar jobs be insulated from mass layoffs.
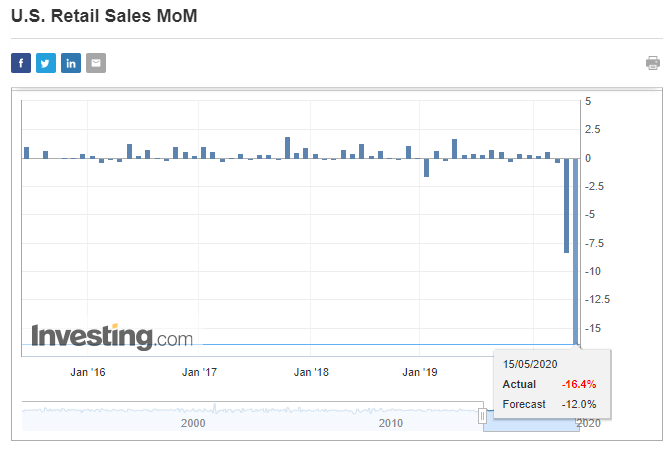
Friday’s release of retail sales was particularly ugly. April retail sales plunged -16.4%, which was below Street expectations of -12.0%.
An economy is an intricate ecosystem, and small businesses cannot thrive or survive if their customers are under stress. As sales plunge, the economic pain will a ripple effect everywhere. As an example, the stress felt by businesses will eventually affect commercial real estate (CRE). CRE investors will struggle to debt payments lenders. Along with failing business, CRE distress will create a cascading effect of loan losses, tightening credit standards, and a credit crunch that creates a negative feedback loop which exacerbates the effects of the downturn. The CRE sector was hit by further bad news last week, when Starbucks announced it was seeking reduced rent for an entire year for its corporate owned US stores. The request was *ahem* not well received.
State and local governments are facing budget pressures of their own. The National League of Cities analysis estimates American cities will lose $360 billion in revenue through 2022 owing to COVIE-19. The worst hit cities will be in Pennsylvania, Kentucky, Hawaii, Michigan, and Nevada.

While the Democrats have pushed through a $3 trillion bill with considerable relief for lower levels of government, the bill is likely to die in the Republican controlled Senate. The next round of fiscal support is unlikely to be passed swiftly in the near future, as the squabbles between both sides of the aisle hold up the details of any bill.
The risk of further damage from the economic aftershocks is high.
Gold and small caps
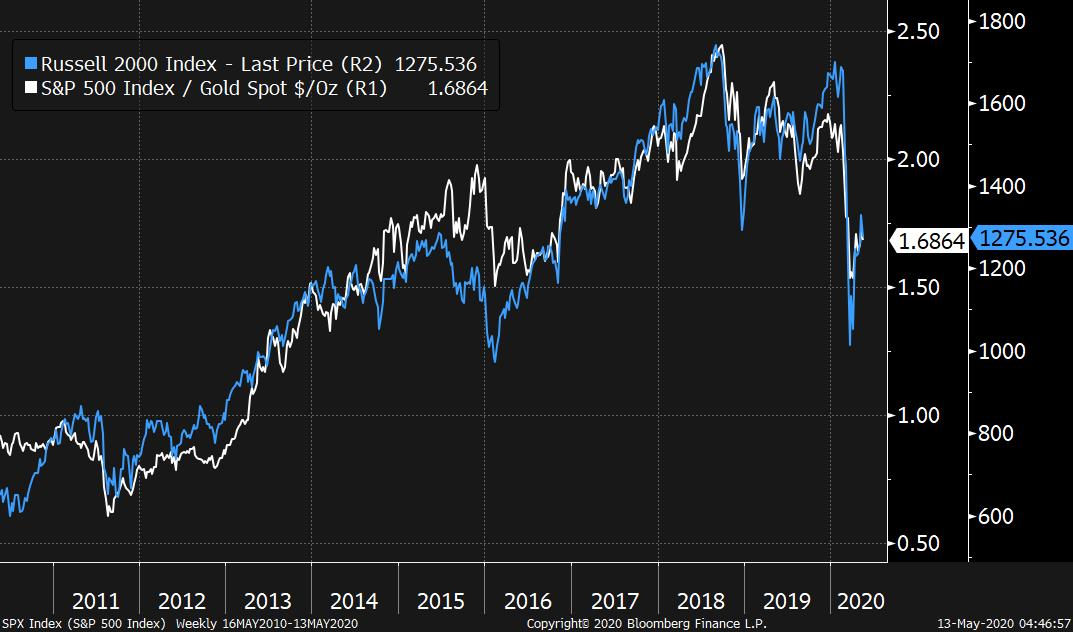
What does this mean for investors? From a cross-asset and big picture perspective, Joe Wiesenthal at Bloomberg recently highlighted the importance of the stock-to-gold ratio.
It’s such a pure and simple expression of optimism versus pessimism. When you bet on stocks you’re betting on humans endeavoring to do productive things. When you bet on a shiny inert metal you’re betting on a shiny inert metal. Here’s the long term chart of the two compared.

Wiesenthal observed that the stock-gold ratio is correlated with the performance of the small cap Russell 2000.
What’s also interesting — and clear in retrospect — is that the optimism cycle that started in 2011 didn’t just come to a screeching end in early March. The optimism cycle ended in the middle of 2018. This was in the wake of the tax cuts (late 2017) and the early 2018 budget deal, which actually boosted spending substantially. Not only did the stocks/gold ratio peak then, but so did the Russell 2000 small cap index, which never regained its 2018 peak. An overlay of the stocks/gold ratio against small cap stocks is shockingly consistent.
I began this week’s analysis with a focus on the relative performance of small and microcap stocks as an indicator of the market’s perception of an economic turnaround. While the jury is still out from a bottom-up analysis of small business outlook, real-time cross-asset analysis suggests that the prognosis is not encouraging.
Cam or anyone else,
Can the banks withdraw the lines of credit previously agreed upon from their customers? If yes, how often does than happen in practice? Can the businesses take any remedial actions?
Thank you.
Here is the what I have found:
A bank cannot just pull the line of credit. Often, the withdrawal from the line of credit is subject to covenants such as asset values/reserves, A/R or net income / EBITDA. As long as they are in good standing, the bank has to lend.
If the bank is the creditor, they can pull a LOC for seemingly minor reasons.
If you are well connected, your LOC is secure. Why does it matter?
That’s interesting. Isn’t there a legally binding contract?
I invest in small- and micro-caps. Availability of credit is critical especially in these times. Analysis of the whole capital structure is part of my due diligence.
Even at a macro level, some analysts are expecting banks to post credit losses worth $108B over the next few quarters. I was just curious of the steps (e.g. not honoring the LoCs in doubtful cases) banks could take to avoid extension of those losses.
Sanjay,
Yes, contracts are legally binding but the creditor has an upper hand. Try getting a simple loan from the bank, as I write this, and see what happens. Just try (we just did and it was a major nightmare).
D.V., thanks! That’s precisely what I was looking for.
I haven’t found a clear explanation of this either. We all know that the Fed provided liquidity is flowing into the assets. The Fed buys treasury, municipal or corporate bonds from the banks, and the banks have more liquid cash on their balance sheets? What happens from that point on-wards? What exactly is the transmission mechanism?
Thank you.
Here is the what I have found:
The direct impact of this liquidity is mostly overestimated. This does not directly flow into equity or credit markets. There may be 2nd order effects because of lower interest rates and the psychological impacts of the Fed’s action (“whatever-it-takes” promise).
The investor perception of risk may get lower as they know the Fed is behind them.
Lately, there has been a ton of corporate debt issuance which also strengthens the balance sheets and reduces the risk of bankruptcy. It may be supportive of stock prices.
Great question. That’s always been on my mind too and never found a satisfactory answer other than secondary effects. Would also love to learn more about this from ones who know about its inner workings.
My own take of this is written below:
I’d imagine lower rates increases PE because of lower risk free rate, promotes leveraged portfolios, drive investors into riskier assets since lower risk assets are more tied to lower fed funds rate, lower credit card rates and car loans, easier bank lending criteria, etc. Lower mortgage isn’t tied to fed funds rate but somehow it often follows general direction of fed funds rate either because of common cause and effects (long term weak economic growth and disinflation) or some other indirect mechanism I described previously like the general push into riskier assets.
Every thing you wanted to know about financial conditions and and the Fed’s response:
https://www.federalreserve.gov/publications/files/financial-stability-report-20200515.pdf
Very readable.
Berkshire/Buffet sold their Goldman Sachs holding and reduced J.P. Morgan. Very ominous and comes when the banking group is underperforming massively.
Buffett sold airlines, he is hurting on oil, and now banks. That said, banks may be a harbinger of negative interest rates (?).
Watching if gold breaks out of 1750 top. It closed above this top on Friday, but needs to stay here for the next three days. Looking to buy gold miners (not gold), GLD/UGLD.
Indeed. Already down 30-40%, and he’s not one to sell at the bottom.
https://www.marketwatch.com/story/dud-stock-picks-bad-industry-bets-vast-underperformance-its-the-end-of-the-warren-buffett-era-2020-05-14?mod=home-page
Market rules changed, but Mr. Buffet did not changed his rules!
So, I got a haircut (! LOL).
Here is what I learnt;
1. Price is up by 15% (Ouch).
2. The person who cut my hair told me that they made more money staying at home than cutting hair (!). This was referenced by Cam earlier (from Calafia Beach Pundit’s post). So, the new 3 Trillion stimulus being discussed could prolong workers staying at home.
I am left wondering if inflation is in the pipeline. Will need careful tracking of CPI/PPI data.
Wally, Sanjay, is the price of Rhum and Cigars up also? Lol. 😉
D.V., the stores in my ‘hood used to give 10%-20% discount to new online customers. Not any more.
Similarly, another wine store used to have specials (15%-20% off) on Tuesdays. Not any more.
The alcohol consumption has definitely gone up!
Lol. We will let Wally (and others who are into “vices” like Whisky and Cigars chime in.
More seriously though, your point is well taken; discounts are gone! Got it.
All right, forget Whisky and Cigars. I am looking for anecdotal evidence of inflation, if any. Please chime in, based on what you are seeing in the community you live in.
Are you seeing rent rise (or absence of accommodation from landlords where you live/rent)?
Are you real estate sellers sticking to sales prices?
Are you seeing increase in durable goods prices?
Are you seeing increase in insurance, services (plumbing as an example) prices?
Are you seeing home improvement contractors bidding for your business?
Are you multiple bids for your residential construction contracts?
Need to know if inflation or deflation is in the pipeline.
You all know what I found today (15% rise in hair cut prices).
I live in NYC and expect to see many residents flee the city as their leases expire over the coming months. Half the people in my building have already left the city (due to CV). Overall, 40% of residents in rich neighborhoods are in Upstate NY, Hamptons or somewhere else.
As people are now realizing the virus is to stay with us at least until the next fall, they won’t want to take the risk of staying in the city, and catch virus in the Subway. With WFH trend catching on, some large corporations will also start vacating their corporate locations in the Big Apple. I doubt if anyone would want to move in the city (unless they really have to).
Fun part is also gone because of pervasive anxiety and the expected closure of many restaurants, theaters, cinemas, museums, bars, etc.
WeWork is seeking a 30% reduction in rents from their landlords. WeWork clients are also demanding better terms from WeWork. I expect others to do the same.
Both residential and commercial real estate will be deflationary in metropolitan areas. As people flee, the real estate in the rest of the country may get an upward lift.
Overall, the demand has cratered while the supply has more or less remained intact in most industries. It can only be deflationary.
Looking from the medical and health perspective, Georgia opened April 24 and Florida May 4 for their phase 1. What is the experience so far? Both have slightly improved or at worst, stayed same as pre-opening. I think people are more aware of the risks and taking proper precautions. This itself bodes well for the future.
More drug treatments are in trial, vaccine development is on hyper scale, our understanding of the virus is getting better, our survival instincts are in high gear, testing is increasing, positivity rates are declining, hospitals are better equipped and prepared, and we have a seen the worst of the effects of the virus.
Monetary and fiscal stimulus are extraordinary. It does take time for them to fully work through the economy. I believe Congress and the Fed are ready to do more.
We know the data currently is bad but by July we should start to see improving data.
Stock market can easily go down 10-15% but the longer term outlook is less cloudy, in my opinion.
https://www.cnbc.com/2020/05/16/texas-coronavirus-updates-cases-rise-as-state-economy-reopens.html
After new reported cases rose by about 1,000 per day in mid-April, they started to climb in May, reaching a new single-day high of about 1,450 on Thursday. While Texans moved more freely around the state after it allowed stores and restaurants to reopen on May 1 with capacity restrictions, the figures could reflect improving testing capacity.
Ravindra, is this a concern? Texas opened on 1 May, and the cases are up by 45% by now.
Do you think the increase in cases is just because of increased testing?
Is it not a concern?
What is the data from Georgia and Florida?
Is Florida seeing an increase in cases or not? If not, stock market is a buy. Your medical perspective is very much appreciated.
This is the news segment that has the information.
(Sorry – couldn’t get a link to click on)
https://www.firstcoastnews.com/mobile/article/news/local/curve-in-context-heres-what-duval-countys-covid-19-case-curve-looks-like-as-of-may-14/77-1b95c498-6f2c-4cd2-b8fb-62665d3fb257
I have not looked at Texas and is an important state economically.
I am generally more optimistic about our ability to move forward. We have the wherewithal to do so.
I truly appreciate Cam’s work. It keeps me grounded.
Most folks are looking for either an inflationary or a deflationary result for the economy. I favor the latter because of all the resulting bankruptcies and tightening credit.
Gold shouldn’t care with a rise either way. Gold’s rising with inflation is well known; lesser appreciated is gold’s rising with deflation also, because of central bank printing.
Gold rises during inflation.
Gold also rises during deflation. Since year 2000, in the US, deflation has ruled. Gold was 260$ at the bottom circa year 2000, now it is 1750. No inflation in site, at least not yet!
Precious metals in general did badly during deflation and recession but not sure about gold itself. I remember reading that gold is more correlated (negatively) with real rate instead (i.e. interest rate – inflation).
It would be interesting to put a graph of GLD against real interest rates and GDX against real interest rates (I learnt this idea from Cam, Thanks Cam).
Urban Carmel (Tom Kurlak) has shown at some point in history, it is worth holding gold and at other times gold miners (see his website).
As the US prints money, I am unsure if Gold or Gold miners are the place to be.
The US is printing money as though it is going out of style. Hard assets like gold may have some place in a portfolio.
Any insights in this situation may help. So far, GDX (gold miners) have outperformed GLD (gold), in the near term.
Gold stocks have begun to outperform gold recently. The stocks lagged behind the bullion for the previous 15 years or so because of very poor capital allocation of the old management. The managers of Barrick Gold and others were more interested in expanding their empires (M&A, exploration) and less so in returning capital to shareholders. Over the last few years, we have new shareholder-friendly management teams at the largest miners. Hopefully, the shares will continue to outperform the bullion.
I’ll watch the capex and M&A.
https://www.cdc.gov/coronavirus/2019-ncov/cases-updates/cases-in-us.html
The testing per day is now close to 300k. Number of new cases are declining. Positivity rate is declining. Not out of the woods yet.