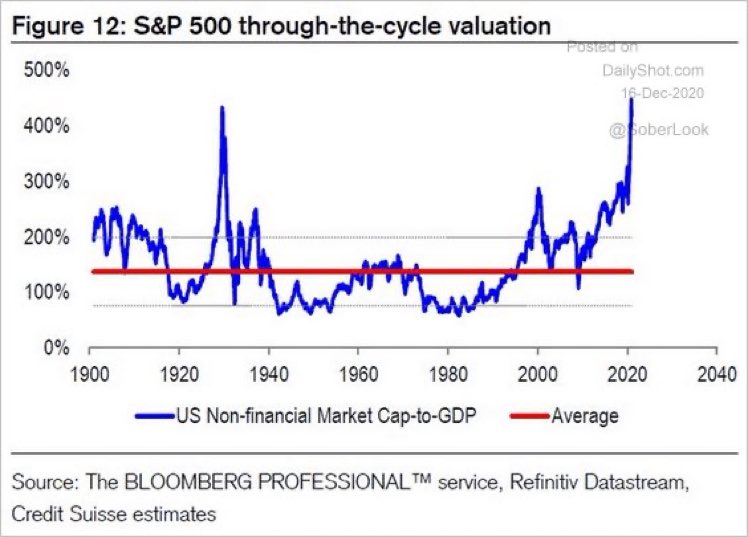
There has been some recent hand wringing over Warren Buffett’s so-called favorite indicator, the market cap to GDP ratio. This ratio has rocketed to new all-time highs, indicating nosebleed valuation conditions for the stock market.
Worries about this ratio are overblown. Here’s why.
Dissecting market cap to GDP
Let’s begin by dissecting the market cap to GDP ratio, which is really an aggregated price to sales ratio for all listed companies. While the price to sales ratio is a useful metric for valuation, a more commonly used ratio is the price to earnings (P/E) ratio. The P/E ratio is really price/(sales x net margin).
To understand the market cap to GDP and P/E ratios, we need to decompose net earnings and how it have evolved over time:
Net earnings = (Gross earnings [or EBIT earnings] – interest expense) x (1 – tax rate)
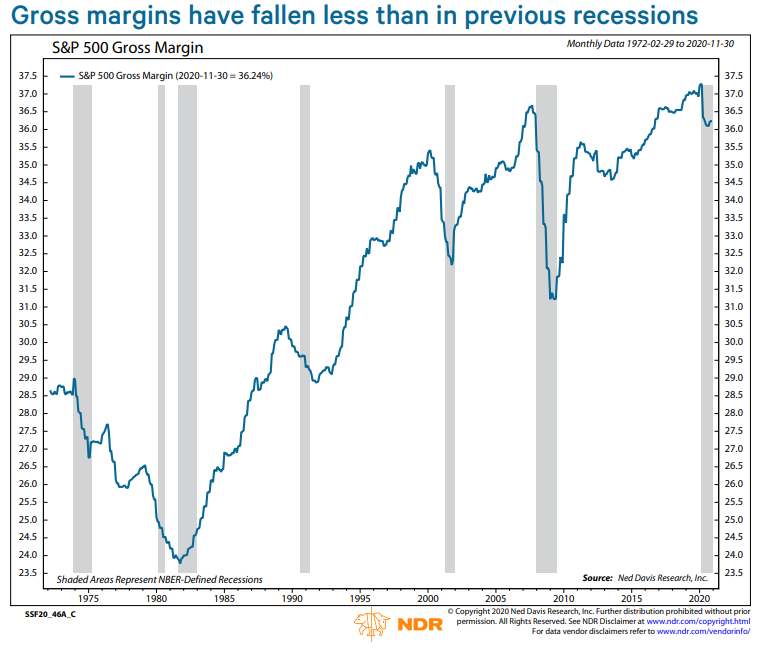
Over the years, both interest rates and the corporate tax rate have fallen substantially. In addition, Ed Clissold of Ned Davis Research documented how gross margins have risen since the early 80’s.
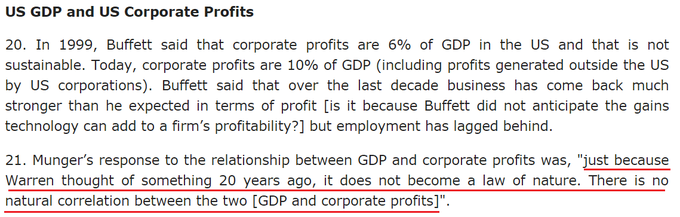
The validity of the Buffett Indicator’s valuation warning therefore depends on a mean reversion in net margins. Ben Carlson documented how Charlie Munger, Buffett’s long-term partner, addressed this issue.
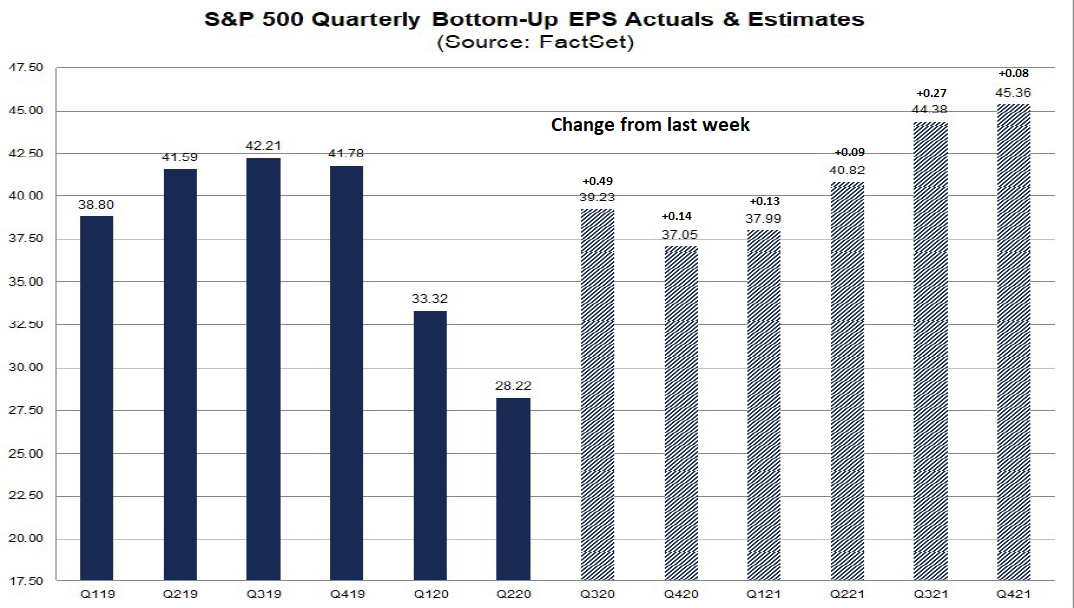
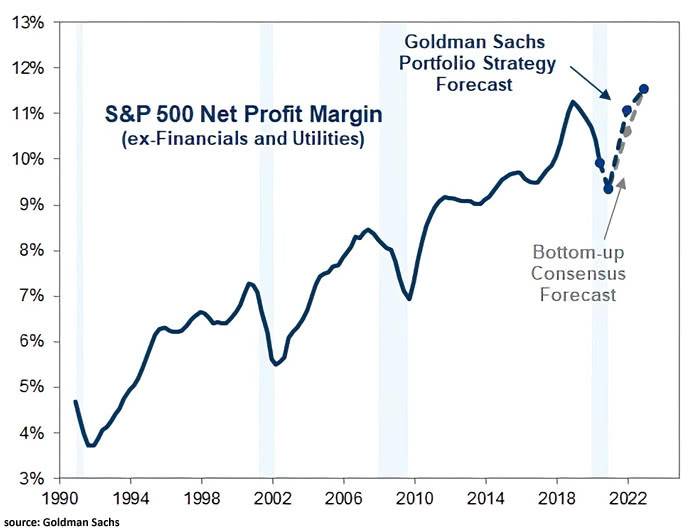
As the economy recovers from the latest recessionary downturn, net margins are expected to rise substantially, which will provide a boost to the E in the P/E ratio.
Do you feel better now?
Not out of the woods?
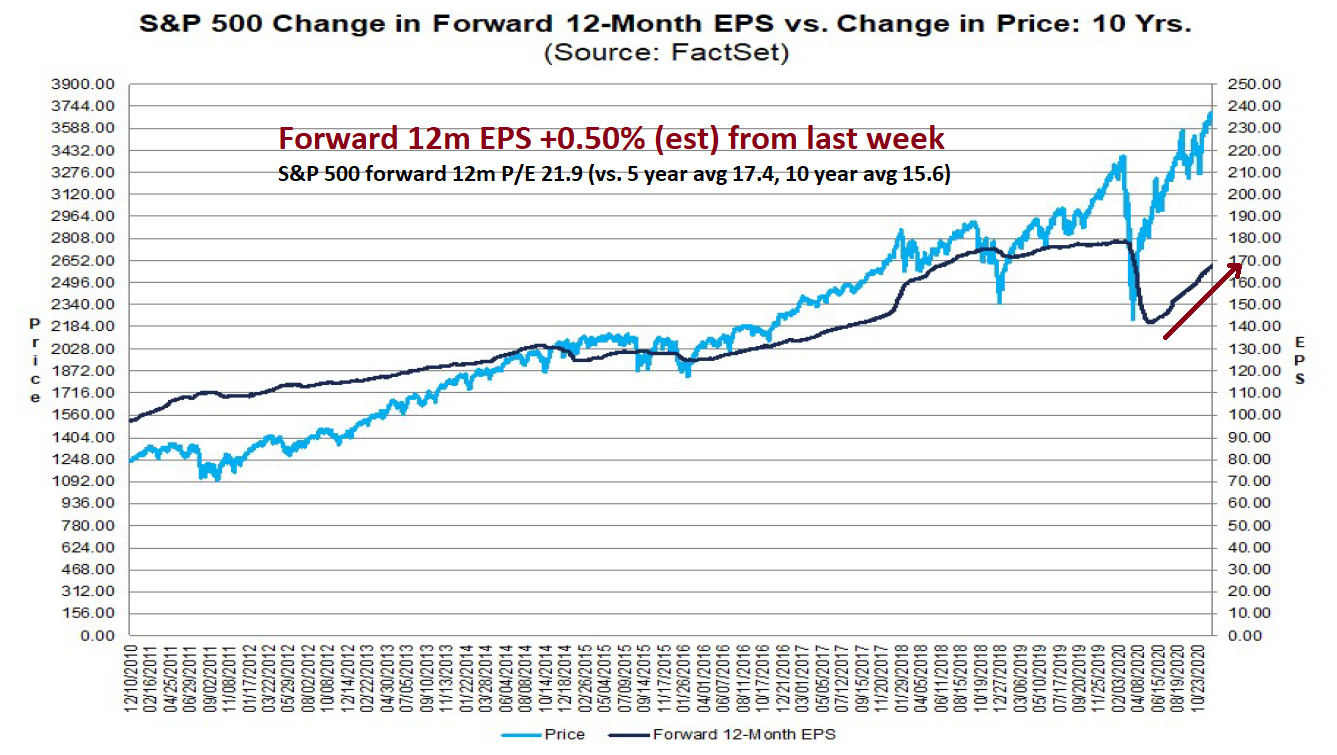
While an explanation of the relationship between the market cap to GDP ratio, net margins, and the P/E ratio provide some comfort about valuation, a nagging problem remains. P/Es are substantially elevated relative to history. The S&P 500 forward P/E ratio of 22.1 is well ahead its 5-year average of 17.4 and 10-year average of 15.7.

Shiller CAPE (Cyclically Adjusted P/E) readings are above levels seen just before the Crash of 1929.

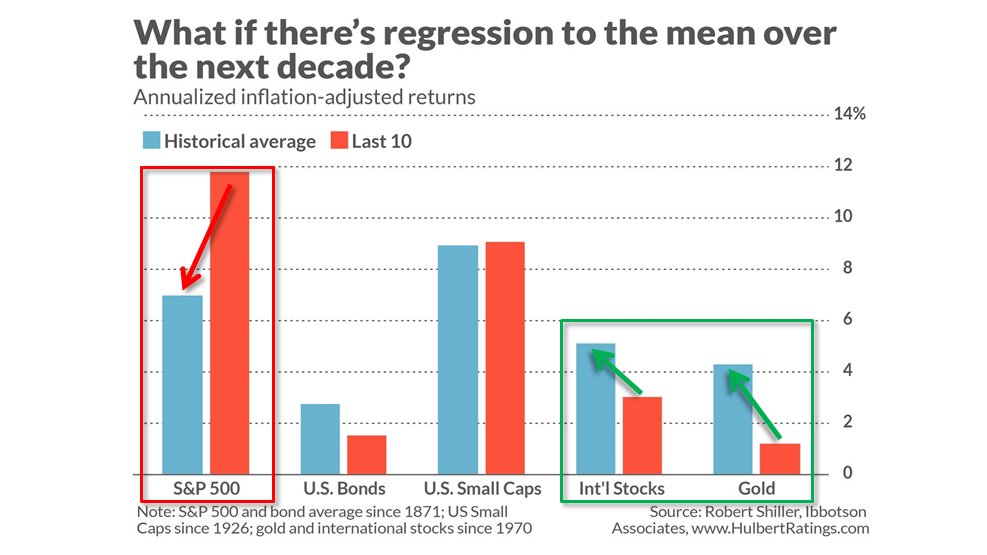
A CAPE of 33 implies roughly 0% real returns over the next decade.

Robert Shiller recently addressed this issue in a Project Syndicate essay. Stock prices are cheap in most regions after adjusting for interest rates.
The level of interest rates is an increasingly important element to consider when valuing equities. To capture these effects and compare investments in stocks versus bonds, we developed the ECY, which considers both equity valuation and interest-rate levels. To calculate the ECY, we simply invert the CAPE ratio to get a yield and then subtract the ten-year real interest rate.
This measure is somewhat like the equity market premium and is a useful way to consider the interplay of long-term valuations and interest rates. A higher measure indicates that equities are more attractive. The ECY in the US, for example, is 4%, derived from a CAPE yield of 3% and then subtracting a ten-year real interest rate of -1.0% (adjusted using the preceding ten years’ average inflation rate of 2%).
We looked back in time for our five world regions – up to 40 years, where the data would allow – and found some striking results. The ECY is close to its highs across all regions and is at all-time highs for both the UK and Japan. The ECY for the UK is almost 10%, and around 6% for Europe and Japan. Our data for China do not go back as far, though China’s ECY is somewhat elevated, at about 5%. This indicates that, worldwide, equities are highly attractive relative to bonds right now.
At the press conference after the December FOMC meeting, Fed Chair Jerome Powell embraced the equity risk premium, or the Fed Model, as a way of valuing the stock market. For what it’s worth, the Fed Model has liked the market since 2002.

Similarly, the Buffett Indicator (inverted) does not appear expensive when investors factor in the level of interest rates, notwithstanding the improvement in net margins.

In summary, concerns about valuation are overblown. Stock prices are not overvalued in light of the low rate environment.
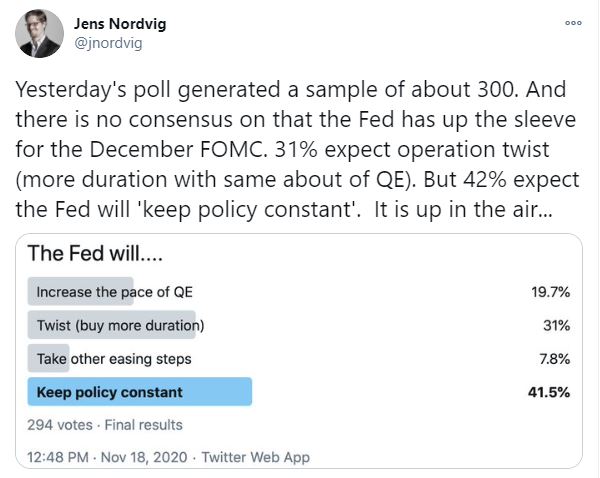
While low rates can be a risk factor over the long-term, they are not a problem over the next few years. The Fed signaled a form of passive easing after the latest FOMC meeting. It raised its growth projections for each of the next two years, marked down unemployment, and raised core inflation estimates. Despite all that, it is holding rates steady. That’s a medium-term friendly environment for equities.

Don’t be afraid to buy.