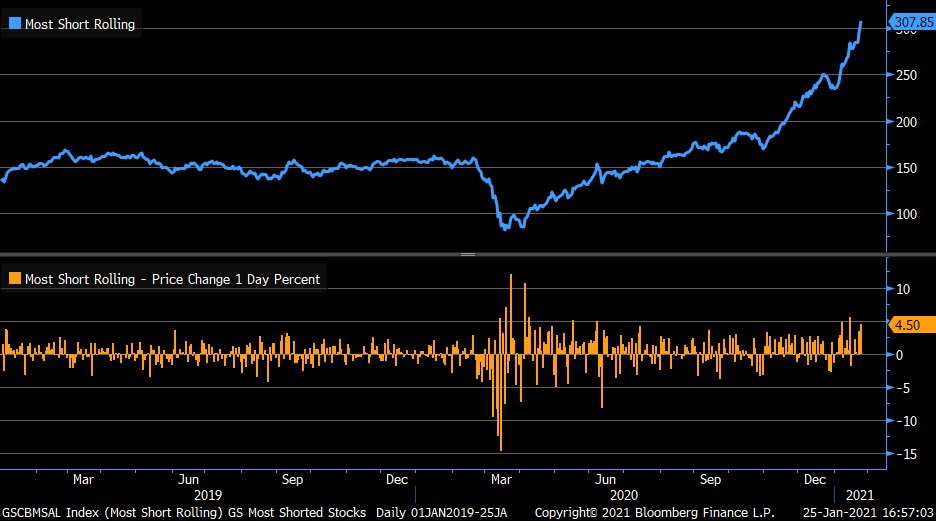
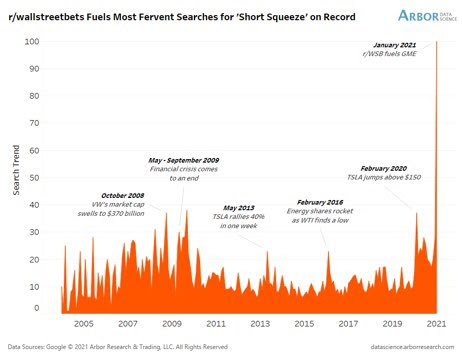
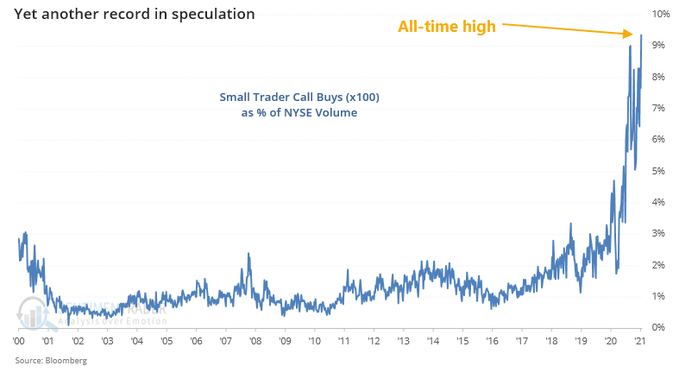
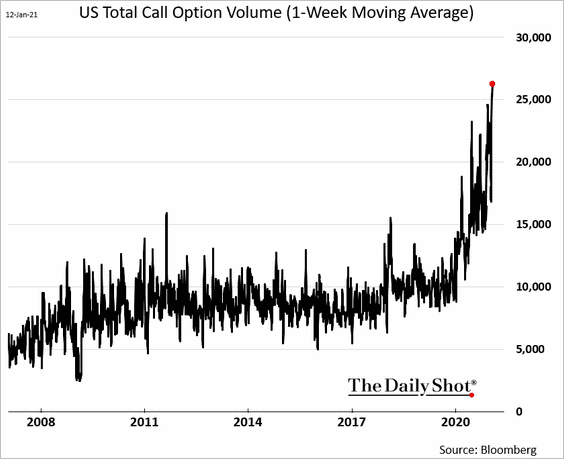
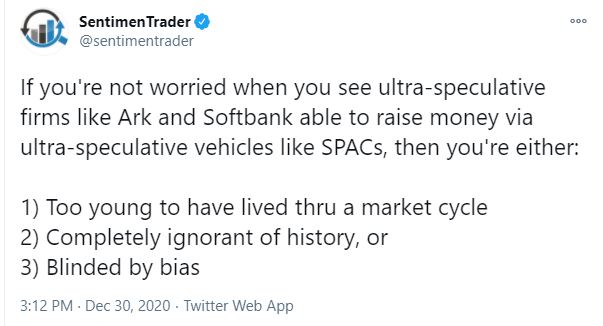
Now that virtually everybody has bought into the reflation and global cyclical recovery trade, and Reddit flash mobs are ganging up on short sellers to drive the most short-sold stocks into the stratosphere, what could go wrong with this bull?
Notwithstanding the silliness of the WSB flash mobs, here are some key bearish risks to consider.
- The rise of bond vigilantes
- Continuation of the trade wars
- Health policy stumbles
Partying with abandon
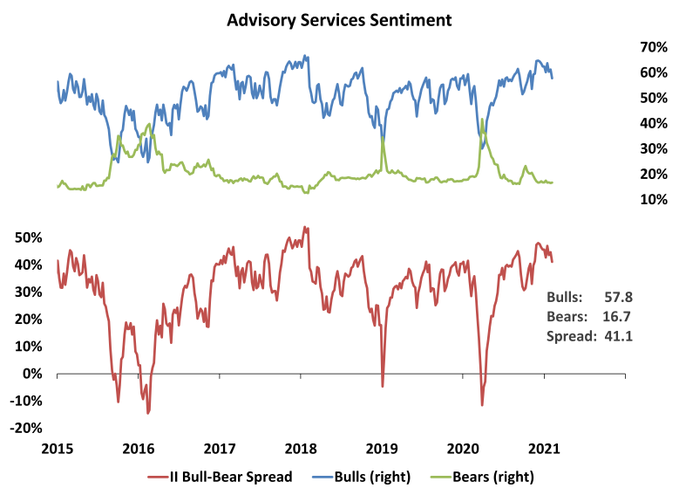
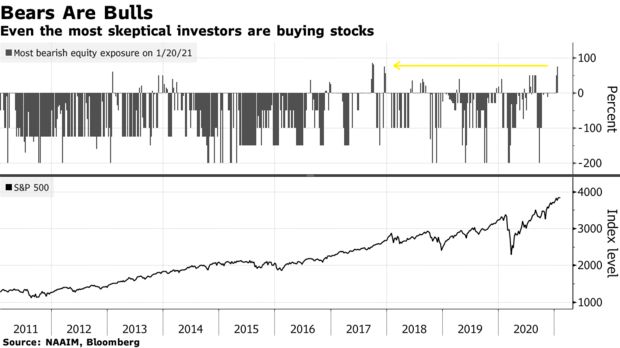
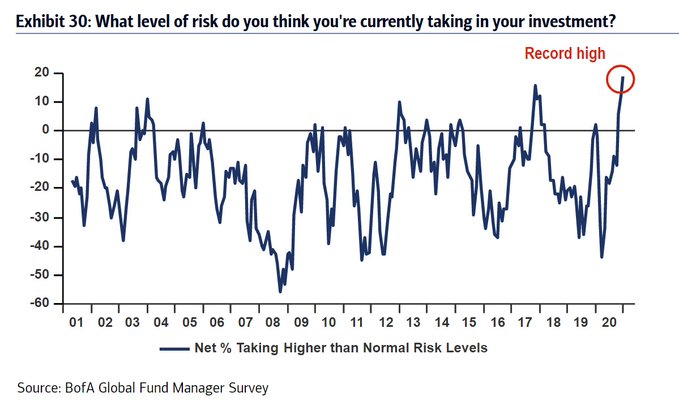
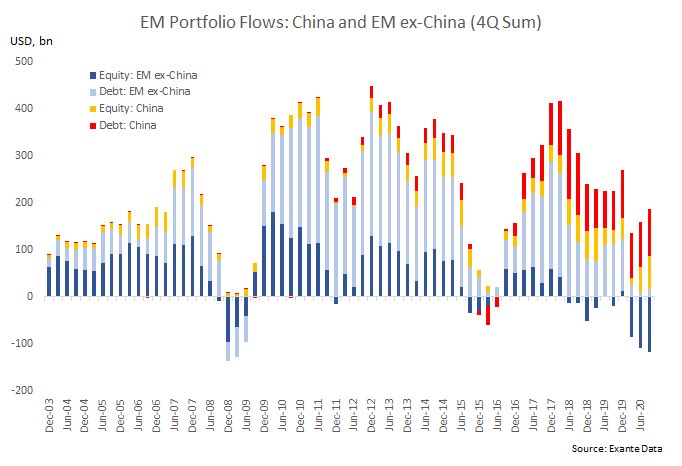
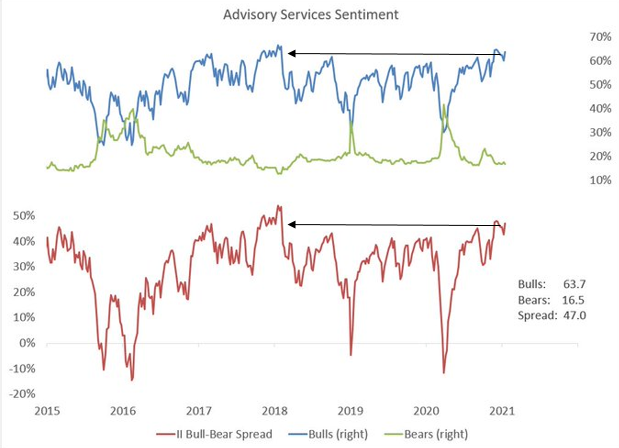
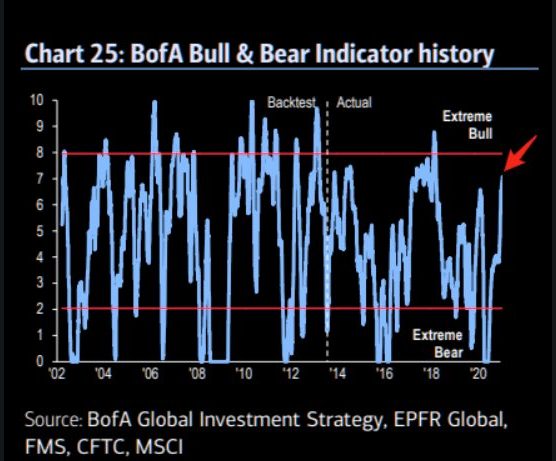
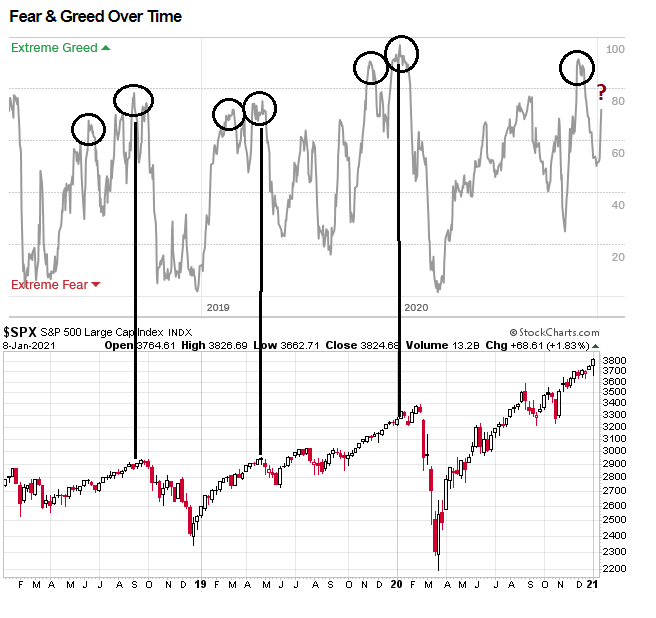
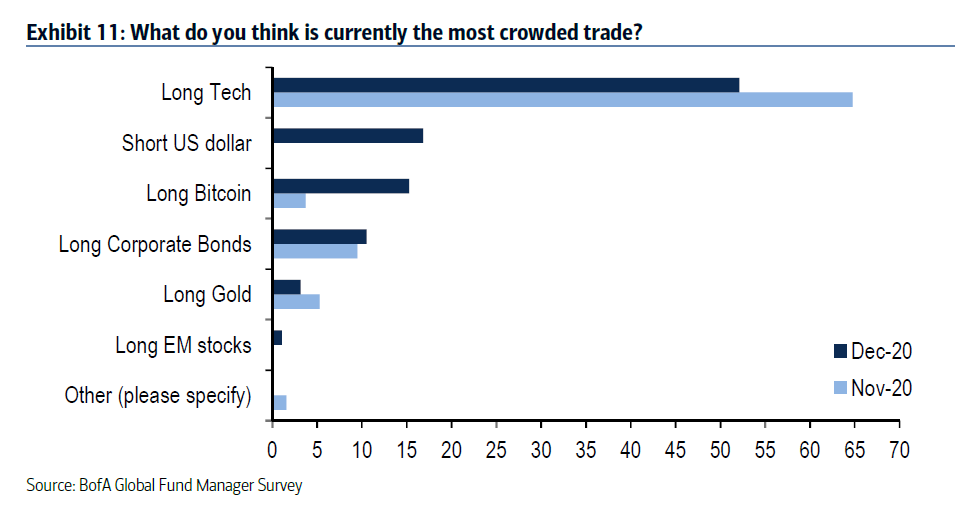
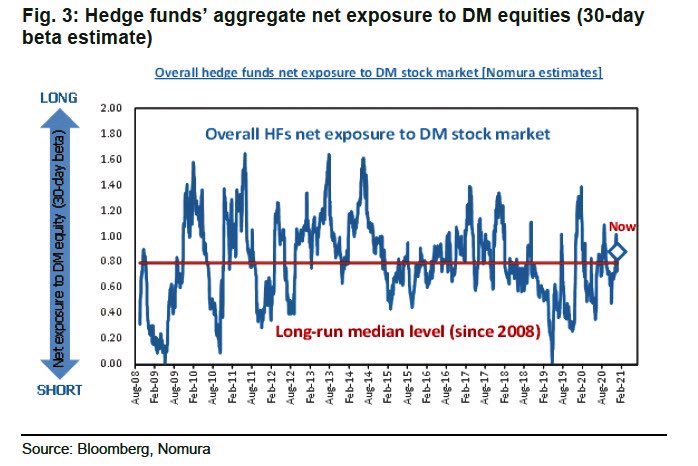
Most of the investor surveys have been off-the-charts bullish for weeks. From most indications, retail and fast-money hedge funds are all-in on equities. Today, data is emerging that the slow-moving institutions are also fast becoming long risk.
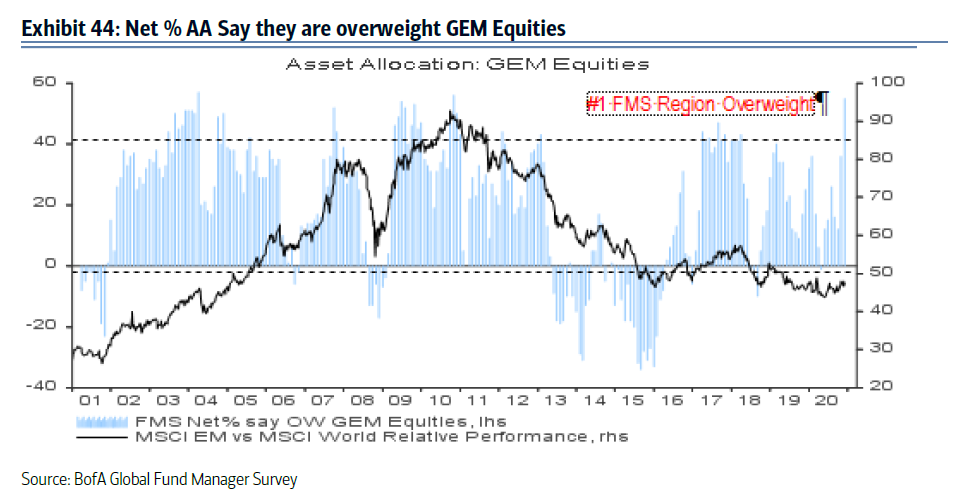
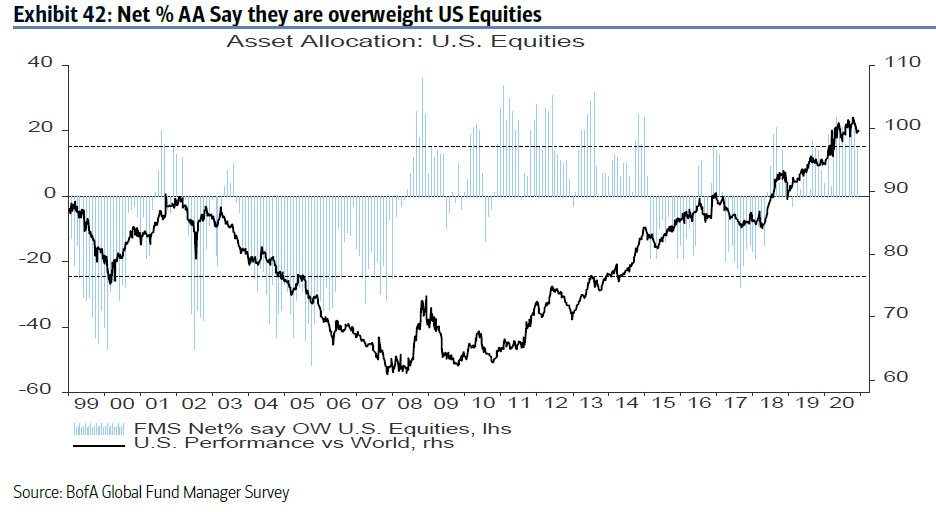
The BoA Fund Manager Survey shows global manager risk positioning is at a record high.
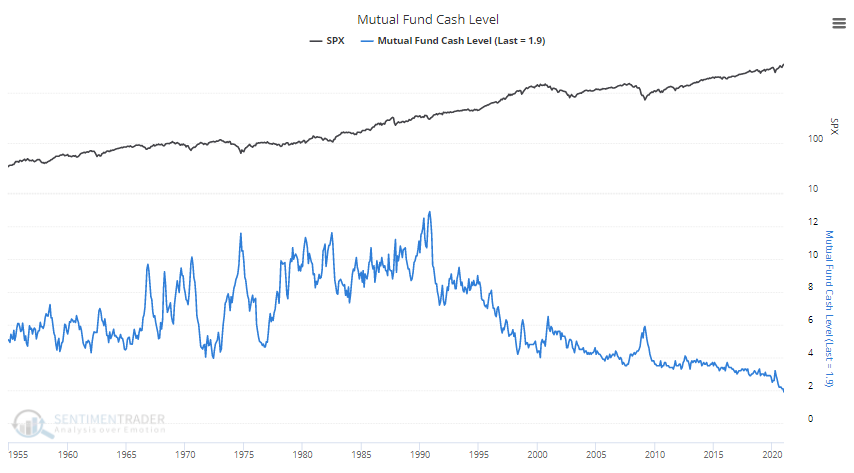
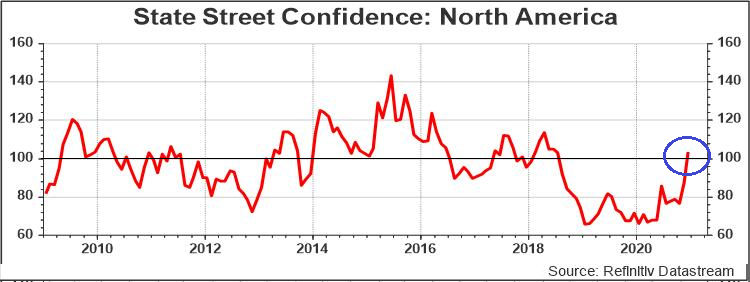
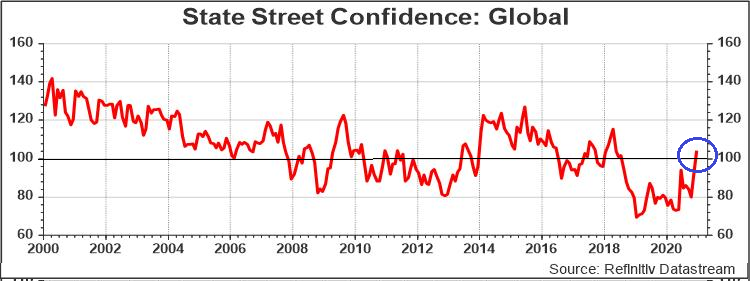
While investor surveys only ask about attitude, which can change quickly, a more reliable source of sentiment comes from either the market, such as option pricing of risk appetite, or surveys of holdings from custodians and hedge fund prime brokers. The latest monthly survey of State Street Confidence, which aggregates institutional client holdings, shows a surge in North American equity risk appetite. In all likelihood, the next data point will see a further increase in risk positioning.
The survey of global positioning tells a similar story of rising risk appetite.
What could possibly go wrong?
The rise of bond vigilantes
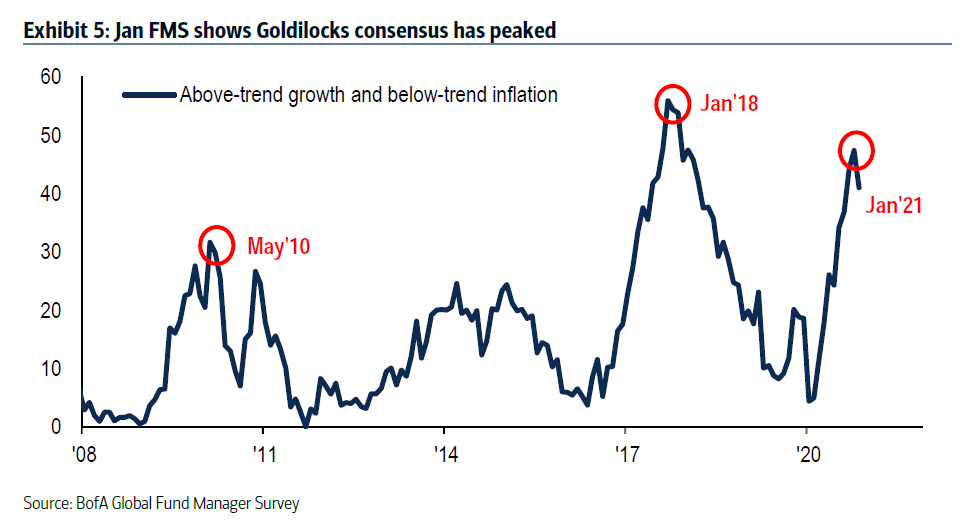
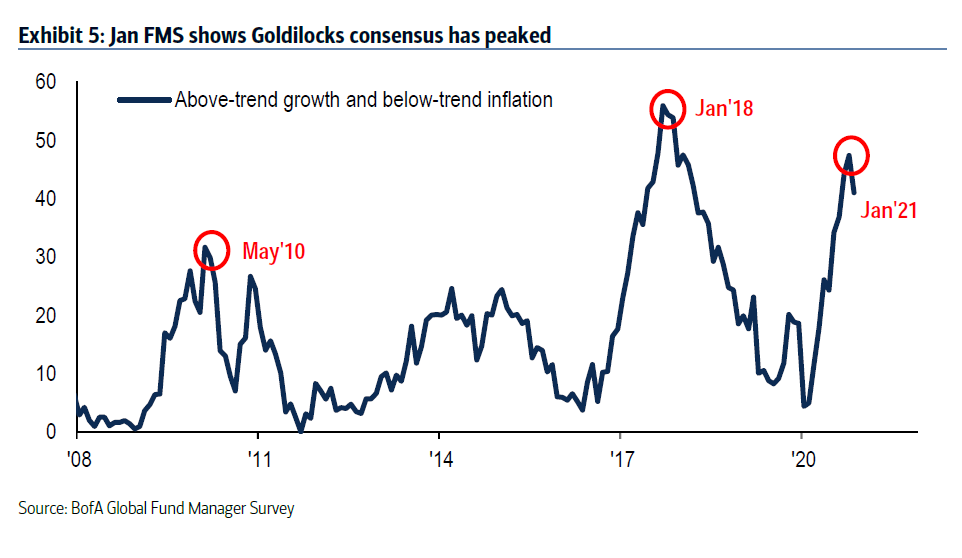
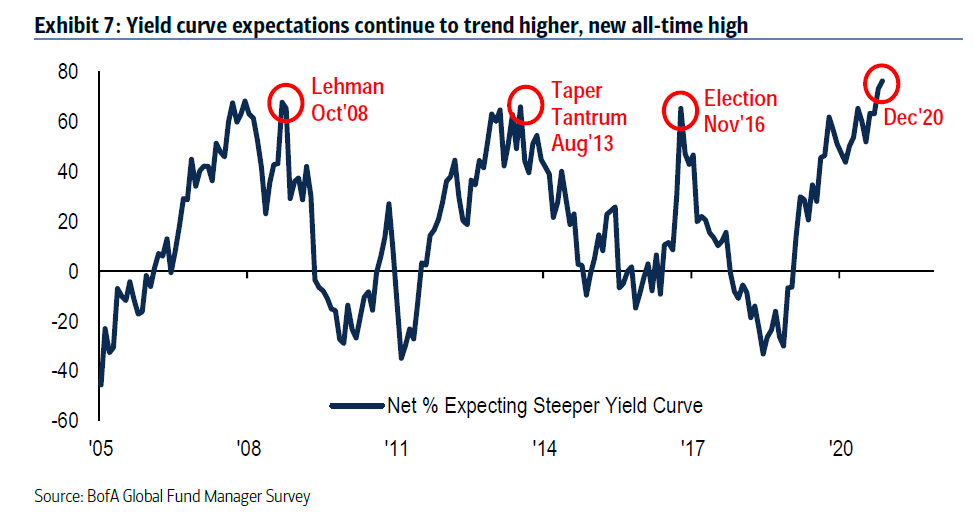
A key macro risk facing equity investors is the rise of the bond vigilantes. The BoA Fund Manager Survey shows that expectations of a Goldilocks scenario of above-trend growth and below-trend inflation have peaked.
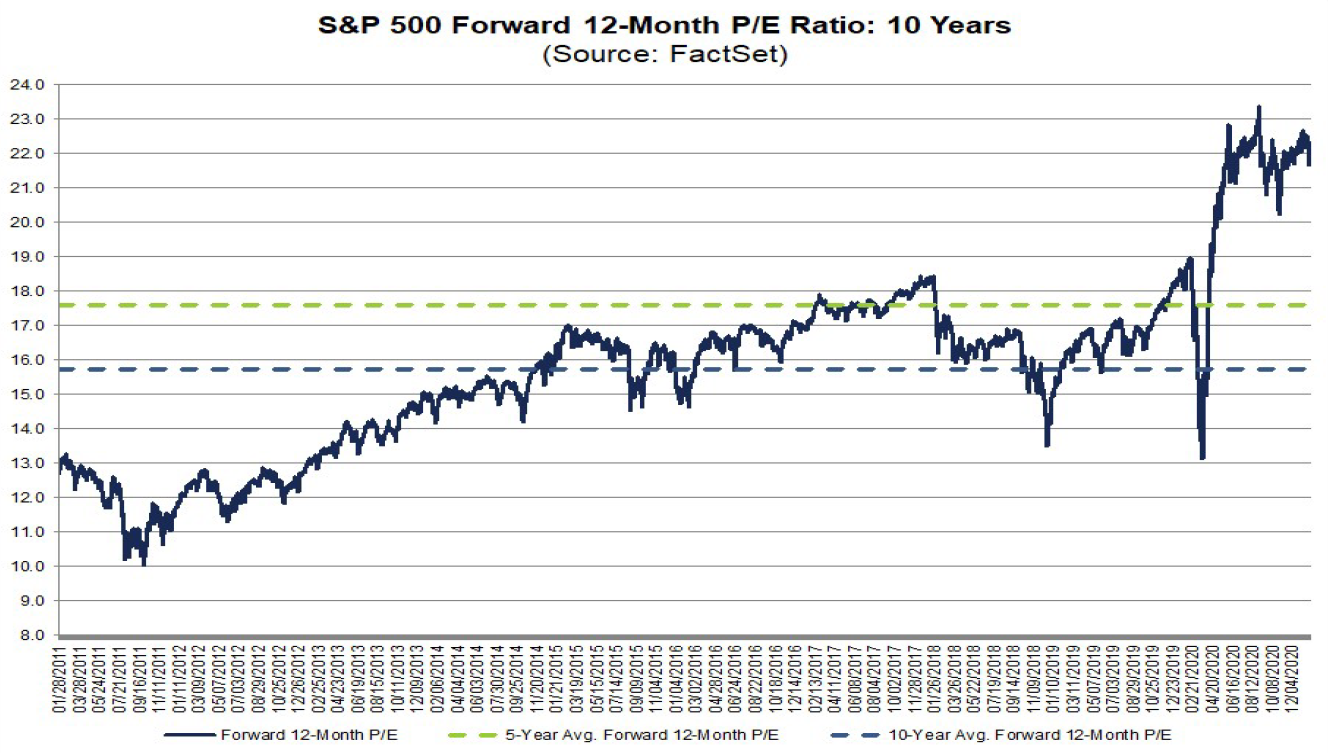
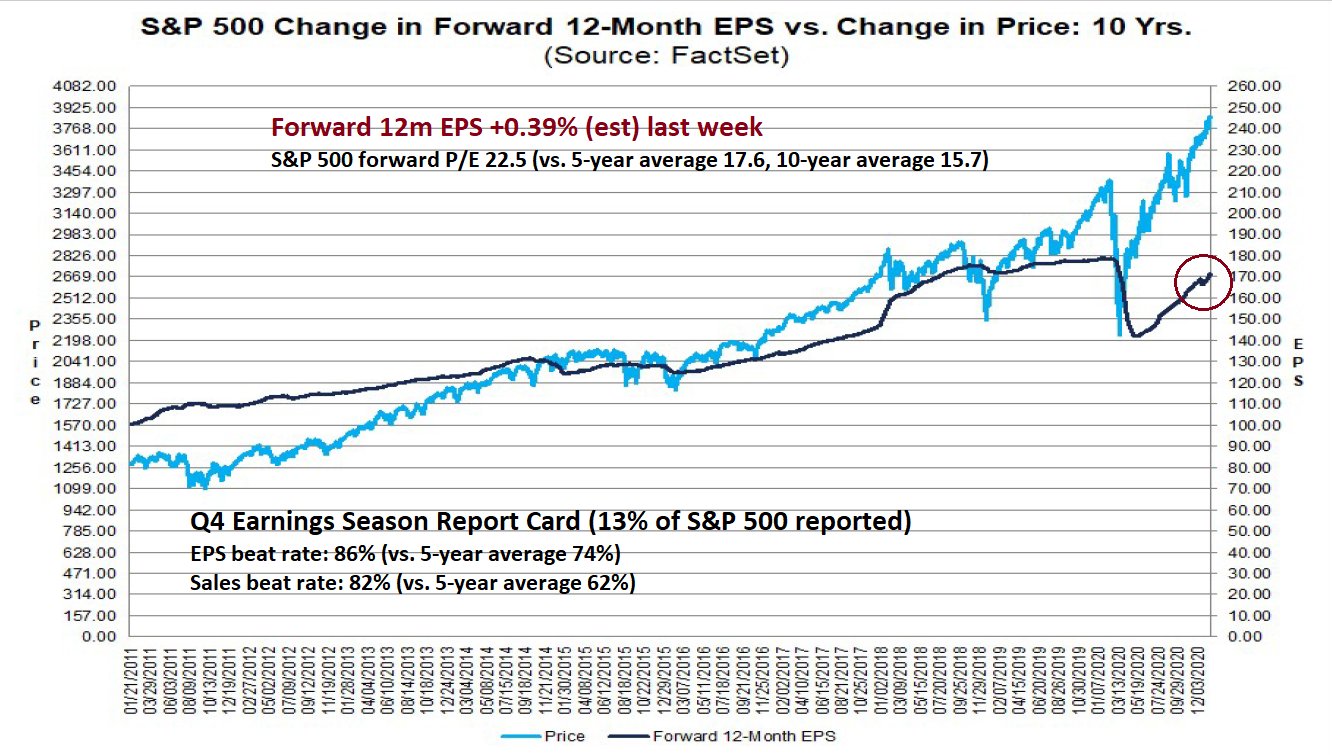
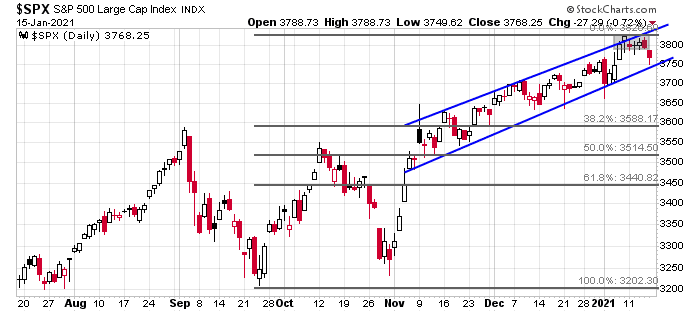
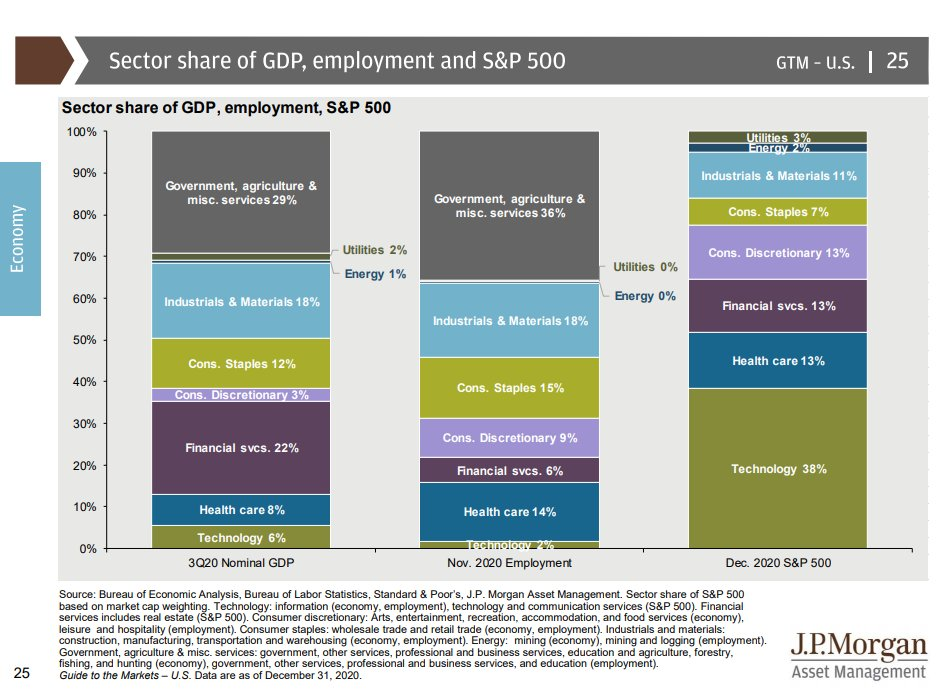
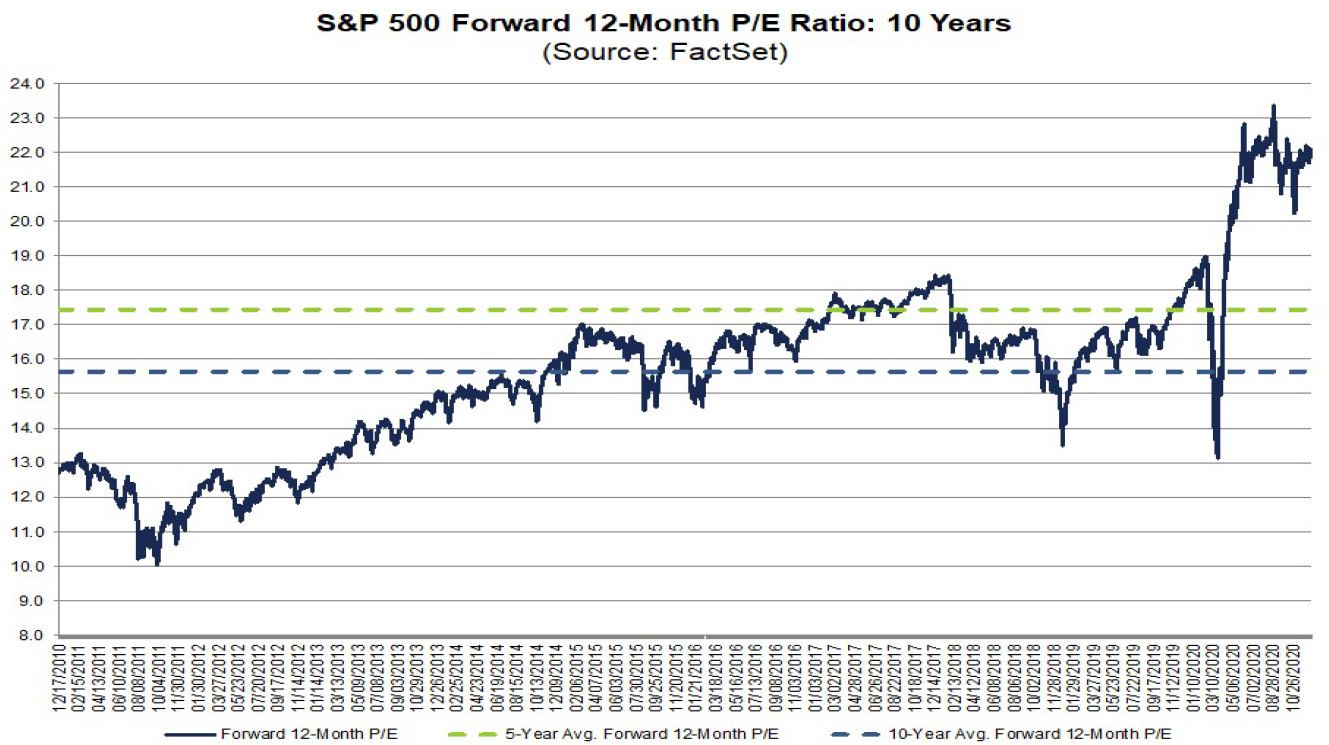
The S&P 500 is trading at a forward P/E ratio of 21.8, which is well above its 5 and 10-year averages.
While the stock market appears expensive on most multiple-based valuation techniques, such as P/E, P/CF, EV/EBITDA, and P/B, they can be justified in view of the low extremes in bond yields. If we were to calculate the equity risk premium, defined as 10-year CAPE minus the 10-year bond yield, equity prices appear more reasonable, though the US (red line) is less attractive than other major developed markets.
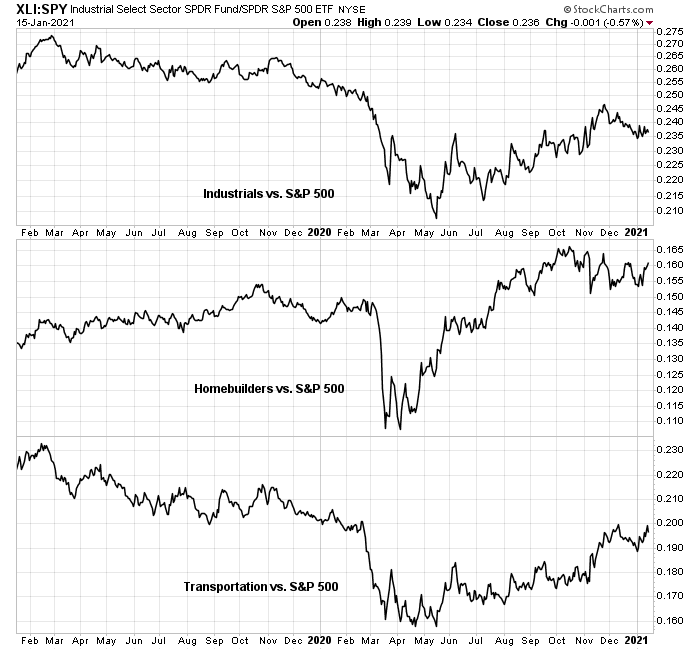
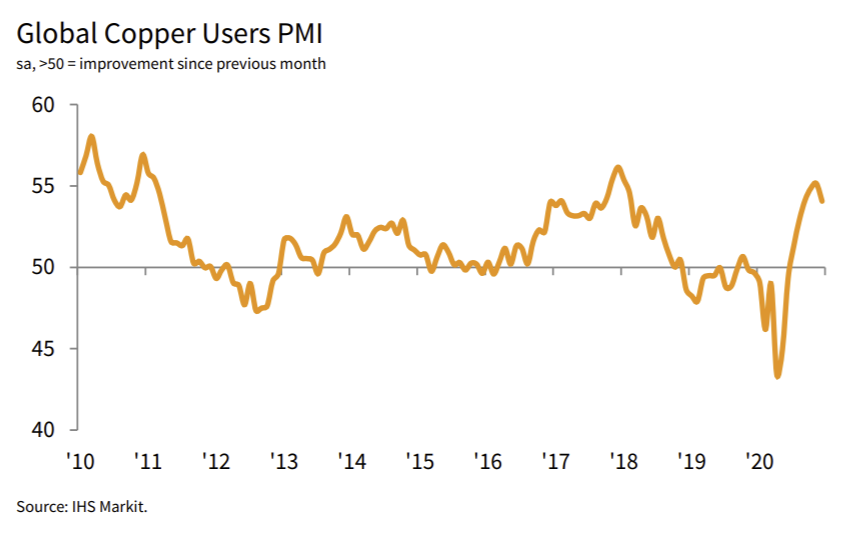
What if rates were to rise? The 10-year Treasury yield bottomed last August at 0.5% and it has risen to above 1% today. Arguably, the rise in the copper/gold ratio, which is a sensitive global cyclical indicator, calls for a 10-year yield in the 1.5-2.0% range.
Where are the bond vigilantes?
A question of fiscal room
Now that Janet Yellen has been confirmed as the Treasury Secretary, she is expected to work closely with Jerome Powell to coordinate fiscal and monetary policy to dig the economy out of the recession. The key quotes from Powell in the post-FOMC press conference were, “We’re focused on finishing the job” and “frankly we’d welcome some inflation”. Fed watcher
Tim Duy summed up Powell’s views this way:
Powell is trying to do two things. First, recognize the improving economic outlook. Second, make clear that this improvement has not yet impacted the Fed’s expected policy path. The new strategy is very clear that forecasts alone are not sufficient to justify reducing policy accommodation. Forecast-based inflation fears failed the Fed in the last recovery and they expect the same would happen now. As a result, the focus is squarely on results. Considerable progress toward goals needs to be made before tapering. Sustained inflation needs to occur before raising interest rates. The Fed will continue to pound on this message. Also, Powell is not impressed with anyone’s concerns about asset bubbles. It’s all about inflation and jobs.
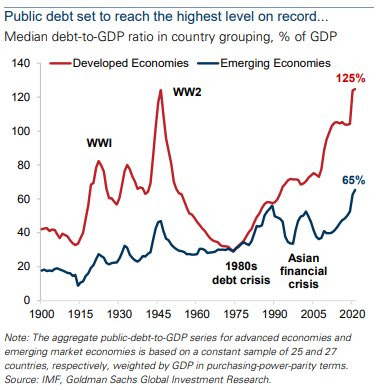
Undoubtedly, that will mean more fiscal stimulus coupled with a very loose monetary policy. The resulting deficits and increases in government debt could be gargantuan.
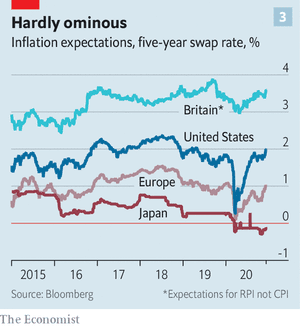
Inflation expectations are already rising. The 10-year breakeven rate (blue line) is above the Fed’s 2% inflation target, and the 10-year Treasury yield (red line) has historically traded at or above the breakeven rate. What happens if the 10-year yield were to rise towards 2%? Won’t that put pressure on the equity risk premium and therefore stock prices?
The answer to that question is a Keynesian beauty contest, where judges are rewarded for selecting the most popular faces among all judges, rather than those they may personally find the most attractive.
From a policy perspective, there has been a flood of academic papers supportive of greater fiscal spending. The degree of fiscal capacity is higher than expected under standard assumptions.
A
2015 paper by Josh Ryan-Collins of the Levy Economics Institute, “Is Monetary Financing Inflationary? A Case Study of the Canadian Economy, 1935–75”, concluded that the coordination of fiscal and monetary policy was not inflationary [emphasis added].
We find little empirical evidence to support the standard objection to such policies: that they will lead to uncontrollable inflation. Theoretical models of inflationary monetary financing rest upon inaccurate conceptions of the modern endogenous money creation process. This paper presents a counter-example in the activities of the Bank of Canada during the period 1935–75, when, working with the government, it engaged in significant direct or indirect monetary financing to support fiscal expansion, economic growth, and industrialization. An institutional case study of the period, complemented by a general-to-specific econometric analysis, finds no support for a relationship between monetary financing and inflation. The findings lend support to recent calls for explicit monetary financing to boost highly indebted economies and a more general rethink of the dominant New Macroeconomic Consensus policy framework that prohibits monetary financing.
A
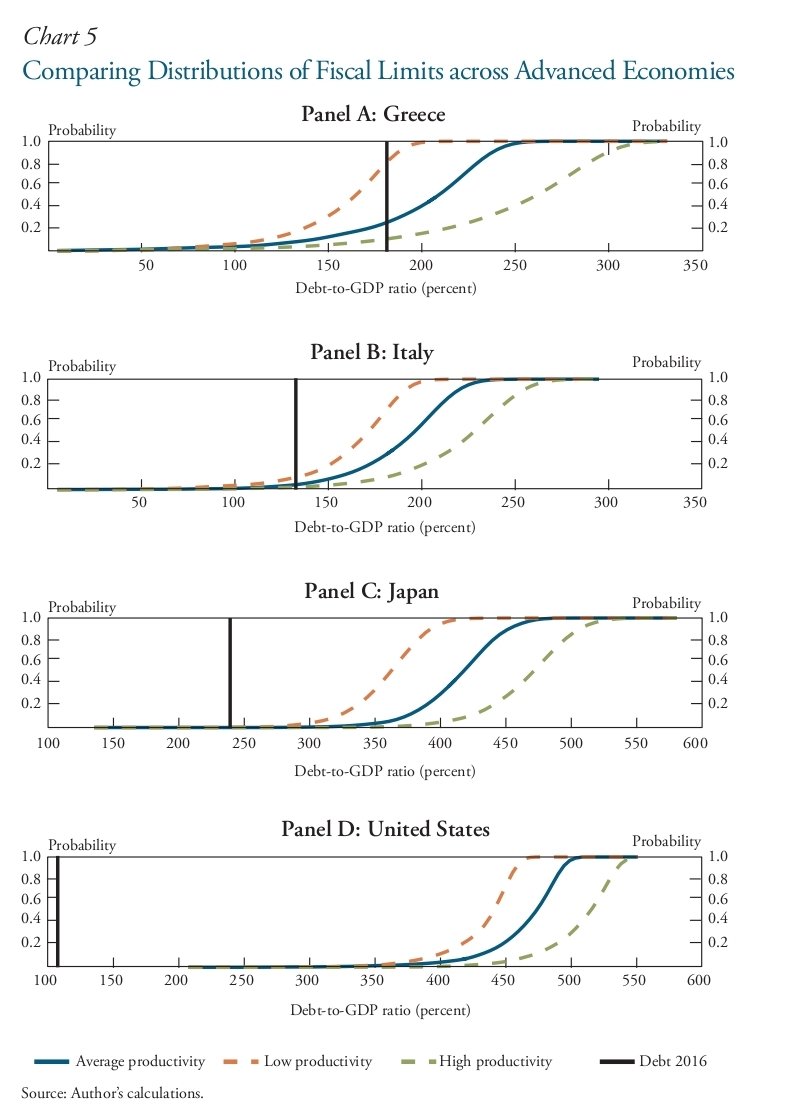
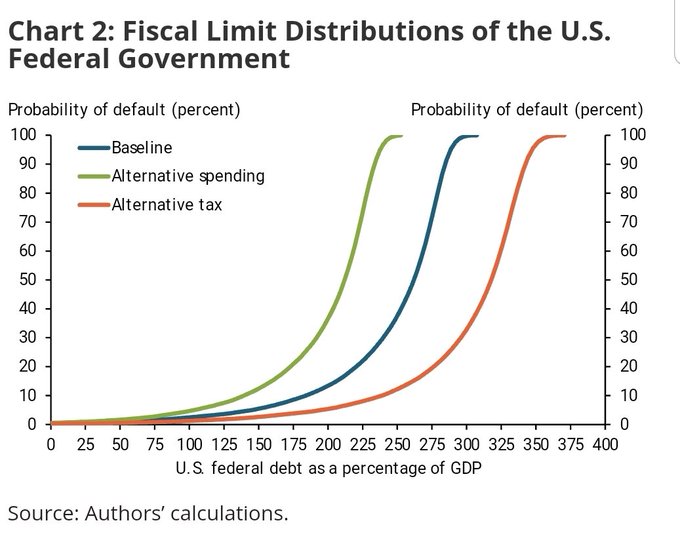
2017 paper by Huixin Bi of the Kansas City Fed, “Fiscal Sustainability: A Cross-Country Analysis”, examined fiscal capacity in the context of not just debt levels, but government transfers, tax rates, productivity, and other factors. It concluded that the US has more fiscal space than Japan, which has a debt-to-GDP level that is highest of all G-7 economies.
One assumption of the study is that policymakers won’t increase taxes relative to GDP past a certain point. Current net US federal debt levels of about 100% of GDP aren’t troubling, but raising taxes significantly could be.
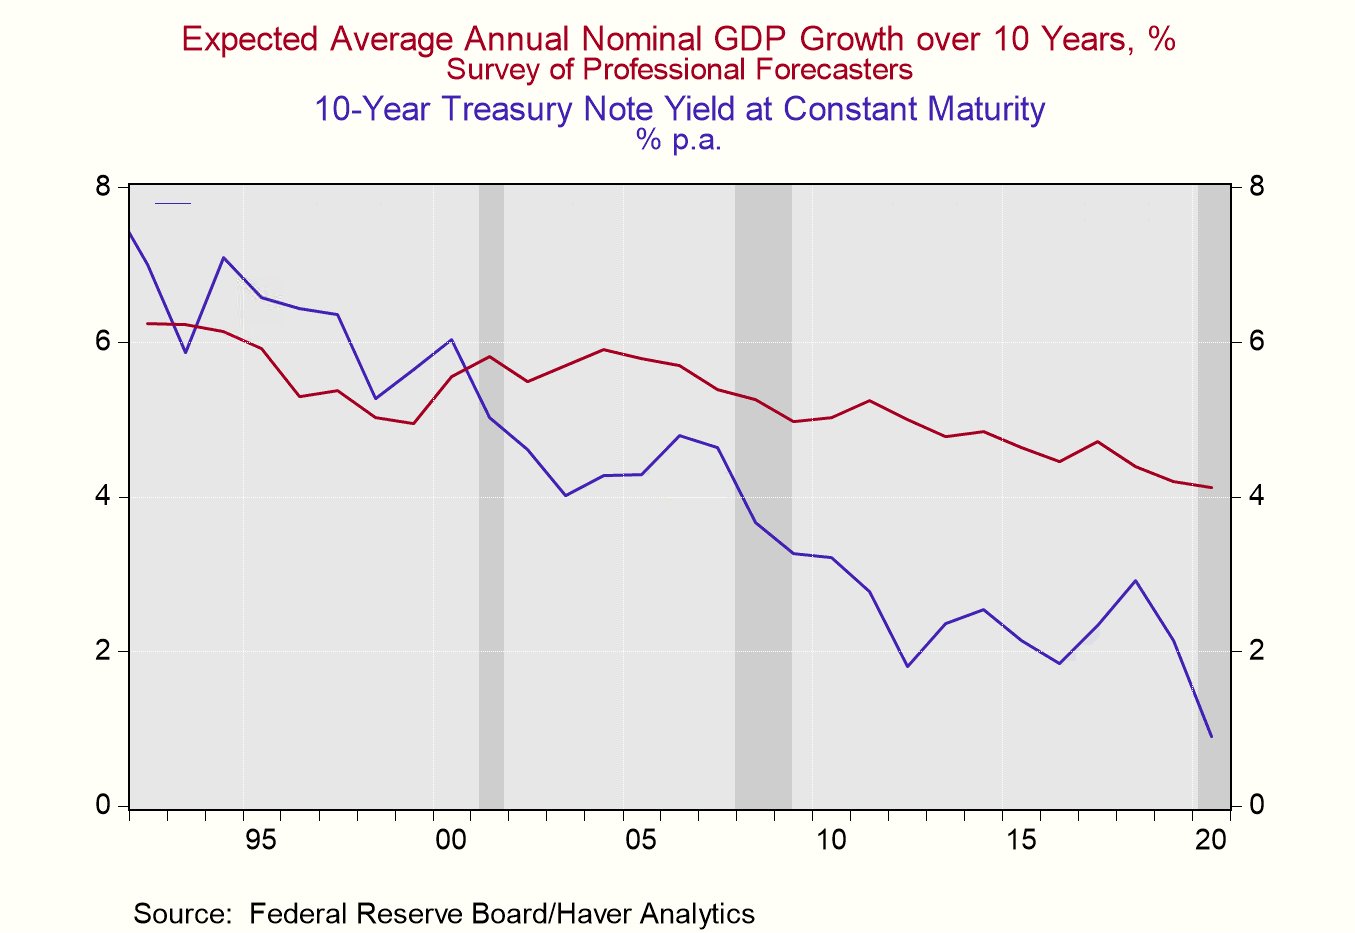
This approach argues for substituting the conventional debt-to-GDP analytical framework for an interest rate vs. nominal growth rate framework.
Whether any of this matters to the bond market is another question. In a Keynesian beauty contest, it’s not your own opinion that matters, but that of the market.
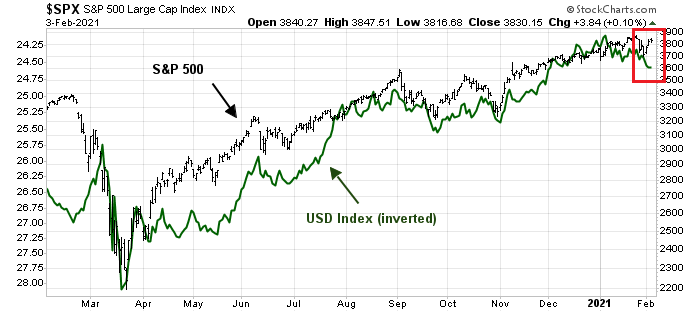
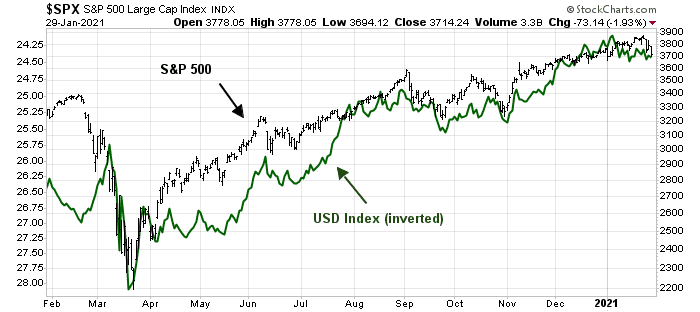
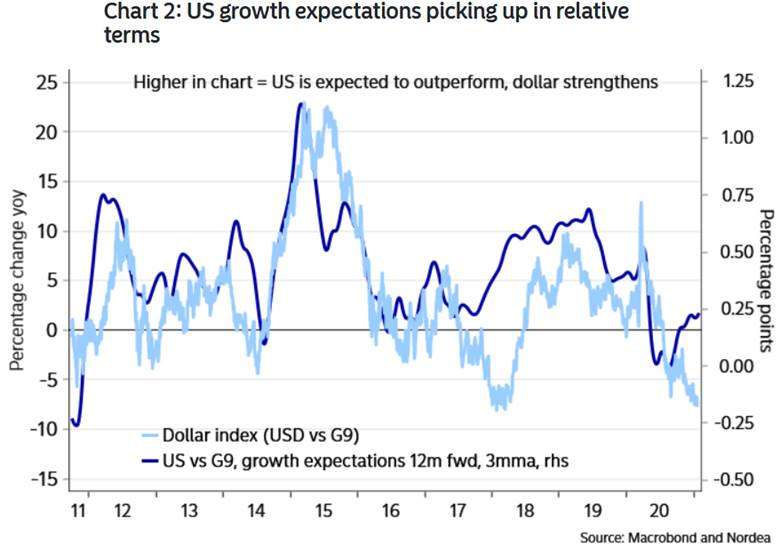
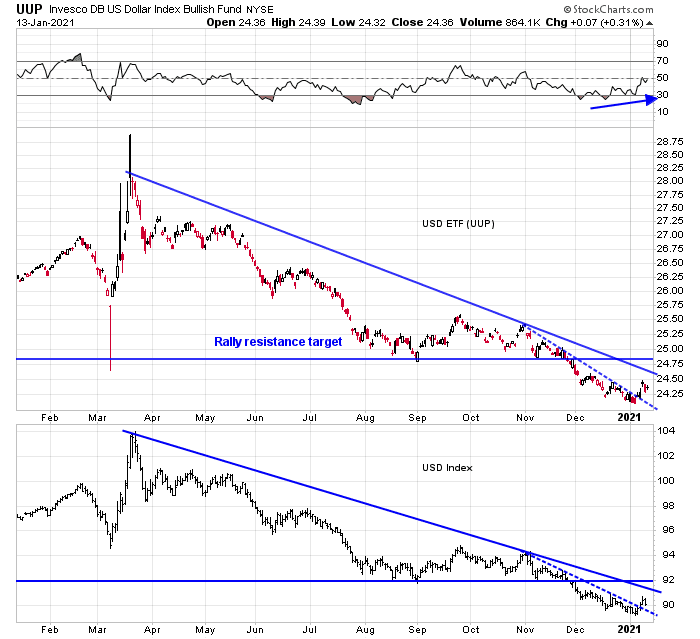
Another risk is the USD and growth differentials. Nordea Markets pointed out that should the US be successful in its stimulus efforts, growth differentials with other major economies are set to rise. This would put upward pressure on the USD, which is contrary to the consensus view of a weak greenback. USD strength would put downward pressure on fragile EM currencies, which could spark a risk-off episode.
The trade war isn’t over
Just when you thought that Trump is out of the White House, his trade wars and protectionist tendencies have receded from government policy. Think again.
Marketwatch reported that Janet Yellen had some harsh words for China.
Janet Yellen, President Joe Biden’s pick to be U.S. Treasury secretary, made some blistering comments about China this week. It was straight talk the likes of which were rarely heard during her tenure as Federal Reserve chairwoman between 2014 and 2018.
Yellen called China “our most strategic competitor’ and that the U.S. would work with its allies on a coordinated response.
“We need to take on China’s abusive, unfair, and illegal practices,” Yellen went on to say.
“China is undercutting American companies by dumping products, erecting trade barriers, and giving illegal subsidies to corporations,” Yellen said.
Reuters reported that Biden Commerce nominee vows to protect U.S. networks from Huawei, ZTE:
President Joe Biden’s nominee to head the U.S. Commerce Department on Tuesday vowed to protect U.S. telecommunications networks from Chinese companies, but she refused to commit to keeping telecommunications giant Huawei Technologies on a U.S. economic blacklist.
“I would use the full toolkit at my disposal to the fullest extent possible to protect Americans and our network from Chinese interference or any kind of back-door influence,” Rhode Island Governor Gina Raimondo said in testimony before the U.S. Senate Commerce Committee, naming Huawei and ZTE Corp. Congress in December approved $1.9 billion to fund the replacement of ZTE and Huawei equipment in U.S. networks.
There is a bipartisan consensus in Washington that China is a clear and present danger on trade. A changing of the guard at the White House will not change that thinking, though the Biden approach is likely to be less confrontational, and seek to gather allies to pressure China to make changes.
The early signals from Biden are the level of protectionism is unlikely to fall significantly. One of Biden’s first executive orders was to require the federal government to “buy American” for products and services. This order upset a lot of trading partners, especially within the NAFTA bloc.
The market hasn’t really reacted to any of this news. Will the prospect of stabilization in protectionist levels spook the markets and risk appetite?
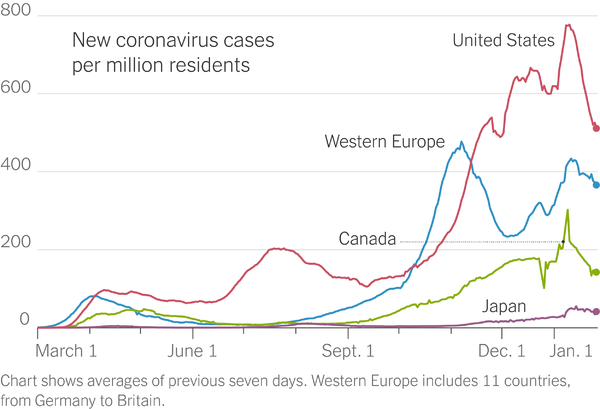
The virus is mutating
Even as investors are partying with abandon, so is the virus. The good news is case counts are starting to fall, but they could rise again if the newly infectious variants cause case numbers to rise again, especially if people become blasé about masks and social distancing. In the EU, vaccine supply is getting low. Spain has reported that “its fridges are empty”. A Hong Kong acquaintance informs me that they are unaware of any plans by the authorities to even roll out a vaccine. This pandemic is a global problem. Until the virus is stamped out everywhere and no pockets of infection remain to leak out and infect others, the global economy will not return to normal.
The New York Times reported that Pfizer and Moderna have scaled back expectations for the effectiveness of their vaccines.
As the coronavirus assumes contagious new forms around the world, two drug makers reported on Monday that their vaccines, while still effective, offer less protection against one variant and began revising plans to turn back an evolving pathogen that has killed more than two million people.
The news from Moderna and Pfizer-BioNTech underscored a realization by scientists that the virus is changing more quickly than once thought, and may well continue to develop in ways that help it elude the vaccines being deployed worldwide.
Moderna conceded that it may have to modify its vaccine to cope with new virus mutations. In addition, patients may have to continue to receive additional booster shots.
Moderna and Pfizer-BioNTech both said their vaccines were effective against new variants of the coronavirus discovered in Britain and South Africa. But they are slightly less protective against the variant in South Africa, which may be more adept at dodging antibodies in the bloodstream.
The vaccines are the only ones authorized for emergency use in the United States.
As a precaution, Moderna has begun developing a new form of its vaccine that could be used as a booster shot against the variant in South Africa. “We’re doing it today to be ahead of the curve, should we need to,” Dr. Tal Zaks, Moderna’s chief medical officer, said in an interview. “I think of it as an insurance policy.”
“I don’t know if we need it, and I hope we don’t,” he added.
Moderna said it also planned to begin testing whether giving patients a third shot of its original vaccine as a booster could help fend off newly emerging forms of the virus.
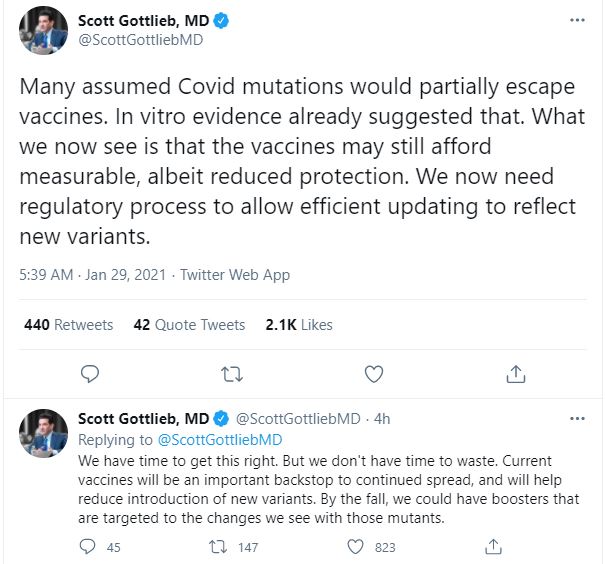
Another good news and bad news story come from the Johnson & Johnson and Novavax vaccine trials. J&J reported that the efficacy of its single-shot vaccine was 72% in the US and 57% in South Africa. Novavax reported its two-shot vaccine had a nearly 90% effectiveness in the UK but fell to 50% in a small South African trial. The South African variant, known as B.1.351, is raising alarm among health officials. This means new variants could cause more reinfections and require updated vaccines. As well, national health authorities need to put into place a “regulatory process to allow efficient updating to reflect new variants”.

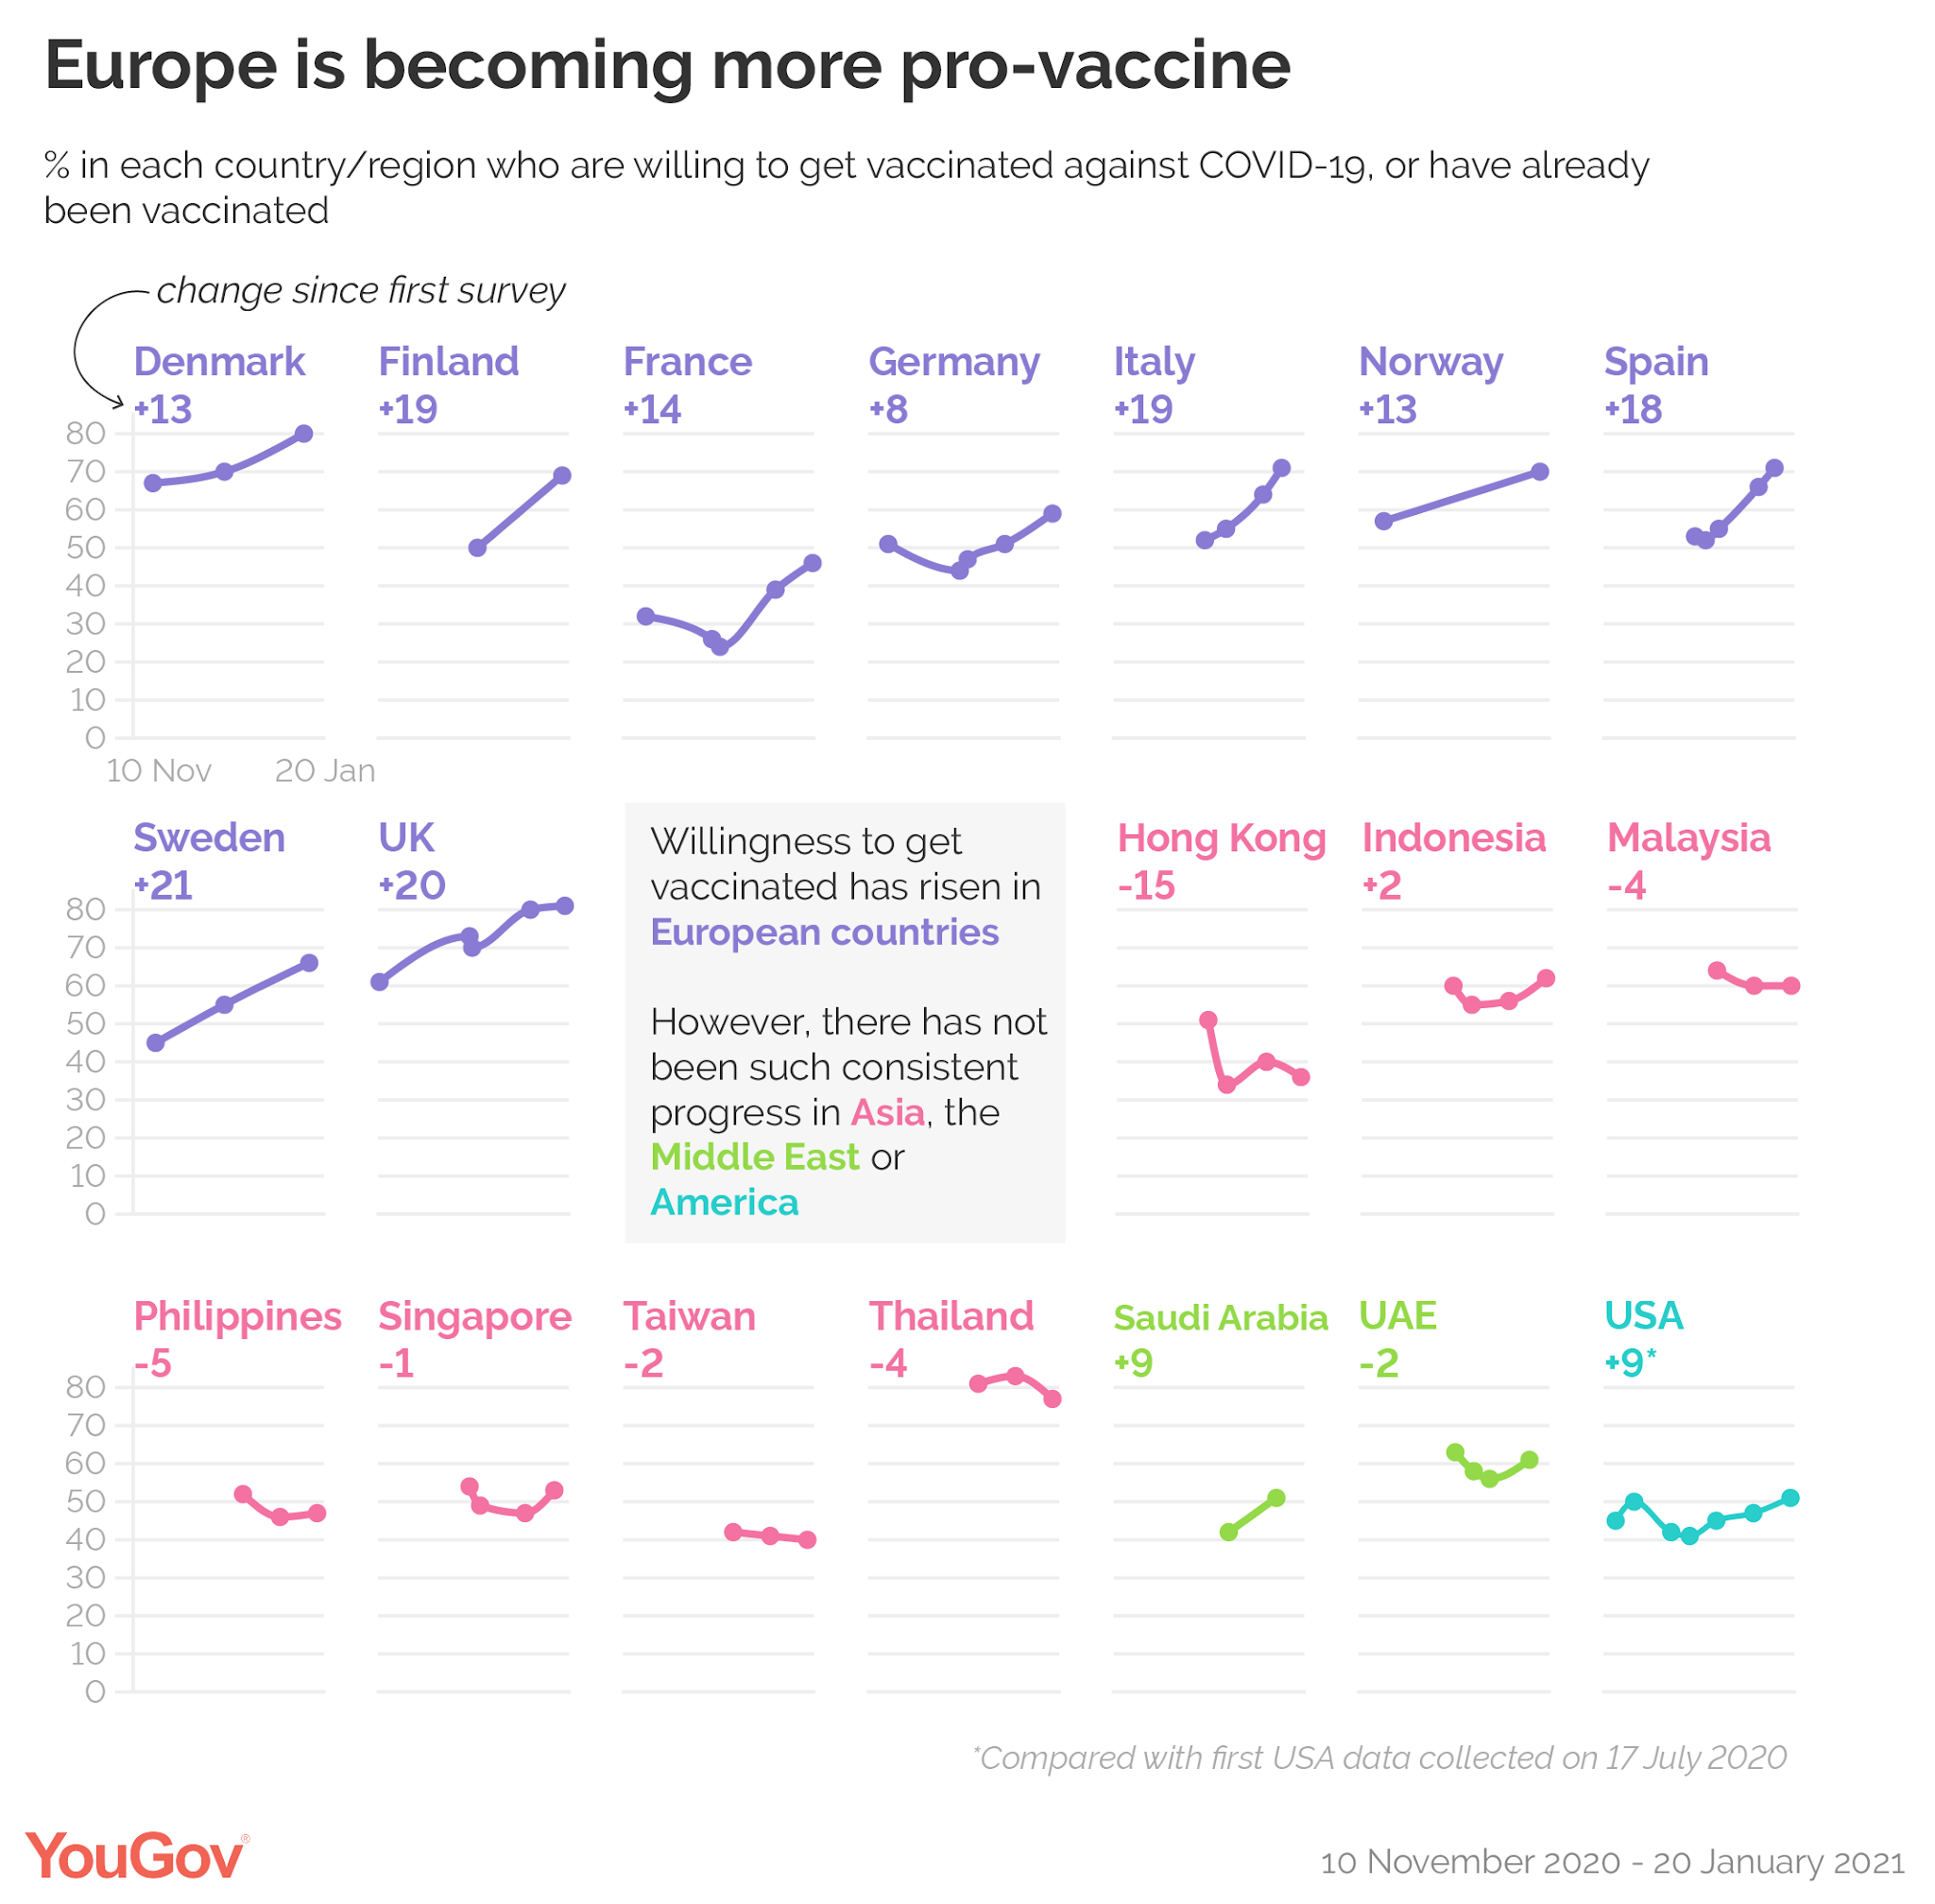
In addition, the general acceptance of a vaccine is still a bit low. While vaccine acceptance is growing in Europe, the acceptance rate in most countries varies between 50% and 60%, which is not enough to achieve herd immunity. In addition, if governments were to impose continuing precautionary measures even after people are vaccinated, the policies create disincentives for people to vaccinate. Continuing rolling lockdowns would delay the global recovery and push back growth expectations.
Still constructive
Don’t get me wrong. I remain constructive on the market outlook and the base case scenario still calls for a prolonged equity bull market. This chart of IPO activity puts the market cycle into context. Sure, IPO activity is starting to look frothy, but history shows it can take several years before a secular market top is reached.
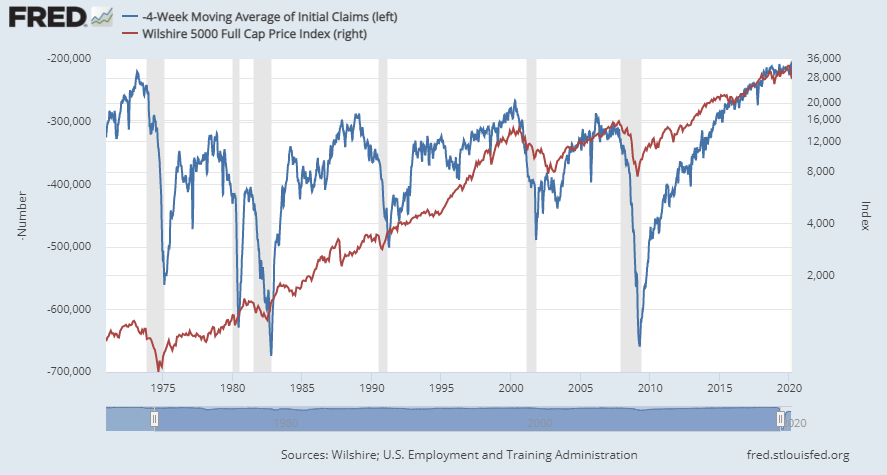
I am also indebted to New Deal democrat for the following insight, which shows the high degree of correlation between stock prices (blue line) and initial claims (red line, inverted) before the onset of the pandemic. As long as the recovery continues, the stock market should grind higher.
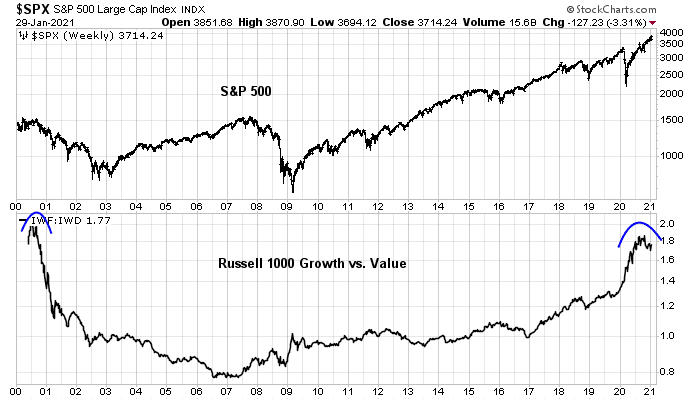
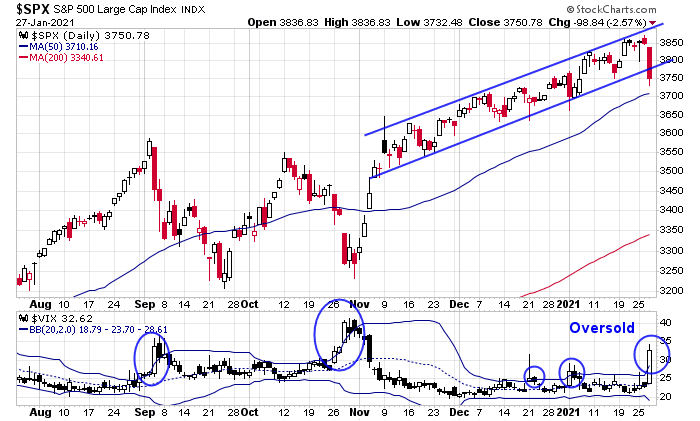
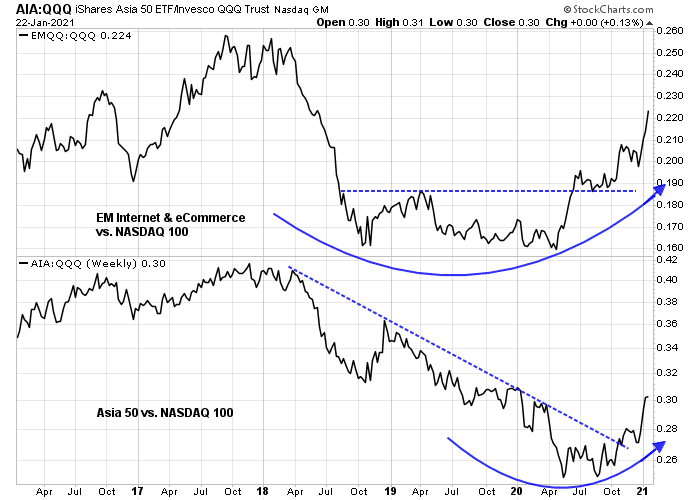
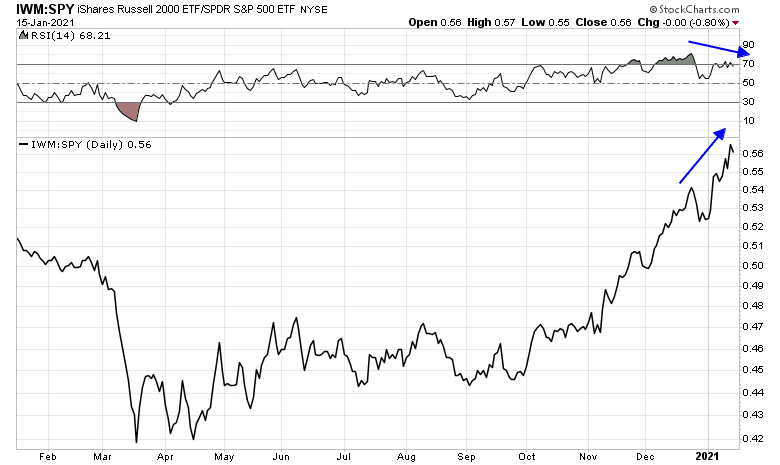
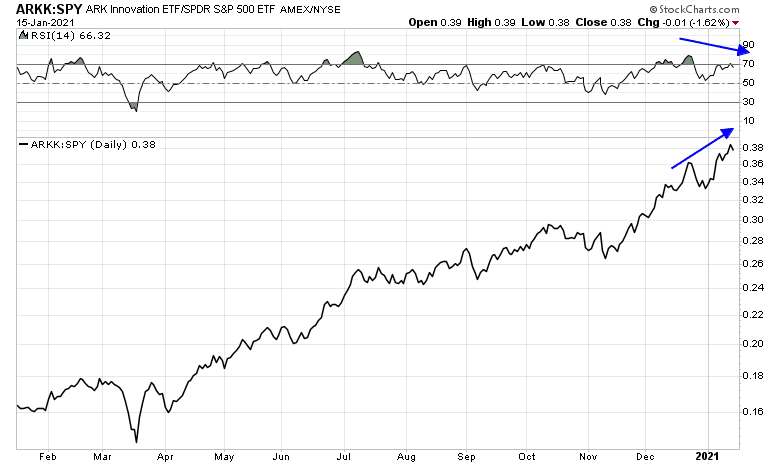
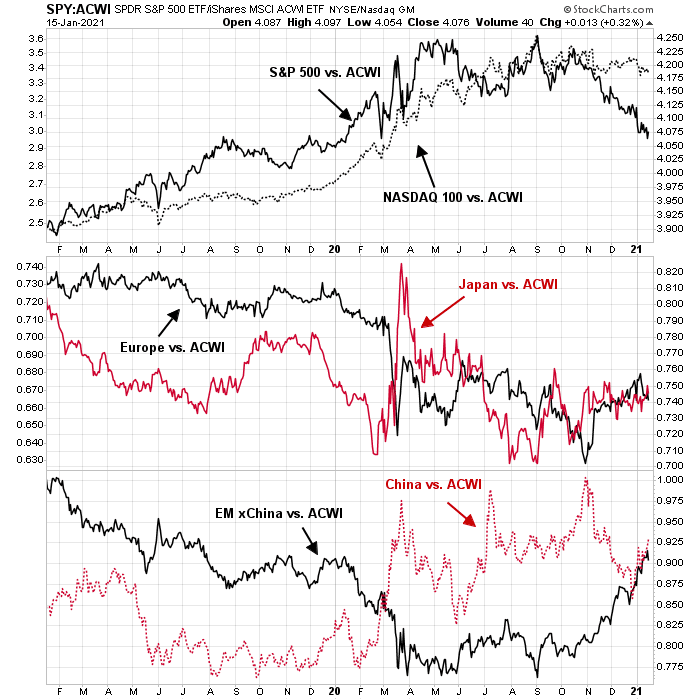
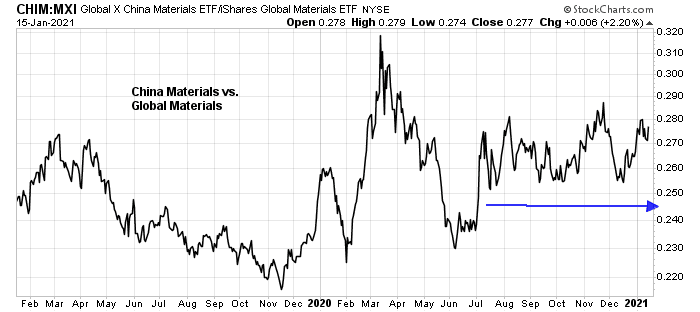
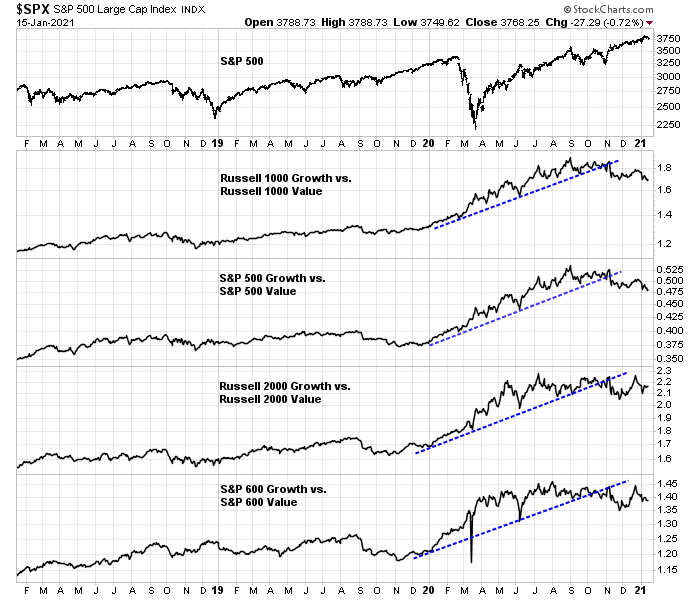
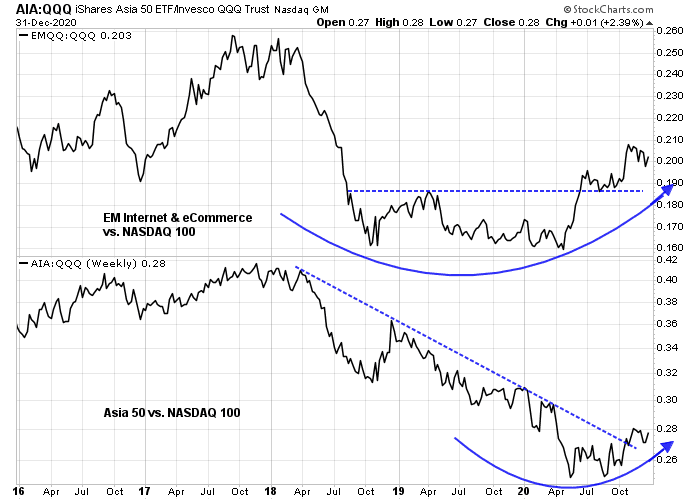
In the short-term, however, the market has become a little too giddy and a risk appetite reset may be necessary. A number of potholes are appearing on the road, any of which could be the catalyst for the reset. Investors are advised to focus on value over growth. As well, better value can be found outside the US, which is confirmed by the results of the cross-border equity risk premium analysis.