It’s time for one of my periodic reviews of the market from a factor and sector perspective. These reviews are useful inasmuch as they can reveal insights about the character of a market.
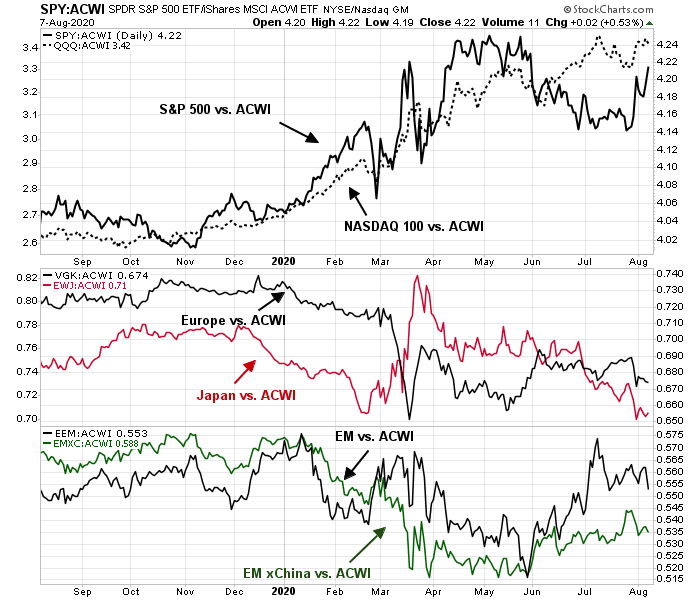
Let’s begin with how different regions are performing relative to the MSCI All-Country World Index (ACWI). The top panel shows the S&P 500 rolling over relative to global stocks. Even the NASDAQ 100, which had been the market leaders, may be losing relative momentum and starting to trade sideways. The middle panel shows the relative performance of two major developed market regions. Japan is underperforming, and Europe is not showing signs of market leadership as it is trading sideways on a relative return basis. The bottom panel shows the relative performance of emerging market equities. Both EM and EM xChina are starting to bottom and exhibit relative strength, which is a possible sign of a global cyclical rebound, as EM equities tend to be high beta and highly cyclically sensitive.
EM risk appetite rising
The analysis of EM risk appetite shows that EM currencies and EM bond prices are trending up, and their movements are correlated with the S&P 500.

The key risk to the EM bull narrative is a USD rally. There is already a crowded short in the USD. Weak EM sovereigns and companies have limited capacity to finance in their own currencies and borrow in USD. A falling USD therefore provides a tailwind for EM assets. Bloomberg reported that BoA currency strategist David Woo distilled a short USD position implies optimism about quick vaccine availability.
A bet on the U.S. dollar declining in the medium term makes the key assumption that a vaccine against the novel coronavirus will be available comparatively soon, according to Bank of America Corp.
That’s because Europe and Asia have a higher chance of fresh waves of infections the longer it takes for a vaccine to be found, a scenario that’s bullish for the dollar, said David Woo, a strategist at the bank…
A prolonged path to an inoculation would boost the odds “that liquidity support from central banks will not be enough to shore up financial markets,” he said. That could spur risk aversion and benefit the dollar given its status as a safe haven.
Several vulnerable EM are already in trouble. Turkey is in trouble again. Turkish companies have USD debt equivalent to roughly one-third of GDP. The Turkish Lira is falling, indicating rising stress for the Turkish economy.

Then there is the tragedy in Lebanon. An unexpected explosion rocked Beirut and severely damaged the port and its economy. Even before the explosion, Lebanon was already seeking IMF aid, as Bloomberg explains.
Unable to generate foreign significant support, oversee an economic recovery or guarantee public safety, Prime Minister Hassan Diab’s administration, cobbled together in January after mass protests brought down the previous government, may not last. Though Lebanon’s problems are an accumulation of nepotistic policies and public mismanagement over the decades, he’s facing criticism for doing too little to manage the country’s multiple crises.
After defaulting on a $90 billion debt pile, and before the latest disaster, Lebanon was seeking $10 billion in aid to support its financial turnaround. Beirut governor Marwan Abboud has told local media the repair bill for the capital alone will cost up to$5 billion that the government simply can’t afford.
“Large elements of the public no longer believes the government is able to manage,” Ayham Kamel, head of Middle East and North Africa research at Eurasia Group, said in a note. “The economic crisis will also deepen as the port is the main trade valve and base for many stored goods awaiting clearance.”
Talks with the IMF had stalled as it became clear that politicians and bankers could not agree even on the magnitude of financial losses let alone who should pay for them. The government has lost key advisers and officials and the foreign minister resigned this week, frustrated that political elites were too busy protecting their own interests to take the steps demanded by potential lenders to save the economy from ruin.
These economies are already teetering, even under a weak USD regime. What happens if the greenback were to strengthen?
Know your implicit exposures. This is one example of how cross-asset analysis can disentangle the macro bets investors are making.
Sector analysis
Turning to sector analysis, our primary tool for sector analysis is the Relative Rotation Graph (RRG). As a reminder, Relative Rotation Graphs, or RRG charts, are a way of depicting the changes in leadership of different groups, such as sectors, countries or regions, or market factors. The charts are organized into four quadrants. The typical group rotation pattern occurs in a clockwise fashion. Leading groups (top right) deteriorate to weakening groups (bottom right), which then rotates to lagging groups (bottom left), which changes to improving groups (top left), and finally completes the cycle by improving to leading groups (top right) again.
Here is the RRG chart of the US market.
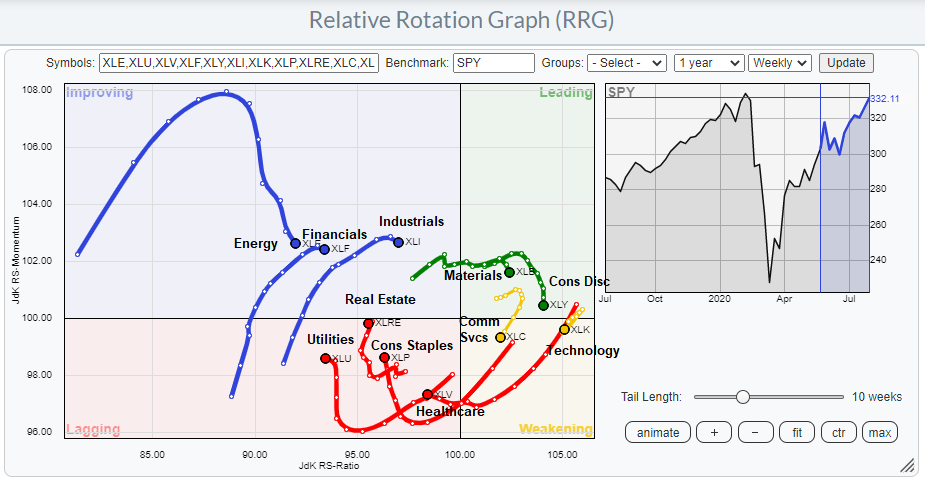
Here are some of the key takeaways of the RRG sector analysis.
The first surprise is technology and communication services, which are some of the key drivers of the FANG+ leadership, have migrated from the leading quadrant to the weakening quadrant. Upon closer inspection, while technology stocks are in a well-defined relative uptrend, RSI has been weakening, indicating a loss of momentum. This is consistent with the previous observation that NASDAQ 100 is starting to weaken against ACWI.

Further weakness in technology stocks may be hastened by Trump’s recent Executive Order against TikTok and WeChat. It is unclear what the exact meaning of the EO, but it could devastate the video gaming industry as WeChat owner Tencent has ownership stakes in US companies that make popular games like “League of Legends”, “Fortnite”, and “World of Warcraft”. In addition, if the EO mandates the removal of WeChat from Apple’s App Store on a global basis, it would devastate Apple’s business in China.
The second surprise is the presence of material and consumer discretionary stocks in the leading quadrant, which implies the market’s belief that a cyclical rebound is under way. There is no question that rising but choppy relative strength in material stocks appears bullish, but bear in mind that this is the second smallest sector in the index with a weight of 2.6%.

The composition of the consumer discretionary sector is dominated by heavyweight Amazon. While the relative performance of the float weighted sector has been strong, the equal weighted performance of this sector is less impressive, but it is nevertheless strong.

Beyond the market leadership of cyclical materials and consumer discretionary stocks, what up-and-coming sectors can investors consider? For that, we analyze the three sectors in the improving quadrant, namely industrial, financial, and energy stocks. The relative chart patterns of these three sectors shows a bottoming process, but they may need more time to consolidate before they can strengthen to become market leaders. That said, I have reservations about two of the sectors. The trajectory of energy stocks on the RRG chart suggests that they are likely to roll over and fall into the lagging quadrant. In addition, it is difficult to see how financial stocks can assume a leadership position during an era when the Fed is effectively engaged in financial repression, which directly squeezes the companies in the sector.

Factor analysis
Before embarking on an analysis of factor leadership, let’s review the status of the big three factor leaders so far. Major changes in long-term leadership often occur during transitions from bull to bear markets.
- US over global: Rolling over
- Growth over value: Very strong
- Large caps over small caps: A pause in the trend, but large caps are still outperforming

Here is the RRG analysis of some of the commonly used quantitative factors.

The weakening quadrant contains large cap growth and price momentum, which is mainly made up of large cap growth stocks. This is consistent with the previous observation of the picture of weakening NASDAQ 100 leadership.
The leading quadrant contains high beta and small cap growth. In theory, leadership by these factors should be bullish because they represent high beta stocks. However, their relative performance patterns show limited relative strength that have not yet breached key relative resistance levels yet.
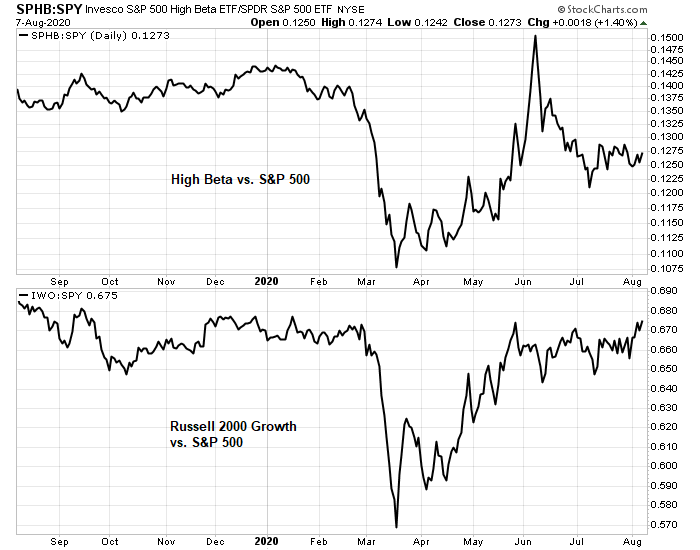
The other factors in the improving quadrant can mainly be classified as different flavors of value. A revival of value over growth may be a sign of leadership transitions that occur during bull/bear phase changes.
Poised for a cyclical rotation
Putting all of the sector and factor review together, what do we have?
- Weakening US market leadership
- Some early signs that NASDAQ 100 and US growth are poised to roll over
- Emerging EM and cyclical leadership
The BoA Global Fund Manager Survey shows that global managers have been piling into US equities as the last source of growth in a growth starved world.

Sector and factor rotation analysis indicates that US large cap growth stocks are about to hand over the market leadership to cyclical and EM stocks. In a normal market, this would be the sign of a healthy rotation.
However, Vincent Deluard of Intl FC Stone pointed out that there is a problem with US large cap growth concentration. The weight of FAANMG is now greater than the combined weight of financial, energy, industrial, and material sectors.
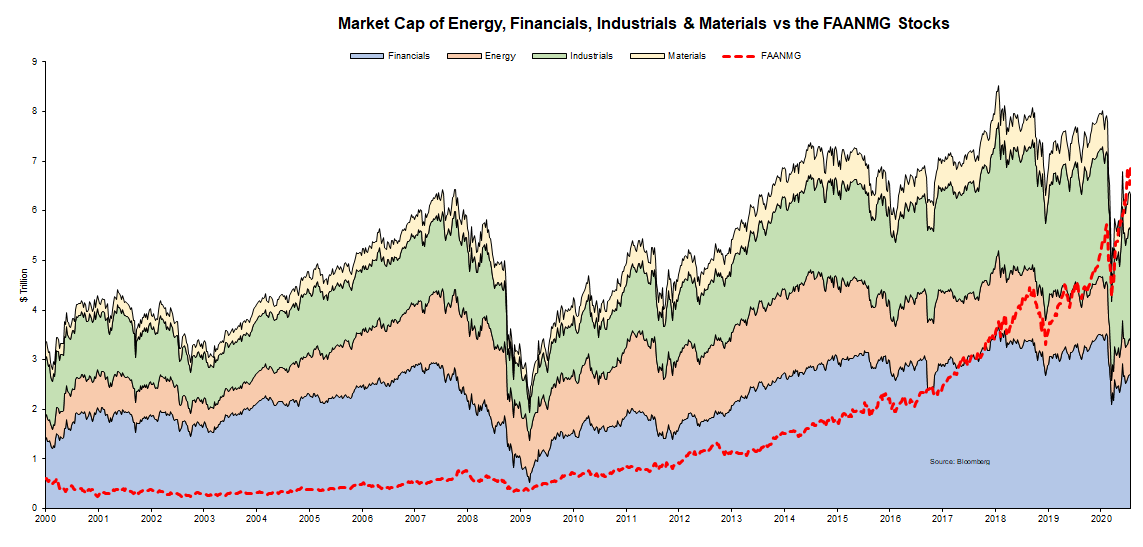
FAANMG stocks have been on a tear. The funds flow implications of a rotation out of large cap growth is likely to put downward pressure on the overall market because of the sheer size of these stocks. The size of the cyclical sectors are unable to cope with the fund flows, and will likely leak to other asset classes, such as non-US equities, and fixed income instruments. Much will depend on the perceived catalyst of the fund flow shift. Please be reminded of Bob Farrell’s Rule #4: “Exponential rapidly rising or falling markets usually go further than you think, but they do not correct by going sideways.”
Not a normal cycle
While cyclical sectors appear to be poised to rise, their ascendancy into the next market leaders is complicated by the fact that this is not a normal market and economic cycle where normal rules apply. The COVID Crash and subsequent recovery was sparked by an unexpected global macro shock, and not a normal downturn owing to central bank tightening that eventually leads to a recession.
Howard Marks at Oaktree explained why this is not a normal cycle.
Two of the questions I get most often these days are, “What kind of cycle are we in?” and “Where do we stand in it?” My main response is that the developments of the last five months are non-cyclical in nature, and thus not subject to the usual cycle analysis.
The normal cycle starts off from an economic and market low; overcomes psychological and capital market headwinds; benefits from gathering strength in the economy; witnesses corporate results that exceed expectations; is amplified by optimistic corporate decisions; is reinforced by increasingly positive investor sentiment, and thus fosters rising prices for stocks and other risk assets until they become excessive at the top (and vice versa on the downside). But in the current case, a moderate recovery – marked by reasonable growth, realistic expectations, an absence of corporate overexpansion and a lack of investor euphoria – was struck down by an unexpected meteor strike.
He concluded:
I’m convinced cycles will continue to occur over time, highlighted by excessive movements away from “normal” and toward extremes – both high and low – that are followed by corrections back to normalcy, and through it to excessive in the opposite direction. But that’s not to say that every event in the economy or markets is cyclical. The pandemic is not.
Here is what we know. The pandemic caused an economic downturn that ranks second in scale to the Great Depression. The monetary and fiscal authorities have responded with unprecedented level of support. However, US fiscal support may be fading. Return to normalcy therefore depends on the fight against the virus, and the availability and effective deployment of vaccines and therapeutics. Official health policies matter less than confidence. A recent study concluded that consumer fears led to a drop in business visits regardless of whether lock-down measures were in place.
The collapse of economic activity in 2020 from COVID-19 has been immense. An important question is how much of that resulted from government restrictions on activity versus people voluntarily choosing to stay home to avoid infection. This paper examines the drivers of the collapse using cellular phone records data on customer visits to more than 2.25 million individual businesses across 110 different industries. Comparing consumer behavior within the same commuting zones but across boundaries with different policy regimes suggests that legal shutdown orders account for only a modest share of the decline of economic activity (and that having county-level policy data is significantly more accurate than state-level data). While overall consumer traffic fell by 60 percentage points, legal restrictions explain only 7 of that. Individual choices were far more important and seem tied to fears of infection. Traffic started dropping before the legal orders were in place; was highly tied to the number of COVID deaths in the county; and showed a clear shift by consumers away from larger/busier stores toward smaller/less busy ones in the same industry. States repealing their shutdown orders saw identically modest recoveries–symmetric going down and coming back. The shutdown orders did, however, have significantly reallocate consumer activity away from “nonessential” to “essential” businesses and from restaurants and bars toward groceries and other food sellers.
So where does that leave us? I believe that equity risk and return are asymmetrically tilted to the downside. Conventional sector and factor analysis is pointing towards a rotation out of US large cap growth stocks into cyclical and EM equities. However, this is not a normal cycle and many of the usual investment rules go out the window. Historical analogies are of limited use. This is not 2008 (Great Financial Crisis), 1999 (Dot-com Bubble), 1929 (Great Depression), or 1918 (Spanish Flu).
Investors have to consider the bearish scenario that a rotation out of US large cap growth does occur because of a crowded long positioning, but the rotation into cyclical and EM does not occur. Instead, the funds find their way into Treasuries and other risk-off proxies because of either the failure of early vaccine trials, or teething problems with deploying vaccines and therapeutics. In that case, the growth path falls considerably from the current consensus, and a risk-off episode and valuation adjustment follows.
One of the key signposts of the bearish scenario is the price of precious metals. Both gold and silver have been soaring. While they are overbought, their fundamentals are inversely correlation to real interest rates. However, investor sentiment and positioning is at an extreme crowded long. Should precious metals fail to respond to further signs of falling real rates, then the bearish scenario becomes a strong possibility.

My mother had a saying “It’s like trying to herd a bunch of cats”
We are in a new environment and new ideas shot onto the scene and seem logical only because old logic doesn’t seem to work. Down is up or maybe not.
When government support ends, we are faced with reality and not Alice’s Wonderland. Until then we herd cats and mutter afterwards, “Would have, could have, should have.”
When in Wonderland, do as Wonderlanders do. It may be a new trading environment, but if the goal is to make money then it’s my job to find a way to herd cats.
It may not be as hard as it seems. Rather than anticipate market moves, I’ve found that reacting to seemingly illogical price moves can work. Sure, we may never be able to explain why it was profitable – but there’s plenty of time to ponder the puzzle on our way to the bank.
You need a can of SloCat spray. Just spray them and they slowdown 90%, if that’s not enough spray again, up to 3 times in all, at which point they will be getting rear ended by snails.
From New Deal Democrat
“There has been enough improvement this week for the nowcast to improve from negative to neutral. The short-term forecast remains positive. The long-term forecast, driven by record low interest rates, continues to be very positive.
Federal emergency unemployment benefits have now stopped. Driven by panic by GOP members of the Senate up for re-election this year, I expect a deal to be struck to extend them.
The bottom line from the short and long leading indicators is that the economy “wants” to improve, but over the next six months, the coronavirus, and the reactions of the Administration, the Congress, and the 50 governors to the virus are going to be the dispositive concerns.”
https://seekingalpha.com/article/4366209-weekly-high-frequency-indicators-economy-wants-to-improve-will-coronavirus-and-decision
“Should precious metals fail to respond to further signs of falling real rates, then the bearish scenario becomes a strong possibility”.
If real rates fall further, why would precious metals not keep going higher?
Real rates depend on inflation expectations. If there’s no fiscal stimulus and only easy monetary policy, how do inflation expectations rise?
Easy money policy debases dollar, hence DXY is falling. Dollar index is failing and hence fixed supply assets like precious metals are going up.
Inflationary expectation is one factor that governs precious metal pricing.
Your point about precious metals not respond to QE, is well understood, but there is big IF in your statement.
Hi Cam
This interview from a week or so ago with Robert Gallo suggests that a covid vaccine is a bit tricky…maybe another year or so from what I can decipher…he speaks in a very technical manner!!
https://youtu.be/rHvV81ZB-fk?t=3475
**Robert Charles Gallo (born March 23, 1937) is an American biomedical researcher. He is best known for his role in the discovery of the human immunodeficiency virus (HIV) as the infectious agent responsible for acquired immune deficiency syndrome (AIDS) and in the development of the HIV blood test, and he has been a major contributor to subsequent HIV research.
He is the director and co-founder of the Institute of Human Virology (IHV) at the University of Maryland School of Medicine in Baltimore, Maryland, established in 1996 in a partnership including the State of Maryland and the City of Baltimore. In November 2011, Gallo was named the first Homer & Martha Gudelsky Distinguished Professor in Medicine. Gallo is also a co-founder of biotechnology company Profectus BioSciences, Inc. and co-founder and scientific director of the Global Virus Network (GVN).
Gallo was the most cited scientist in the world from 1980–1990, according to the Institute for Scientific Information, and he was ranked third in the world for scientific impact for the period 1983–2002. He has published over 1,300 papers.