When a stock market shifts from a bull to a bear market, leadership usually changes. Bear markets are often periods of catharsis. The old leaders get tired, and they have been bid up to excessive valuations. A reality check sets in and they fall. As the old leaders fail, new market leaders emerge to guide a new bull upward.
It is therefore with great interest that we have been monitoring the Big Three leadership themes in the US market, namely US over non-US, growth over value, and large caps over small caps. Of the three, growth continues to be extremely strong, US stocks have temporarily plateaued and they may be turning down, and small caps are resuming their underperformance after a brief three-month turnaround.

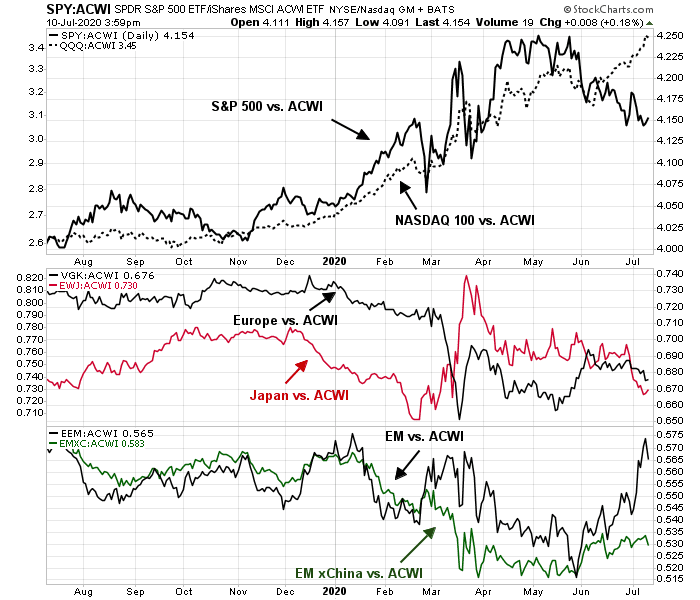
From a global perspective, the leadership mantle of US stocks is faltering. The following chart shows the returns of different regions relative to MSCI All-Country World Index (ACWI). All returns are in USD so currency effects are already included in performance. Within the US equity market, the S&P 500 is rolling over on a relative basis, but the NASDAQ 100 continues to soar. A look at the developed markets (middle panel) shows no sustainable trends. Japan has weakened after a short-lived rally, and Europe’s relative performance has chopped around for the past few months. It is the emerging markets (bottom panel) that has shown the greatest promise in leadership. While it is true that EM equities have soared in relative performance, EM xChina stocks are tracing out a constructive but unexciting saucer bottoming pattern. By inference, it is China that has become the global market leader.
If this is the start of a new bull, or a continuation of the old bull, can it rest on the narrow leadership of a handful of NASDAQ stocks and the Chinese market?
Is this just a double bubble, and does that imply double trouble ahead?
NASDAQ leads the way
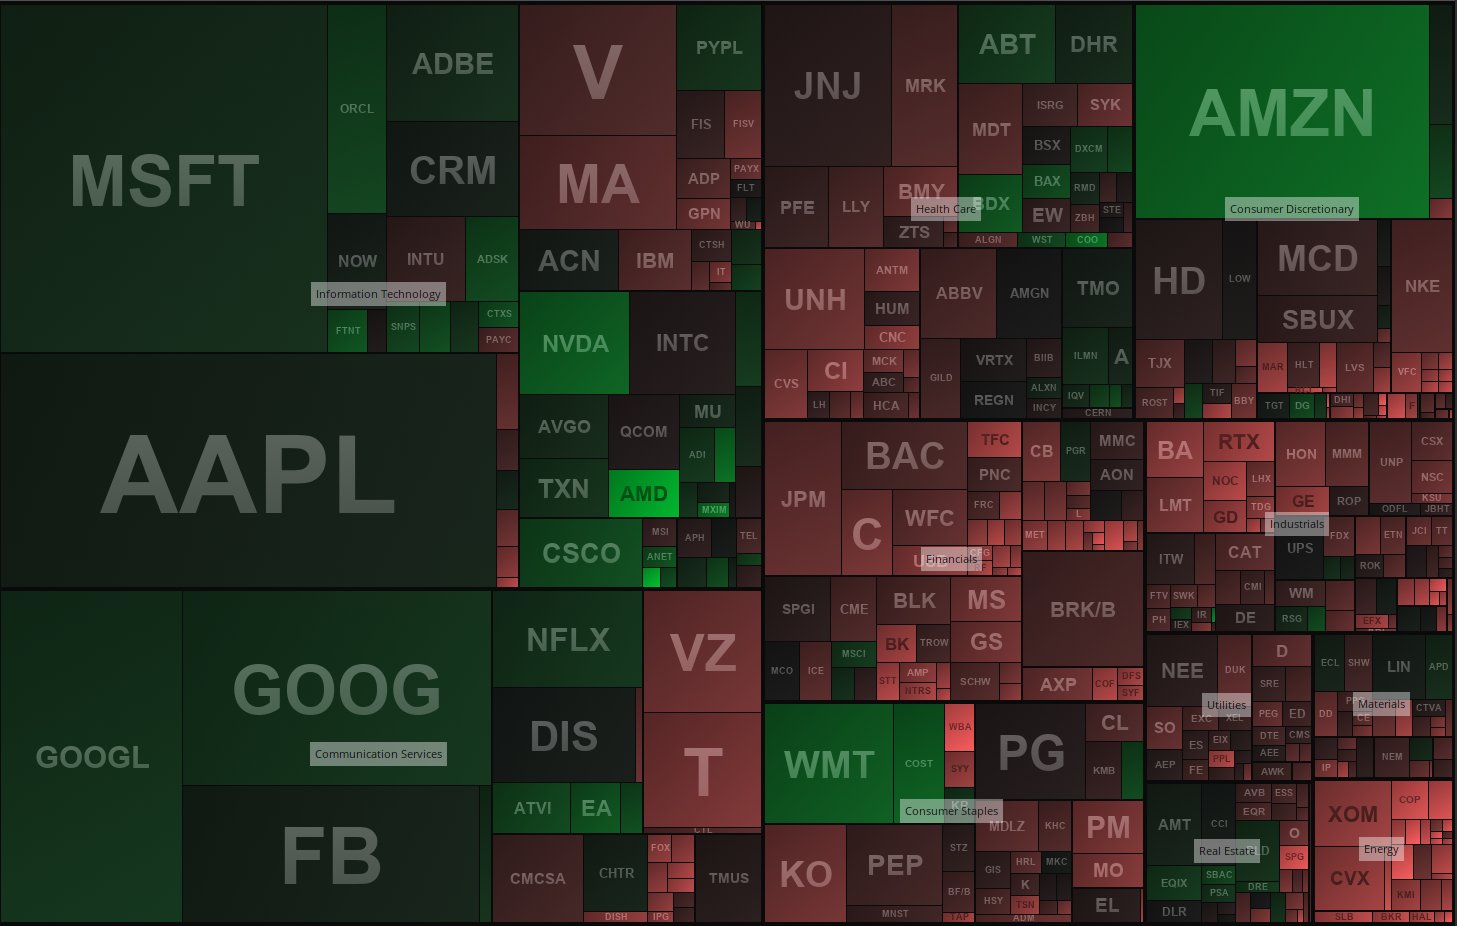
Let’s begin by considering the internals of the US equity market. We all know by now how the FANG+ and NASDAQ 100 have been on a tear. Here is a recent heat map of the S&P 500, with individual boxes sized by weightings. Notice anything about the biggest stocks that dominate the index?
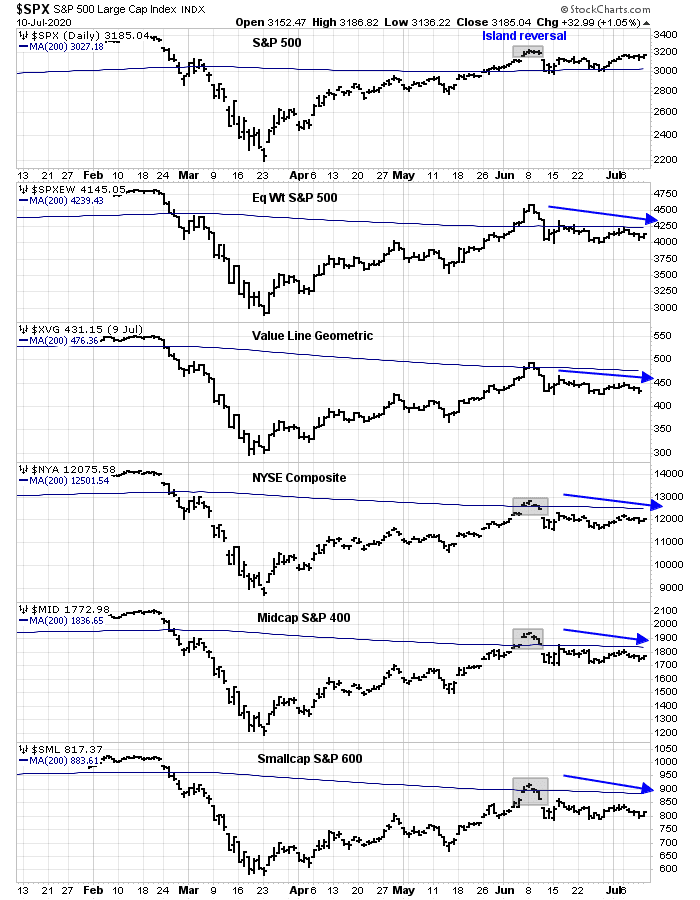
Once we exclude the NASDAQ leaders, things don’t look as exciting. As the chart below shows, the S&P 500 is trying to stage a bullish impulse after a bearish island reversal after successfully testing its 200 day moving average (dma). However, a glance under the hood of broad market indices tell a story of weak participation. The equal-weighted S&P 500, the equal-weighted Value Line Geometric Index, the NYSE Composite, as well as the mid and small cap indices are all showing patterns of lower highs since early June. Some of these indices have exhibited bearish island reversals that have not not been challenged. All are trading below their 200 day moving averages.
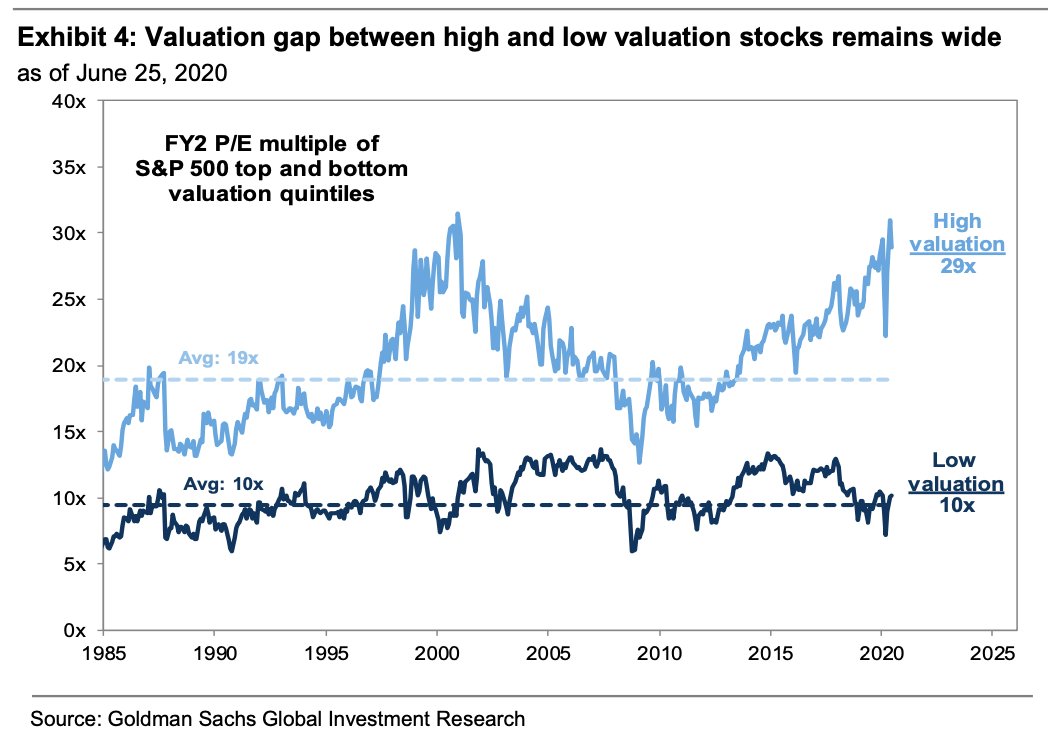
I have voiced my concerns in these pages about the excessive valuation of the US equity market. Forward 12-month P/E ratios are in the nosebleed region of well over 20. Even if investors were to look over the 2020 earnings valley, the P/E ratio based on 2021 earnings is 19 or more.
Goldman Sachs recently performed some revealing analysis of stock market valuation by quintile. The valuation of the cheapest quintile is only average, or not excessive, but the market’s high market valuation is mainly attributable to the sky-high multiples posted by the most expensive quintile, which are mainly the NASDAQ names.
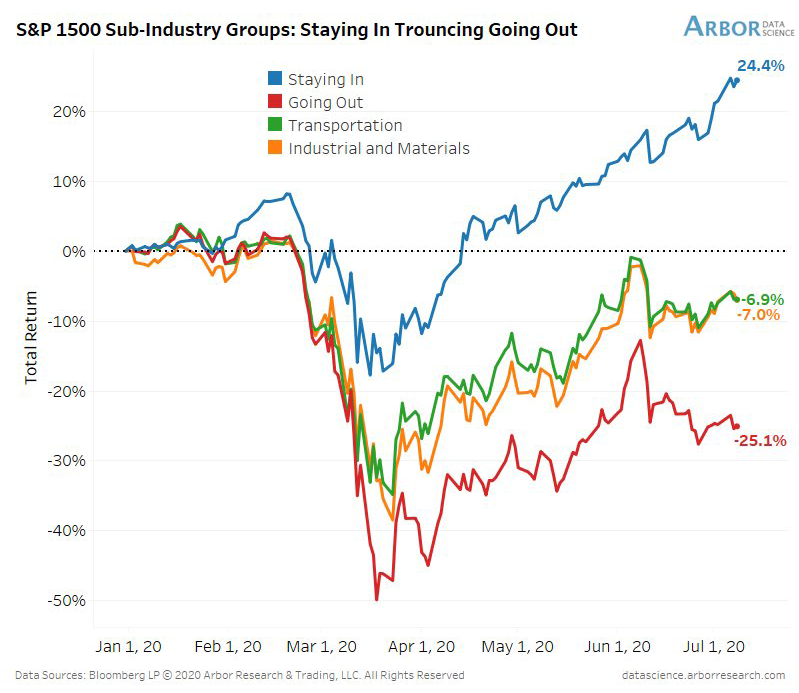
If the US market is being held up by the FANG+ and NASDAQ stocks, how long can this narrow leadership continue? Arguably, many of the shares of these companies have benefited from the pandemic as the recent “staying in” theme.
FT Alphaville recently offered a perspective on “staying in” theme by focusing on cloud computing, or SaaS (Software as a Service) companies. Among the leaders in this group are Zoom Video and Shopify, which trade at sales multiples of 30 or more.
It’s important to note that some of the valuation premiums for these companies is justified. The idea is that once these businesses have established themselves as an intrinsic part of a company’s enterprise software stack, they can effectively extract rents from their customers — either through price increases or cross-selling. All, we should add, at an almost zero marginal cost. Theoretically, these economics should make the businesses extremely cash-generative, and capital-light, once they have fully matured.
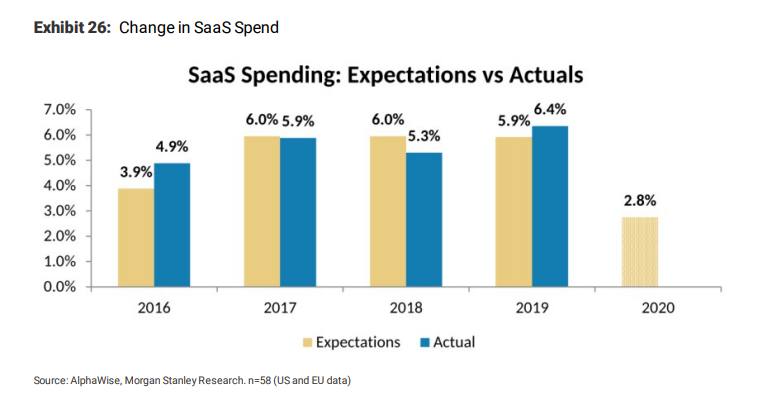
These companies must be enjoying terrific sales growth in the current environment, right? Don’t be so sure. The FT Alphaville article cited a Morgan Stanley survey of CIOs about their SaaS spending expectations. The expected spending growth in 2020 is a measly 2.8%. Does that sound like the sort of growth that would drive stratospheric valuations?
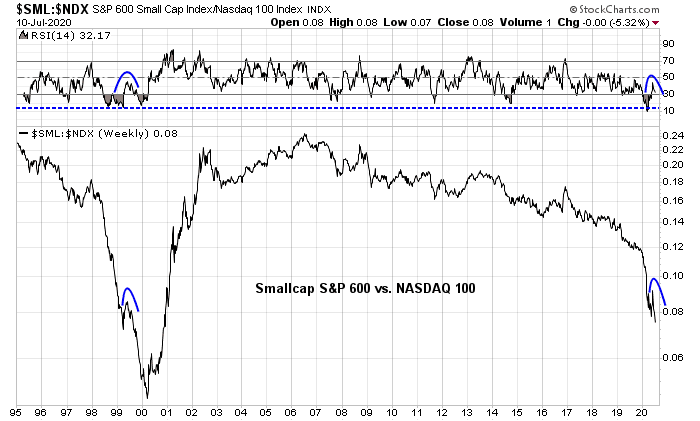
While the fundamentals argue for a pause, the long-term technical picture is signaling a possible continuation of the NASDAQ frenzy. Consider two extremes of the current market leadership, namely growth (NASDAQ) and small cap stocks. The small cap to NASDAQ ratio is falling again after a brief recovery. We saw a similar episode in 1999 when the ratio became extremely oversold on a 14-week RSI and recycled. Then the ratio resumed its decline until the ultimate bottom in March 2000. If that incident is any guide, the analogous moment today is only mid-1999.
China’s “I can’t lose” melt-up
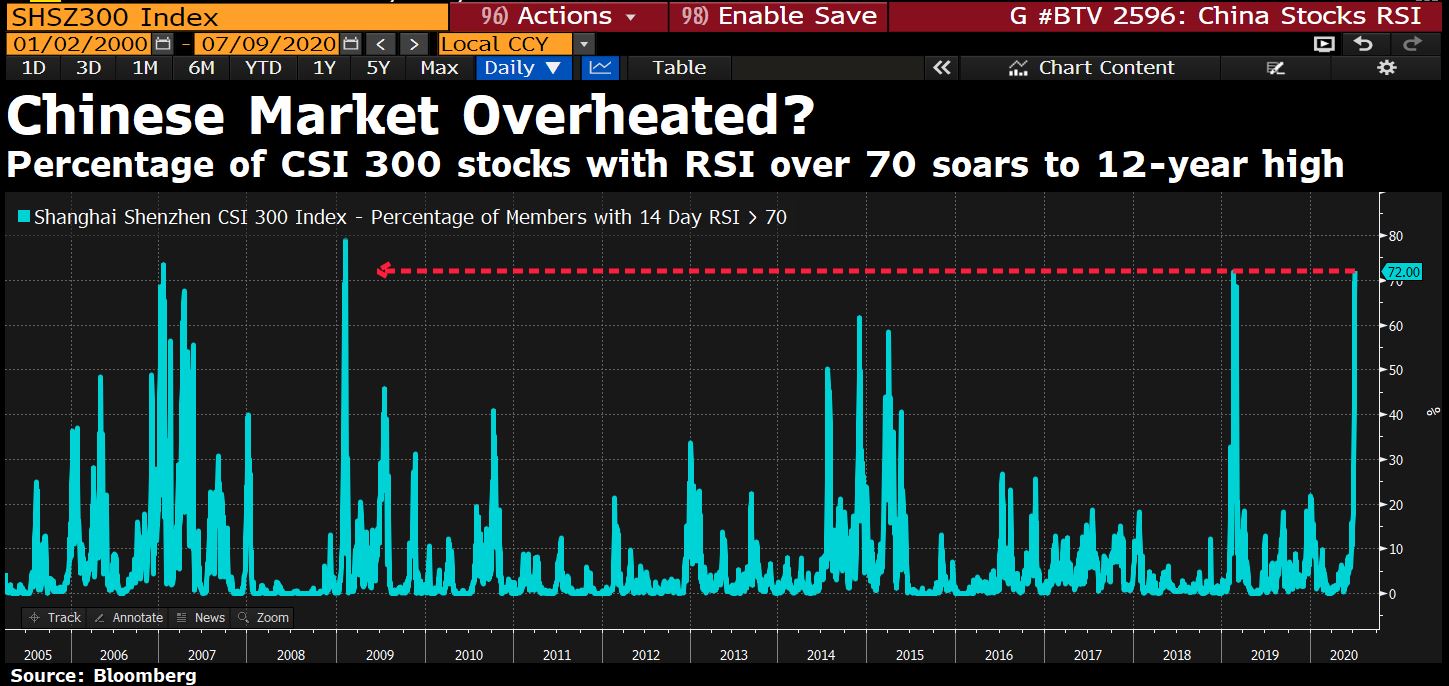
Over on the other side of the world, China’s stock market has gone parabolic. Bloomberg documented the “I can’t lose” mentality among retail traders.
Like millions of amateur investors across China, Min Hang has become infatuated with the country’s surging stock market.
“There’s no way I can lose,” said the 36-year-old, who works at a technology startup and opened her first trading account in Beijing on Tuesday. “Right now, I’m feeling invincible.”
Five years after China’s last big equity boom ended in tears, signs of euphoria among the nation’s investing masses are popping up everywhere. Turnover has soared, margin debt has risen at the fastest pace since 2015 and online trading platforms have struggled to keep up. Over the past eight days alone, Chinese stocks have added more than $1 trillion of value — far outpacing gains in every other market worldwide.
While it would be easy to dismiss as a replay of this year’s Robinhood rally in the U.S., China’s budding equity mania could in many ways be more consequential. Unlike in most major markets, the nation’s individual investors account for the lion’s share of local stock trading and have been prone to extreme swings in sentiment that can have ripple effects on the economy and monetary policy.
For now, indicators of market overheating are still comfortably below levels reached during the height of equity bubbles in 2007 and 2015. The risk is that breakneck gains — stoked in recent days by bullish articles in state-run media — could eventually result in a destabilizing crash.
Indeed, the Shanghai Composite went vertical until Friday, when two state-owned funds began selling to signal that the rally was overdone. Regardless, the Chinese market’s advance began well before last week’s frenzy. A glance at the stock markets of China’s major Asian trading partners shows that the nearby Hong Kong market has also staged a strong rally, and so has Taiwan, but that’s mainly attributable to the strength of the semiconductor group. The charts of the other markets, such as South Korea, Singapore, and Australia, appear to be less exciting.

How sustainable is the Chinese market rally? John Authers at Bloomberg offered the following “glass half full” perspective.
The best guess is that China has pressed the pedal on expanding credit once more, but not by using orthodox monetary policy and not in a way that weakens the currency. The following chart, from CrossBorder Capital LLC of London tells the story of the remarkable expansion of Chinese credit over the last quarter of a century as well as anything:
The stimulus applied by Shanghai’s big equity bubble in 2007, and then by the huge extra spending and credit easing that started in late 2008 to deal with the last global financial crisis, was on a different scale from the stimulus that is now being applied. Much of that was achieved via shadow banks, shown by the yellow line, whose opaque structures led to concerns that China could stage its own repeat of the Lehman crisis. The People’s Bank of China has spent the last few years in an explicit attempt to avert this risk, and now appears to have shadow banking under control. That has allowed them to unleash a 20% increase in liquidity, through traditional banks and through the bond and equity markets.
For the short term, this can only be positive. Questions will rightly continue about whether the Chinese regime, attempting to use a communist command structure to regulate a capitalist economy, can possibly endure. It is only a few months since the Communist Party’s inadequate response to the early stages of the pandemic appeared to be heralding major change. But for the short term, China appears to have been able to right its ship, and to find the money to keep its economy nicely afloat.

Greg Ip at the WSJ offered the following “glass half empty” perspective, based on the recent book by Matthew Klein and Michael Pettis, Trade Wars are Class Wars: How Rising Inequality Distorts the Global Economy and Threatens International Peace.
Like South Korea and Japan before it, China grew rapidly by channeling its people’s savings into high-return investments in education, public infrastructure and export-oriented industries. It did so through an undervalued exchange rate and a financial system that subsidized industrial borrowers by paying savers next to nothing. Both have been reformed, but Messrs. Klein and Pettis note that many features of China’s economy still discriminate against workers and consumers: adversarial unions are illegal, taxes on labor and consumption are high, and millions of migrant workers are deprived of social benefits for lack of residential permits.
By definition, surpluses in one country must equal deficits in another, so the trade surpluses generated by China and Germany force the U.S. (and other low-saving countries such as the U.K.) to run deficits. Trade deficits don’t necessarily reduce employment, but they change its composition. In the 2000s, Chinese imports wiped out millions of U.S. jobs while Chinese savings helped inflate the housing bubble. In that sense, Messrs. Klein and Pettis write, inequality in China contributed to inequality in the U.S.
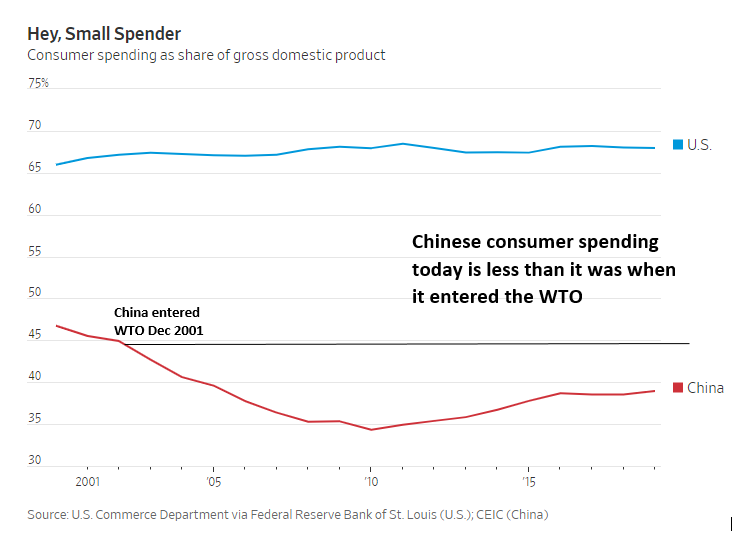
The authorities in Beijing implemented policies that suppress consumption and encouraged savings and investment. The savings and investment went into infrastructure and export industries, which channeled goods to import hungry markets like the US. The gains from the excess investments accrued to those who engineered the globalization and export boom, namely the top tier of Chinese and American society. The exports devastated manufacturing in the developed markets. Klein and Pettis concluded that Chinese inequality contributed to American inequality and those effects persists today. China’s household consumption rate is lower than it was when it entered the WTO.
Enter the pandemic. How have events developed since then? Not good.
But events are now going in the wrong direction. Through May, Chinese purchases of U.S. goods are running at just half its commitment, according to Chad Bown of the Peterson Institute for International Economics.
Spending by Chinese tourists abroad, which had offset some of the goods trade surplus, has been shut down by the pandemic. Its manufacturing has recovered faster than retail sales, suggesting surpluses are about to re-emerge. Yet the world is in no mood to absorb China’s production glut: demand is depressed everywhere. These are the ingredients of a global fight for market share fueled by protectionism and currency devaluation.
The bounce back in China was sparked by an official decision to ramp up manufacturing at the expense of consumption. With the global economy in a pandemic-induced slowdown, there is little demand for Chinese exports, and the household sector is not in a position to support economic growth. Ip concluded.
The root cause of the U.S.-China trade war is Chinese under-consumption which leads to Chinese trade surpluses. Those imbalances aren’t going away, and so risk of trade wars won’t, either.
In the meantime, China’s Great Ball of Liquidity has rolled into the local stock market, and they’re having a party on the local exchanges. The market looks technically extended in the short run. Despite Friday’s short-term cautionary signal, these bull runs can last longer than anyone expects, especially if there is official policy support.
Should traders fade China’s market rally or is it the start of a sustainable upturn? History offers uncertain clues. The Chinese stock market saw a melt-up in 2014-15. Other regional stock markets participated in that rally, though the magnitude was different. This time, while the Shanghai Composite has staged an upside breakout, the technical conditions of the other markets are less supportive of a broad based rally.

The tension between Bob Farrell’s Rules
Where does that leave us? I have no idea. What I do know is global stock market leadership has increasingly become narrow. It consists of a handful of NASDAQ stocks and a frenzied FOMO stampede in China. I am torn between Bob Farrell’s Rule No. 4:
Exponential rapidly rising or falling markets usually go further than you think, but they do not correct by going sideways.
And Rule No. 7.
Markets are strongest when they are broad and weakest when they narrow to a handful of blue-chip names.
Investors need to be aware of the tension between Rule No. 4, which raises the possibility of a stock bubble, and the risks posed by the narrow leadership warned by Rule No. 7. Tail-risk is high in both directions. In this environment, it is worthwhile to return to basics and revisit investment objectives and risk tolerances in order to balance risk and reward. There are no perfect answers, and each will be different.
Regardless of which direction the market takes, investor can count on a climate of high volatility for the rest of 2020.
My gut tells me the digestion of how long we are really going to be in this is just sinking in. In CA, the teachers union, with good reason, just stated “ Educators eager to be with their students, but reality of science, facts and safety cannot be ignored” and followed up that they will not be going back under the current conditions. Can’t say I blame them. School starts here in one month….that isn’t happening.
This will play out in every sector. We will see shutdowns soon IMO. If Gov Abbott in TX follows through that will be an incredible turn, and probably lead to other governors following suit. The failures of the administration will force is to go back to March and start over. If not, people will just stay home anyways.
Fall, short of a miracle vaccine, is going to be ugly. I wish that wasn’t true but all signs point that way.
Cam
In conclusion, after reading the last few months of your articles, would it be right to conclude to be extremely defensively positioned (for mature portfolios)?
Sure, you do not know anything about my risk tolerance and portfolio mix. I get that. So, let me rephrase the question:
Would it be right to conclude that a recessionary bear is highly probable here, in the absence of a vaccine, or presuming the pandemic continues or worsens? In such a case a 50% loss in the market from the peak of 3400 is almost certain?
Thanks kindly for all the hard work you do.
Sure, Yes QEs will continue, trying to stave off the 50% decline (history does not support the argument the QEs are always successful in the near term).
My left brain thinks so but my right brain is warning that we may be in a bubble. That’s why the Trend Asset Allocation Model is neutral.
So, left brain says, cut back.
Right brain says, enjoy the rally while it lasts?
I think that not having a clue is a reasonable opinion to have, and that the reasonable investment strategy is neutral weightings, high diversification, and a tilt toward one’s hunches. In my case, that means avoiding small caps, more international (non-US) stocks, some quality intermediate-term corporate bonds, more cash than usual, and a dash of gold and gold miners. I won’t hit a home run, but I might do okay. Okay is okay!
Sounds about right to me.
The likelihood of a vaccine within a year is almost certain & the anticipation of the good news will keep the market from crashing (plus Fed interventions) . Once a vaccine is developed and the initial euphoria ends a sharp sell off will ensue as the weakness of the economy becomes evident. This negative sentiment shift will be more likely if Biden is elected &has both houses of Congress under Democratic control. 2021 might be a terrible year for long only market participants.
Don’t be so sure. There are lots of drugs that go into phase 3 testing with great promise and fail miserably.
My personal guess is we get something in mid-2021, not late 2020 or early 2021.
Cam, do we have a vaccine developed or tested, or mass-manufactured and in the hands of hospitals and clinics all over the world by mid-2021?
Don’t ask me about such details. The mid-2021 time line is just an educated guess. I’m not an expert in these things.
The idea of a ‘bubble’ has been mentioned in these pages and elsewhere recently. It warrants a thoughtful study of its own. What constitutes a bubble? How do we know we are in one? What signals tell us that it has run its course? Do bubbles exist in some market or the other at any given time? Should one be afraid of them?
In other words, how does one profit from ‘bubbles’?
These posts, more than any other that I know, try objectively to help us see the markets in short, medium and long term. That poses the challenge of riding the short term trends which may be counter to long term trend (Returns are forecasted to be sub par over the coming decade).
Is there still time to get on the short term train? Yes, judiciously.
Cam, are you seeing signs of distributions of shares from institutions to retail?
I’m just trying to reconcile the rising odds of a Biden presidency and the market that does not seem to be paying attention to that.
No signs of institutional distribution but their moves tend to be glacial
Sanjay – Perhaps a rising market signals lower odds of a Biden presidency, and the voters/ pollsters don’t seem to be paying attention to that.
https://www.yahoo.com/news/says-total-lockdown-possible-countries-150213663.html
More bad news seems on the horizon.
My sister in India is a distinguished medical professional as a clinician, researcher and teacher. Her opinion of WHO is very poor. Personnel get appointments more on political connections than true merit.
I mostly disregard their prognostications. Like many others, their handling of the crisis has been abominable.
Sure, the WHO may be very political, but not all what it says is always wrong.
Europe has already closed its borders to US travelers in an attempt to stop new infections from taking place.
NZ is 100% locked down to non-Kiwis. Nations are in a different stages of control and those like NZ, as an example will close borders to protect themselves. This is a form of nationalism and will be devastating to international business.
Europe, in general, could not get out of it’s own way even before Covid-19. ‘Old Country’ charm is their main attraction and product in summer. Shutting the borders will hurt them more and may help US by keeping consumer dollars at home. NZ – same thing.
Nationalism will impede global trade and restructure supply chains. Who benefits? Picture is still too muddy but US should do reasonably well. IMO.
Ravindra
Thanks for the update. Does your esteemed sister think this pandemic will continue and worsen?
How long does she think will it take to get a vaccine, years?
Worth looking at the top 2-3 charts.
Just 17% say they are ‘proud’ when thinking about state of the U.S.
Only 12% satisfied with the way things are going in the US.
https://www.pewresearch.org/politics/2020/06/30/publics-mood-turns-grim-trump-trails-biden-on-most-personal-traits-major-issues/
7.1.1.1.1. D.V.
It is not under control in India. Her opinion is that it will take a while – surely not before a vaccine is widely available.
Vaccine – human trials are long and require patience and a little bit of good Luck. Her hope is second half of 2021.
Thanks Ravindra.
If we go back to Cam’s earlier statement(s) re the wisdom of crowds, then why is so much time and effort spent trying to prove the market is wrong?
(a) The market plunged -35% straight down in less than two weeks in March. I think that’s when the market quickly and decisively discounted the bad news we’re hearing now.
(b) The indexes have since staged a recovery just as quickly and decisively. What’s the market saying about the future?
I just don’t see the point in concluding that investors/traders who bought into the retracement are in a precarious position, and that it will end badly for them. How do we know that?
Personally, I don’t really buy the “wisdom of crowds.” There is value in collecting the wisdom of somewhat-informed diverse individuals and using that to arrive at a reasonable close estimate. I will have no clue of the weight of an ox or an elephant.
In the example Cam cited, people who visited a cattle fair are likely farmers and would know something something about the weights of oxen. They were informed and even experts in this particular experiments.
The market knew about the virus in Dec 2019. Cam wrote about it several weeks earlier. The market should have swooned earlier as the virus was raging in Italy and Spain, and should have known that it is a matter of time before it arrives to our shores.
And then it recovered so swiftly. If the market is already looking ahead 6-to-12 months, was there any point to this deep plunge? It should have been been looking ahead in March and would have never corrected to the extent it did.
I think the plunge was all about emotions (greed and fear) and market structure (e.g. vol-based investing strategies), and the recovery because of the Fed and Congress actions.
Cam,
Be careful looking at the Shanghai market as it doesn’t trade like ours, but more like a natural gas futures contract. Looking at the period from 2014 into 2015 most of the stocks in that market moved limit up (10%) without trading.
I understand one stock was lock limit up for 32 consecutive days and not one share was traded.
When it finally traded it was at (1.1) raised to the 32nd power or 21.1 times the previous price.
I don’t think we can trust the infection rate entirely. There seems to be tremendous political bias in the reporting. And the infection rate is now targeting younger people. I read that in Texas the average age if the recently infected is 21 yo.
The only statistic that does not lend itself to political bias so much is the death rate. Of course it lags the infection rate but it is the only possible true indicator of the virus’s real current pandemic effect.
The market is telling us that the current state of the pandemic is not as bad as the press is making it out to be. Keep an eye on the daily death rate. If it doesn’t start to climb dramatically soon then the worst may be far behind us.
https://www.nbcnews.com/health/health-news/coronavirus-deaths-united-states-each-day-2020-n1177936
Careful Wally. The second peak in deaths may be ahead of us!
May be. That’s why I said watch the daily death rate. If it doesn’t start rising dramatically we know things aren’t as the press is portraying them.
Sure, I see what you are saying.
Wally, the death rate won’t increase dramatically because as you say the new infections are among the young.
Wally, we should be concerned about the people who got infected but survived the disease. Some of them may still suffer long-lasting debilitating health issues. We will be hearing about those in coming months and years.
https://elemental.medium.com/official-covid-19-statistics-are-missing-something-critical-155e1e153a2f
https://medium.com/the-atlantic/covid-19-can-last-for-several-months-c3391bddbe6c
https://www.yahoo.com/lifestyle/coronavirus-deaths-long-expected-turn-144458387.html
https://www.yahoo.com/news/antibody-tests-around-world-suggest-192700155.html
No antibody, means no protection, means more QE, more economic malaise and uncertainty.
US deaths per 1 mill inhabitants made a big jump yesterday, from 389 to 415. (Nota bene those countries that got to this level flattened the curve only after taking exceptional measures.) The “daily new deaths” 7-day moving average curve is now slanted upwards. This is happening only three weeks after the infection number began moving up again. Four weeks from first diagnosis to death however is normal.
The argument from the Superspreader-in-Chief whereas only infections but not deaths are growing, seems to be moot at this point. We’ll see. Everything might get better soon, who knows with this crazy virus. But any rational investor needs to plan for a scenario where the US is headed towards 500k deaths. When investors say “Corona is a hoax”, or “death statistics are manipulated”, it smacks of desperation, and should be considered a counter interdicator.