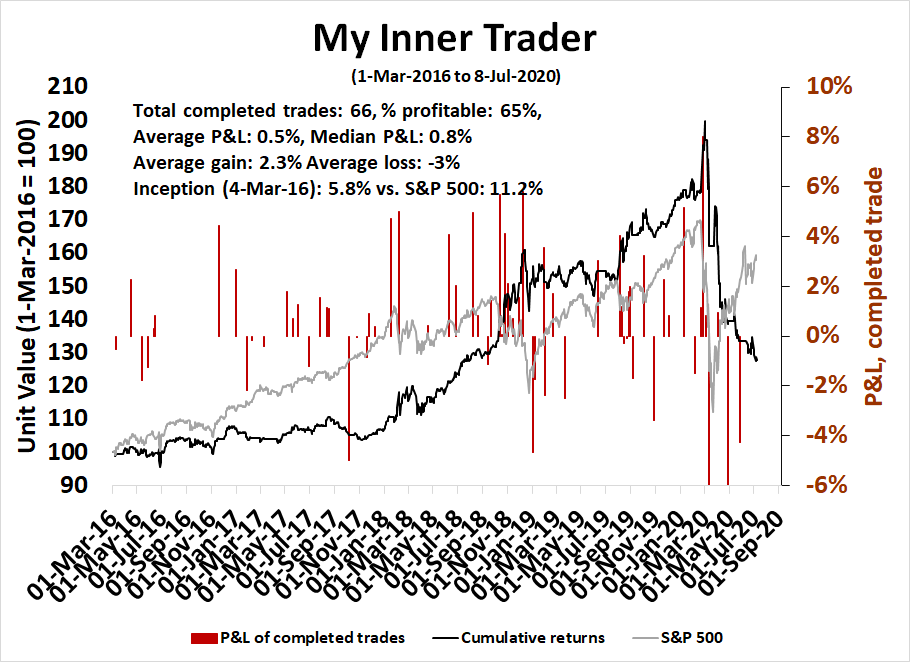
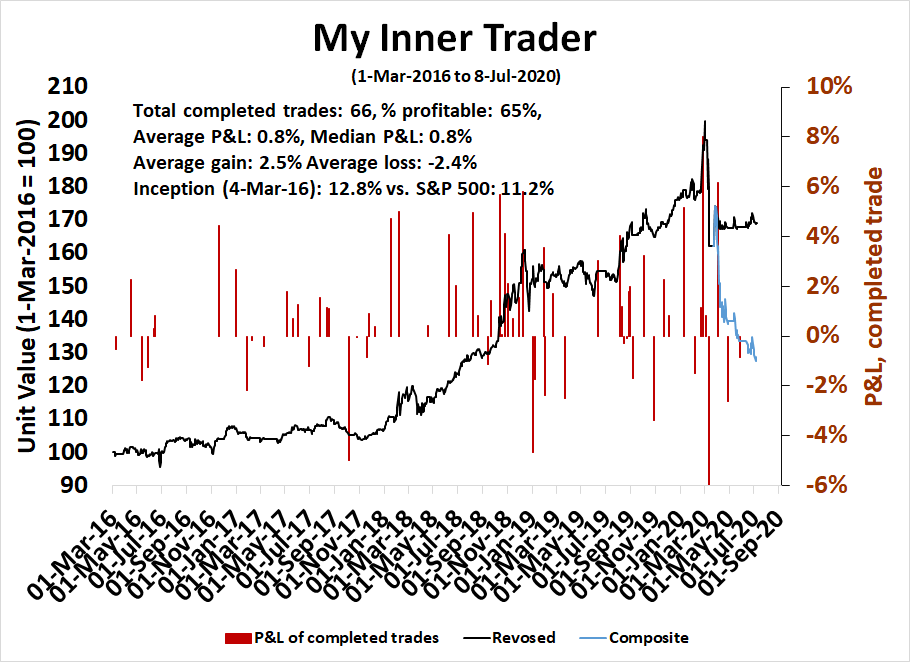
Mid-week market update: To paraphrase Emperor Hirohito when he broadcast the Japan’s decision to surrender in World War II to the nation, “My inner trader’s returns have not necessarily developed to his advantage in 2020”. While the trading system was correct in spotting the major downdraft this year and the initial recovery, it was wrong to stay short as the market rallied.
With that in mind, he has gone back to the drawing board and analyzed the three key elements of the current market.
- Conventional macro, fundamental, and technical analysis.
- The bull case, based on a flood of central bank liquidity, and skeptical sentiment.
- An analysis of how market regimes shift, and what to do going forward.
Conventional analysis
Here is how conventional analysis has played out. I don’t want to sound like a broken record, so I’ll just summarize my views. It’s difficult to believe that the stock market could just stage a brief sharp pullback and recover so quickly in the face of the second worse recession of the last 100 years. By many measures, the magnitude of the Covid Crash on the economy has only been exceeded by the Great Depression.
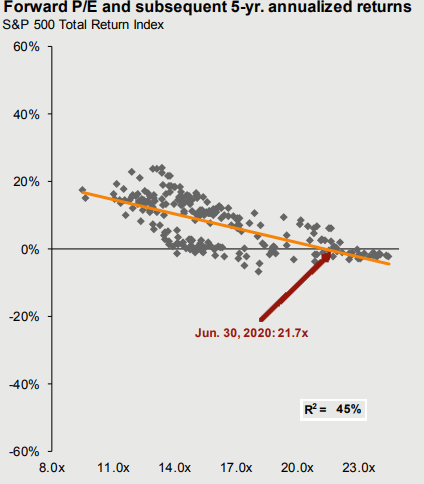
I have voiced my concern about equity valuation for some time. While stock prices are less predictable in the short run, the long-term equity outlook appears dismal owing to the stratospheric forward P/E ratio. Even if investors were to look ahead to 2021, the FY2 P/E ratio is about 19, and could be in the 20-21 range if Biden were to win in November and enacts his tax proposals (see Fun with technical analysis on the 4th of July).
In the short run, the trajectory of the recovery is also stalling. High frequency economy numbers are pointing to a plateau and retreat of the recent economic recovery (see Why there is no V).
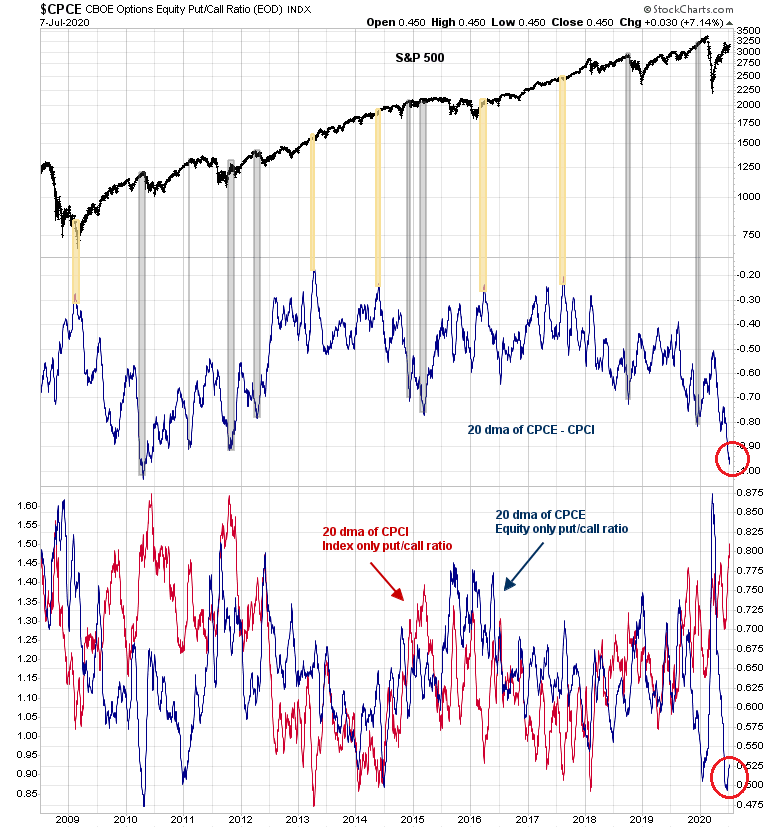
Market sentiment looks stretched. One example often cited is the extreme low in the equity-only put/call ratio (CPCE). Equity options are mainly used by individual stock traders to take positions (dumb money), while index options are mainly used by professionals to hedge their positions (smart money). The spread between CPCE and the index put/call ratio (CPCI) is another warning sign for equity prices. Past episodes of similar extreme readings have seen stock prices either stall or correct.
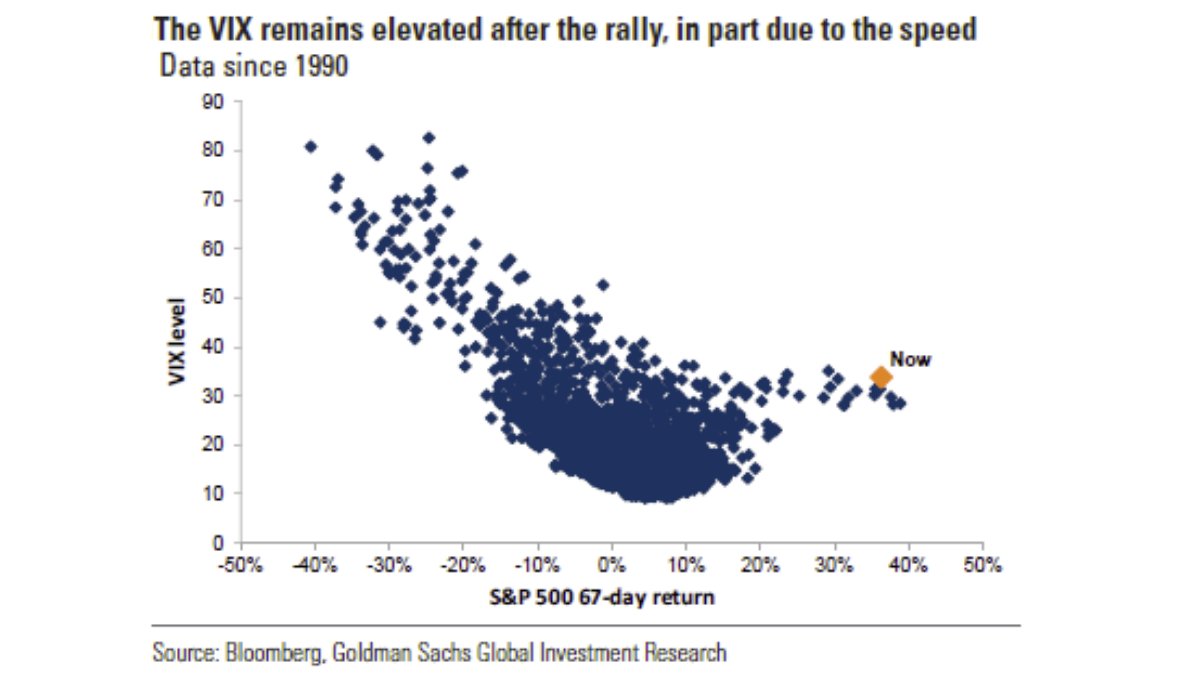
Implied volatility is elevated despite the recent stock market rally. Goldman Sachs documented a disturbing divergence between the VIX Index and past returns. The high level of the VIX either makes the market vulnerable to a pullback, or a volatility spike. To be sure, rising volatility can be bullish. Stock prices can either crash or surge higher. Keep in mind, though, that stocks are historically inversely correlated with the VIX, and rising VIX usually means lower stock prices.
The Fed bubble
The bullish view is anchored by the belief that central bank liquidity is propelling stock prices upward. Famed hedge fund manager Stan Druckenmiller recently said that he was humbled by the market. He turned bullish and explained that he had underestimated the impact of the Fed’s flood of liquidity on the market. What is less known is how Druckenmiller learned his trading process from his first mentor, Speros Drelles.
I recently wrote about the “wisdom of the crowds” in Fun with technical analysis on the 4th of July. There is a second level to that story about the independence of views in the crowd, and herding.
- A diverse crowd will always predict more accurately than any individual.
- A crowd is usually smarter than even the best analyst.
- But the crowd’s predictive ability depends on the diversity of views.
Drelles taught Druckenmiller that traders should be trend followers when there’s a lot of disbelief about the trend, and contrarian when the trend becomes the consensus view. That’s where the art and the science of trading comes in. Mechanical trading systems only gets you so far.
Are we near such an inflection point in sentiment? Strategist Ed Yardeni recently threw in the towel on valuation as a metric:
From February to the end of June, total assets held by the three major central banks (ECB, Fed, BOJ) soared $5.6 trillion to a record $20.1 trillion — with the Fed now holding over $7 trillion, data from Yardeni Research show. …. The big picture: Value metrics like P/E ratios must be re-evaluated in light of the current situation, Ed Yardeni, president and chief investment strategist of Yardeni Research, writes in a note to clients. “What should the forward P/E of the S&P 500 be when the federal funds rate is zero, the 10-year US Treasury bond yield is below 1.00%, and the Fed is providing plenty of liquidity to facilitate the resulting rebalancing from bonds to stocks?”
This quote is from our Morning Briefing today, which concluded: “Notice that we didn’t ask what the ‘fair value’ of the forward P/E is, which would imply that the market operates freely enough—unaffected by Fed interventions—to determine that value. Clearly, that’s no longer the case. Frankly, we don’t know the answer to this question, since there is no precedent for the current situation. However, we do know that prior to the GVC, we all thought that the S&P 500’s fair-value P/E was around 15.0. Could it be double that now? Maybe.”
You tell me. If this is a late 1990’s style market bubble, then Mark Hulbert believes that sentiment is far from irrationally exuberant. In a WSJ opinion piece, Hulbert came to that conclusion by citing the work of Malcolm Baker, of Harvard Business School, and Jeffrey Wurgler, of New York University. The academics analyzed these factors for signs of irrational exuberance.
- The low number of IPOs, and the low level of first day IPO returns;
- The low level of equity funding activity compared to borrowing, as bubble style valuations would encourage companies to tap the markets for cheap equity funding;
- The valuation spread between dividend paying (mature) companies, and non-dividend payers; and
- The low average closed-end fund discounts to NAV.
Based on these metrics, Hulbert concluded that today’s market mood is nowhere near the giddiness of the dot-com era. If this is the start of a bubble, then the bull has a long way to run.
On the other hand, Bloomberg reported that long/short hedge funds are closing their doors because the short side isn’t generating alpha, and it’s creating an existential crisis for hedge fund managers.
The closures reinforce the bruising reality that such funds have captured most of the market’s downside in recent years, but very little of the upside. They also beg the question: If the arrival of a deadly pandemic that’s pummeled the world’s economies can’t work in short-sellers’ favor, then what can?
“The existential crisis is real,” said Andrew Beer, founder of New York-based Dynamic Beta investments. “This is not a new phenomenon, but has gotten worse over time. When markets go down, hedge fund stocks go down more.”
This sounds like capitulation by the short-selling crowd that marks the end of an advance.
A new framework
These contrasting views begs the question of whether an investor should adhere to the traditional conventional style of analysis and exercise caution, or jump into equities with both feet because of the global central bank put is creating a market bubble.
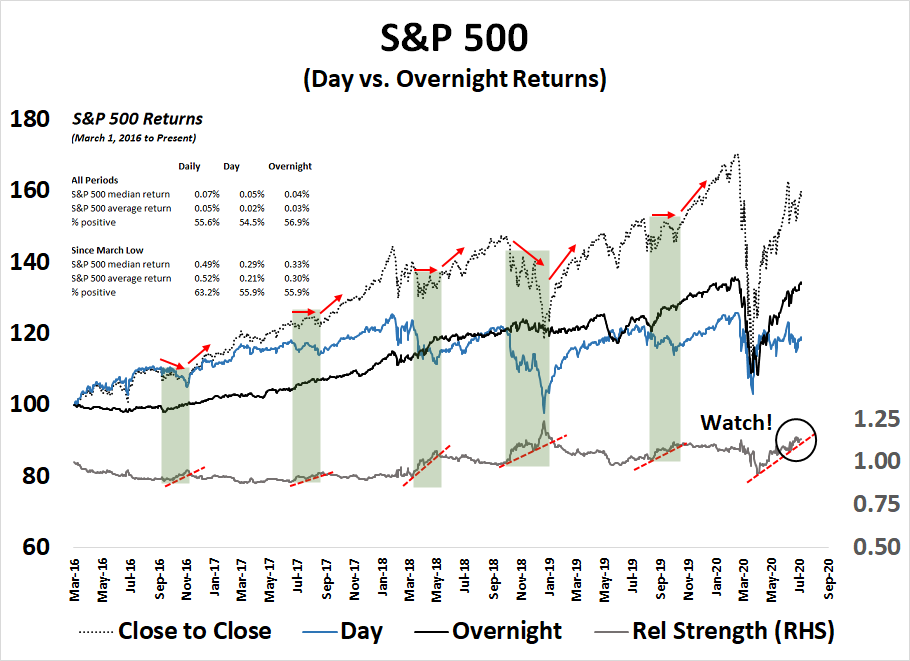
My tactical trading analysis yielded an important insight. I noticed that the most of the market gains came from overnight market, which was painful when my trading account was short and could not react. This is an indication that the market was moving on news that hit the tape after the market close. I went on to study how the market performed during daylight hours when the market was open, and the overnight market, from the close to next day’s open.
The results were remarkable. Most of the gains from the stock market’s rally since the March bottom came in the overnight session (black line), while the daylight sessions (blue line) were mostly flat. In addition, the market has gone through several periods where the overnight to day ratio (grey line) had trended up, which I characterize as jittery markets driven by unpredictable news. Past breaks in this ratio saw a marked change in market behavior. The market changed from either a falling or sideways market to one that trended upwards. In the most current instance, the market is trending up, and I would expect a ratio trend break to signal a change to either a corrective or a sideways and choppy consolidation.
Equally remarkable are the characteristics of the market since the March bottom. The percentage of days that the market was positive was identical at 55.9%, but the average and median returns of the overnight sessions beat the daylight sessions.
I conclude that my inner trader needs to focus on regime change dynamics by watching for a break in the uptrend in the overnight to daylight ratio.
When I focus on trading performance, the recent uptrend in the overnight to day ratio coincided with the return drawdown. The trading systems was affected mainly by overnight news to which the system was unable to react.
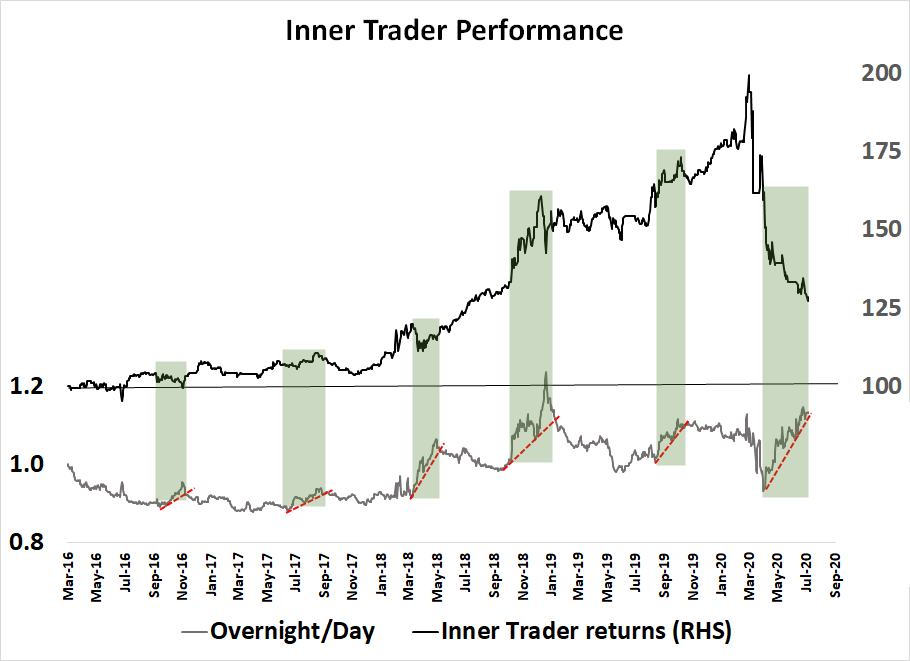
While this is not meant to be an excuse, or one of those backtests that work well in the lab but not necessarily in real life, this chart illustrates what would have happened had the same trading signals been only applied to the daylight hours, and the trading system went flat to cash overnight. This is meant purely as a proof of concept of my regime change analysis. The trading system would have been choppy but flat during this period, compared to the skid had it held the mainly short positions in both daylight and overnight sessions.
What’s next?
So what are the takeaways and action items in light of this analysis?
First, the market has undergone a regime change since the March bottom as it has become extremely headline sensitive. After-hour news events have moved the markets overnight, and the overnight e-mini futures are thin, and may be problematical to trade for some participants. Good investors and traders don’t get better without acquiring scars. This latest drawdown is the scar tissue that helps me improve my investment and trading process.
This regime shift creates a dilemma for my inner trader on how to trade this market. It’s one thing to attribute lack of performance to a regime shift, it’s another to create a rule, or a set of rules, on how to react to the change, and when to change back.
One course of action is to step to the sidelines until the overnight to day rising trend breaks down. That would be an advisable course of action for many who follow my inner trader’s signals.
The other course of action is to continue trading, but only follow the trading signals during daylight hours. This means closing out the position at the close, re-entering the position at the open, and staying in cash in the overnight session. This approach involves high trading costs. The biggest component of trading cost is the uncertain execution slippage, defined as the difference between actual price executed and the reported opening and closing prices, as well as commission costs. For measurement purposes, I will begin to report my inner trader’s trading starting tomorrow (July 9, 2020) until it is evident that the market regime has returned to normal.
Tactically, I am inclined to maintain my short trading position (during daylight hours) and put a stop loss order just above the top of the island, as per the primer outlined in An island reversal update.
Good luck, everyone.
Disclosure: Long SPXU (daylight hours only)
I have been day trading only…selling SPX option spreads on Mon,Wed & Fri…i just have to pick a zone that i think the market will not breach..it seems to work.
Per Marty Zweig “Don’t fight the Fed”.
I’m not sure what “not fighting the Fed” means.
When the Fed began to taper its QE purchases and later reduced the size of its balance sheet, the market continued to rise. Did “not fighting the Fed” mean you should have shorted the market then?
Hi Cam,
I bought a VERY small amount of SPXU @ 11.52 for fun, should I sell it now? Since, we should not hold it overnight?
Thanks
I can’t really tell you what to do because I know nothing about you. As I detailed in the post, holding a short position overnight isn’t a great idea these days. Either step to the sidelines or only hold the position during daylight hours.
Cam, Stan Druckenmiller said he was humbled by the market as he didn’t participate in the upturn. I can’t find anywhere that he stated he turned bullish . I believe you are making an assumption .
If you read between the lines Druckenmiller flipped bullish
Cam: I think you should incorporate a short term trend following moving average with your analysis. A simple 10 or 20 day moving average of the lows would have captured this whole move. The idea that you have to be right at the exact top is extremely difficult if not impossible.
Also, some traders hold positions overnight because if they are with the trend the easy money is made.
Cam, you seem to be bombarded with question on your new analysis. I’m sorry to just into this fray but I need further clarification on how you arrived at the expectation that the market would go down/sideways once the regime change happens.
You said:
“…the market has gone through several periods where the overnight to day ratio (grey line) had trended up, which I characterize as jittery markets driven by unpredictable news. Past breaks in this ratio saw a marked change in market behavior. The market changed from either a falling or sideways market to one that trended upwards. In the most current instance, the market is trending up, and I would expect a ratio trend break to signal a change to either a corrective or a sideways and choppy consolidation.”
Looking at the past examples of a trend up and then a trend break of the ‘ratio’ show as it trended up the market usually was falling or choppy and as the trend broke down, the market became bullish. How did you arrive at the conclusion that this time the market will go down to choppy when the trend breaks down?
I came to that conclusion that the market would change direction when the current phase ends. In the past such phases occurred in either sideways choppy markets or falling markets. When the phase ended the market rose.
This phase is occurring in a rising market. I conclude that when the phase ends it will resolve in either a sideways consolidation or falling market.
OK, Cam. Thanks. I will go with that.
All, when you have a minute kindly look over in “Discussions” for a new post “Validity of the PE ratio as a valuation metric”, posted there so it will survive longer. It’s a thought experiment to get to a “fair-value” market PE of 30, per the Ed Yardeni quote in Cam’s post. Your thoughts? Thanks.
Cam-
The points in your post that I’m able to extract, and that also resonate-
(a) ‘Drelles taught Druckenmiller that traders should be trend followers when there’s a lot of disbelief about the trend, and contrarian when the trend becomes the consensus view.’ Agree, and perhaps that’s where you’re able to read between the lines and conclude that Druckenmiller is bullish.
(b) ‘Most of the gains from the stock market’s rally since the March bottom came in the overnight session.’ I seem to recall that it’s more than a recent phenomenon – it’s almost the status quo, which underlies much of the outperformance of buy-and-hold when compared with active funds.
(c) ‘Based on these metrics, Hulbert concluded that today’s market mood is nowhere near the giddiness of the dot-com era.’ Absolutely agree. I was an active trader during most of the Nineties, and if asked would characterize current sentiment as the diametric opposite of what it was then.
IMO, the contrarian trade is to be positioned long. There’s something off about sentiment surveys that tilt bullish – fund outflows (ie, what investors are doing with their money) don’t seem to support that view. What would it take to turn your inner trader bullish?
Druckenmiller was bullish, but who knows how he is positioned today. As I pointed out there is an art and science of discerning psychology. I can’t tell how far we are at the end of the trend, but there are some indications that point to a crowded long, and some that do not.
Agree, this is a trundles market. Today’s intraday pullback shows the market is nervous. The rally thereafter was not very convincing.
Delete the first sentence.
From trading perspective:
1. If the overnight market is bullish and the day market choppy, one must consider getting long SPXL at close and closing out at open. Or, long SPXL overnight and long SPXU during the day.
2. This begs the question of why not follow the trend?
Momentum has been proven to be the dominant factor of investing.
3. ‘Bubbles’ is generally used in a negative way. What defines a bubble? Usually when fundamentals and valuations don’t make sense based on historical analogs. That is the nub of the problem.
4. I think there is the market and there are markets within the market. For alpha, why not focus on sub markets doing well?
Just saying…
I had considered going long in the overnight market, but I thought that it would introduce an unwelcome level of complexity for readers.
Not everyone has the same level of sophistication.
Thanks, Cam! This dichotomy in performance is interesting and it will work till it doesn’t.
I would suggest anyone thinking of buying the close and selling the open to do a study first- it will show that although it has a profit factor of 1.22 and 54% profitable in the last 4 months, there is too much losses sometimes giving up a 12% overnight drawdown. The proper way to do this is to put a filter on the trades and you could end up with a simple strategy a lot fewer trades with a profit factor of 4.8, 62% profitable and more importantly a 1% drawdown max in the last 4 months. The trades will look something like this. If there is interest, I will post the code. https://i.imgur.com/Z2ZNEgB.png
Hi Alex, I’m interested in the code could you share it please? Thanks.
Sure Benny. The Tradestation Easylanguage code text link is https://textuploader.com/1gnik as it is hard to post code here without code box support. The premise for the filter for the strategy is based on Gerald Appel’s 10 week relative strength of Nasdaq to NYSE. The code is also popularized by Rob Hannah. The ratio NYSENASRatio depends on the selection of data1 and data2
which could be NYSE for data1 and Nasdaq for data2 but it works better when you can select the optimum pair for the time period you study.
Thanks for sharing. Seems like a stats arb trade. Is it safe to assume the choice of data2 could be anything that’s closely related to SPX but with higher beta? Will do more tests on it once I get a hang of programming.
Cam it is quite possible that tomorrow the market crashes. However, it does not negate the fact that this not an intellectual exercise. Rules are paramount when money is on the line. Having seen bubbles in gold, silver, oil and dot com one has to except the fact the market is always right. Excesses develop because of conviction and mass hysteria. The only way to survive is to have strong discipline. Go with the trend or be flat and always use stops which are not mental stops but are in the market. A strategy devoid of this simple fact will lead to inevitable failure and disappointment.
The Fed has basically stated it will do whatever it takes (as Draghi did many years ago). So it’s not mass hysteria – more along the lines of a reasonable response to stimulus. Is the stimulus ‘excessive?’ Not when viewed in the light of a global shutdown in response to a pandemic. They’re pulling out the stops, and rightfully so. Keeping the markets afloat isn’t the same as keeping the economy afloat – but it’s something. If we were to ask the Fed for an honest answer, it may come down to ‘we’re faking it until the country makes it through.’ I don’t thnk anyone really knows what they’re doing – nor do I necessarily expect them to know.
https://www.yahoo.com/news/as-covid-makes-a-comeback-so-will-lockdowns-192135076.html
Watching this space.
https://www.yahoo.com/news/churches-were-eager-reopen-now-120612082.html
Ohio has made masks compulsory in some counties, though religious gatherings are exempt!
President wants to open schools in the fall which would likely become a great source of transmission (to parents and community) of Covid19, as children with infection may be minimally symptomatic or completely asymptomatic.
Not good.
http://begthequestion.info/
Continuing widespread abuse of ‘begs the question’ suggests the question: ‘Why even point it out?’ Good question.
For a very news- and policy-reactive market, let’s not forget that the new tax deadline is July 15th and the $600/week unemployment payments end July 31st.
The IRA money should keep the market afloat, for some time. Agree.
Lot of cross currents. That said, earnings matter and they are going to be bad. Let us watch the “guidance”.
…and the PPP application deadline is a week later. Seems like the busy 3 week period coming up that will impact consumer and business confidence.
https://twitter.com/LizAnnSonders/status/1099397052486877185
Read it and the comments which will answer most of your questions. Of course overnight sessions were when PPT went to work and saved the market and made overnight shorting very painful because of gap-ups.
Thanks for posting this. This idea has also been critiqued on by Urban Carmel and is not new.
Right. Thanks for confirming. Since 1993 – the strategy has worked for 27 years!
I guess I am missing something. Why is this so surprising?
Most market-moving news (e.g. earnings releases, major business news, etc.) are released either before or the after the market closes.
On your Inner Trader Chart performance presented above, please re-post but label more clearly the go to cash overnight line. I presume it is the lower part of the chart but I want to be sure. No increased trading costs w the free trades at all the brokerage houses.
Is that a bull flag on the SPY chart?
Is it?
I don’t know, but I like the fact that the SPX closed 36 points above the intraday low.
Time to bury the myth that Robinhood is “too small to matter”
https://twitter.com/MacroCharts/status/1281181305829568513
It is not the small traders, but professionals who are pinching their nose a buying. Cam pointed this out, watch what the professionals are doing, not what they are saying.
That said, the goal is to buy when thing are cheap. By many metrics, things are expensive.
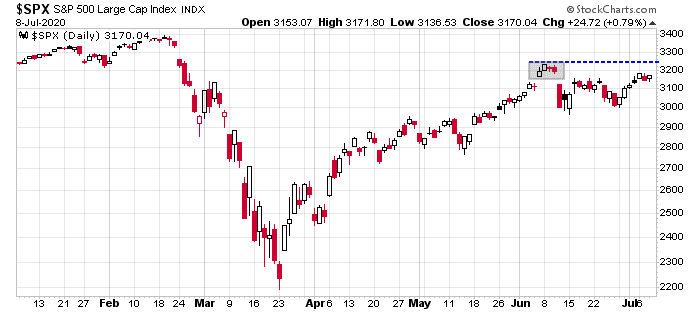
The S&P is still within the island formation. It is encouraging for short positions to see the intraday low today reach 3115, the lowest intraday in 6 trading days.
As for Mr. Hui’s new shorting strategy, I place that in the same category as Druckenmiller’s recent partial capitulation. In short it is contrary bullish. However It is technically correct that the majority of points gained in this bull run occur between the previous day close and the following day’s open.
I suspect the market will tend to the downside waiting for new stimulus action from either the Fed or the Congress.
Of Interest from Birinyi Associates — “There were 25 new authorizations [stock buybacks] announced during June for a total of $2.51 billion, 98% lower than June 2019 and the lowest total value of authorizations since May 2009.”
https://ritholtz.com/2020/07/june-2020-stock-buybacks-down-98/
even then market does not tank!!!
Cam, with your shifted positioning, do you still see the SP500 hitting the 1500 region?
Much depends on what happens over the next 6-9 months.
Best guess is the recession, even if there is a double dip, would be over a year from now. Markets look ahead at least 6 months, so if we don’t go down, then I would have to revise my outlook.
If we are in a bubble, all bets are off.
Who are these magic people who can move the whole SP500 overnight? Does it cost a lot to do that or is it easily done?
Futures traders, (=trading on thin ground (low volume of trades).
is this the kind of thing the Plunge Protection Team might play around with?
No.
S&P 500:
Today’s intraday low 3109.
Today’s intraday high 3184.
Today’s close 3152.
This is what one would call a doji, right between the range.
The 3109 has had held on for the last week. This is neither bullish nor bearish. Wait and see what tomorrow brings.
3075 is probably the line in the sand tomorrow on the downside. 3020 should be good support for traders, 3050 being somewhere one should watch for intermediate support.
Break below 3075 would be scary. Will be attaching after 11 pm tomorrow.
Be careful!
11 “AM”
Peter Brandt is expecting the 5-year yield to reach minus 15bps.
https://twitter.com/PeterLBrandt/status/1281356865755119618
Not surprised! Keep buying gold.
In that case, also buy long bonds.
Agree, the whole yield curve comes down. Beneath the surface, let us watch 10 year treasury yields for now around 0.615%. A break below is bearish for stocks.
Gold is already quietly breaking out, past 1780 or so.
On the opposite side, Junk binds are still not selling off (JNK, HYG).
Peter is not expecting the long-end to decline much.
“Maybe 30-yrs might drop to 2.5%.”
https://twitter.com/PeterLBrandt/status/1281359102892015619
The market is very narrowly range bound for now.
2. On the top of the range is high valuation. This is not a cheap market by any means.
3. Plenty of indications are there that we may be heading into a rocky summer.
4. Why buy now when market is expensive? There is no great compulsion.
5. Beneath the surface, there is a FOMO, but many bearish factors are there (rally in gold, retail bankruptcies, Covid increasing, States looking to shut down, Geopolitical tensions rising, Municipalities bracing for bad news, Oil pulling back again today, very narrow leadership (FAANG only rallying), CNN fear and greed index in the neutral range, a summer of discontent, and embattled Presidency).
The Democratic incoming presumed nominee is already telling of increasing taxes.
Does that tell you risk to reward is tilted towards favorable odds?
http://scottgrannis.blogspot.com
Here is the contrarian argument from Calafia Beach Pundit. While Scott Grannis is right, I would still like to see a scary flush out, (in the next quarter), to 2500, with VIX rising to say 50 plus.
Scott Grannis is right, provided we do not get another shut down. I am somewhat skeptical that we get a straight line rise in the markets. I do not believe this is how the narratives work.
Cam,
Thanks for all your insights
I’ve also been beaten up by this overnight = over performance phenomenon. Started closing short positions either during or at end of day.
Also switched my main focus to shorting Russell 2000. Tech components of $SPX seem to keep holding it up. Russell short looks more correlated to Main Street economic conditions
Best of luck & thanks again!
What’s the magic number for breaching the moat around that island, and do we need to close above in order for it to count?
Top of the island is 3240. Yes, watching for the close.
OK, thanks.
https://www.thedailybeast.com/south-carolinas-coronavirus-outbreak-is-worse-than-most-countries
“South Carolina’s current surge of cases is so bad that it’s now one of the top three worst coronavirus outbreaks in the world. In a New York Times study of the number of daily infections between June 28 and July 5, Arizona and Florida are the two most impacted areas in the world—followed by South Carolina, the kingdom of Bahrain, and Louisiana”.
“On April 24, McMaster was one of the first state officials to begin loosening coronavirus restrictions, announcing an executive order that allowed most retail and department stores to reopen with social distancing. The order came only after three weeks of “actual closure,” one Charleston ER doctor said”.
“At one hospital in Charleston, emergency-room nurses are recycling used N95 masks as doctors in other departments pitch in to staff COVID-19 units. At another, shortages have forced health-care staffers to work unprecedented overtime. All told, more than 75 percent of hospital beds are already occupied across the Palmetto State—and the tidal wave of new coronavirus cases is only growing”.
April 24 to 11 July, is around 12 weeks, give or take. This is how long it takes for the system to get overwhelmed. Several large US states are behind South Carolina which is an index case of a rebound in Corona virus case, and eventually deaths.
Deaths will rise. no doubt it. It is a matter of time. I remain highly skeptical of the idea that reopening the economies without a vaccine or a drug that saves lives is the right recipe.
The US could enact another large stimulus that may last another quarter to buy time, but what thereafter?
The market is trapped in a range. We may get a FOMO dash to 3250, but all said it looks very risky. Somewhere along the summer we could get another jaw jarring ride down.
Stay safe.
https://www.yahoo.com/finance/news/joe-bidens-tax-plan-may-wallop-the-stock-market-heres-one-disturbing-estimate-173751982.html
“It [the Biden plan] means that stocks — all things being equal — would be lower by 25% than they are today”.
https://www.yahoo.com/finance/news/tcs-ceo-warns-ignorance-trump-081955312.html
Chinese products are under a shadow, the trade deal probably unravels.
The US is on a collision course with destiny.
One day we will look at this, and think it was all so glaringly obvious. As one does after ever Tulip mania…