Mid-week market update: Remember the island reversal? The market gapped down and skidded last Thursday after Wednesday’s FOMC meeting, creating an island reversal. It opened down on Friday, but managed to close in the green on the day. And it has rallied back to the bottom of the gap this week.

Have the bearish implications of the island reversal been negated?
Island reversals explained
Let’s begin with a basic primer on island reversal formations. TradingSim explained the formation this way:
An island reversal is a chart formation where there is a gap on both sides of the candle. Island reversals frequently show up after a trending move is in its final stages. An island reversal gets it name from the fact that the candlestick appears to be all alone, as if on an island. A key sign of a valid island reversal is an increase on volume on both the first gap, and then the subsequent gap in the opposite direction. An island reversal formation is often attributed to news driven events that occur in the pre-market or after-hours trading.

To develop a minimum target for the reversal pattern, you “measure the distance between the lowest candle of the general price action and the lowest candle of the Island pattern”. As a reminder, this is a minimum target. The bullish reversal observed in SPY in early April overran its target.

For risk control purposes, put a stop loss at the bottom of the island, if it’s a bullish reversal, and at the top of the island, it’s a bearish reversal.

Based on these criteria, the bearish reversal remains intact, and the measured downside minimum target is about 3020.
Some perspective
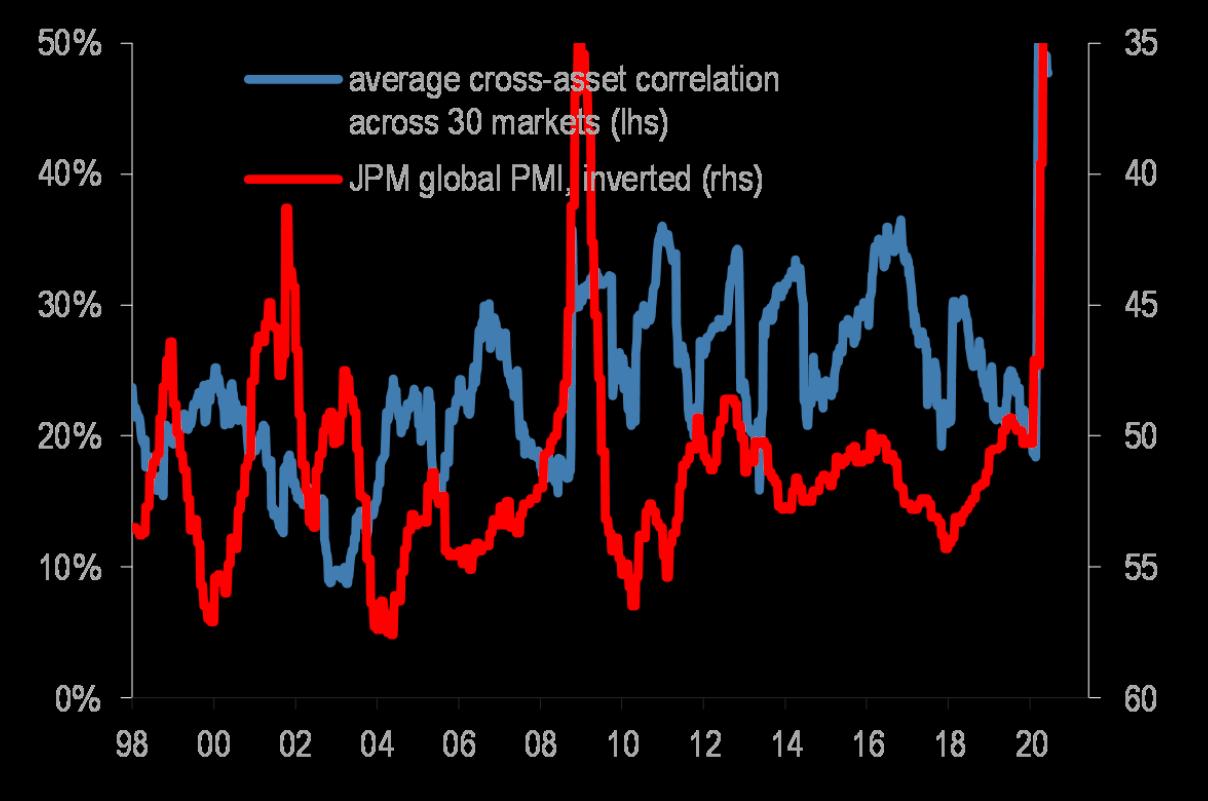
Here is some perspective on the current market environment. This is a very skittish market. Cross-asset correlation is at a 20-year high, indicating investor herding. The market has shown a pattern of reacting violently to news items.
The market looks extended from an intermediate term technical perspective. SentimenTrader pointed out that a record number of stocks are on MACD sell signals, indicating negative momentum.

Yesterday’s rally was sparked by an upside surprise in retail sales. An unusual aspect of the market reaction can be found in the behavior of the coronavirus pairs. These pairs should have been rallying, but they instead fell in reaction to the positive reopening news.

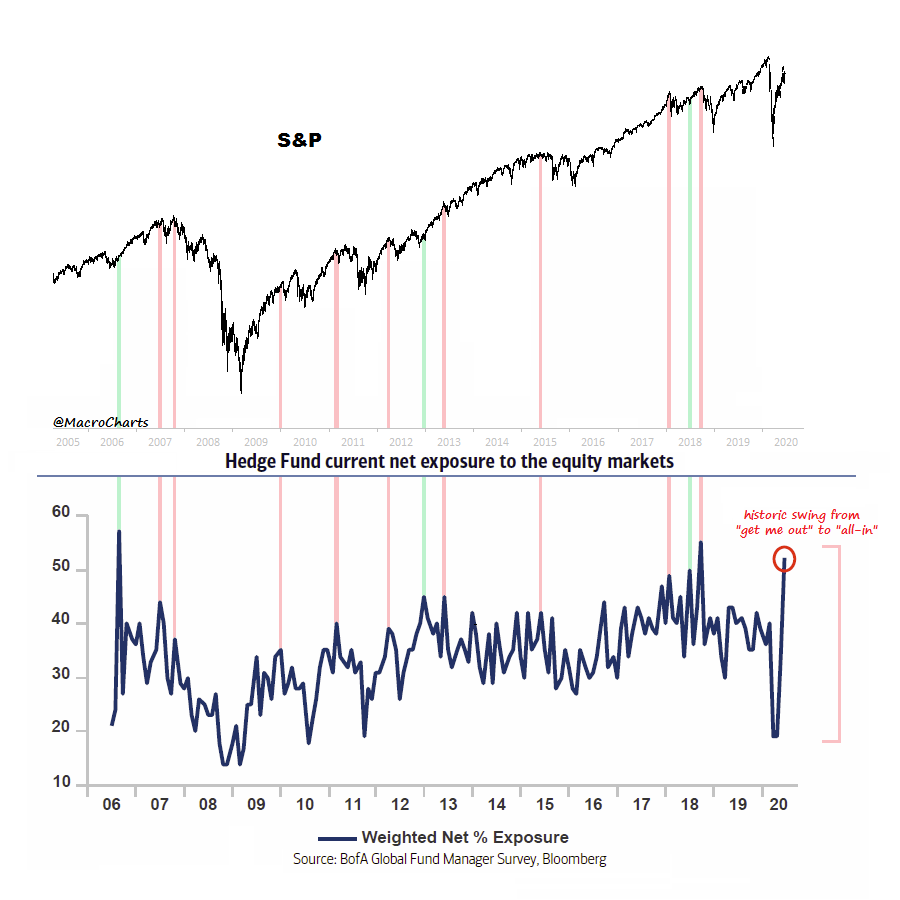
Sentiment remains a concern. The latest BoA Global Fund Manager Survey showed that hedge funds are in a crowded long in equities. Macro Charts showed that past episodes have generally resolved themselves in a bearish manner.
Cautiously bearish
My inner trader is cautiously bearish. The market appears to be rolling over after being in an uptrend. I have said before that you don’t know the strength of a bull trend until it is tested – and it is being tested now.
While short and intermediate term indicators are starting to flicker red, my inner trader is only tactically bearish for now. The SPX remains above its 200 day moving average, and all of the different versions of the Advance-Decline Lines remain in uptrends. The bears cannot be said to be in full control of the tape until those lines in the sand are crossed.

Disclosure: Long SPXU
Cam, the White House proposed a $1trn infrastructure plan. Any thoughts on that bill moving forward?
Thanks!
Lol! Remember the number of “shovel ready” projects in the past and how long it took for them to get going.
Cam – How often do institutions engage in stop-loss running, and where would you recommend placing a stop to avoid being taken out of your position just before a reversal?
Stop loss orders tend to be used by investors measured by absolute returns. Institutional investors normally don’t use stop losses. Most managers have mandates to be fully invested so they focus more on relative return (to a benchmark or competitors) than absolute returns.
That said, hedge fund managers will use stop losses, but much depend on whether the position is married, e.g. part of a hedged trade, a single position, or as part of a basket of stocks expressing a factor exposure. Therefore it’s difficult to say how they place their stops, because even HF positions are very different.
Maybe it’s unrealistic, but here’s where I would hesitate before placing a stop.
(a) I open/ add to a position in SPXU tomorrow.
(b) I set a stop loss that corresponds to SPY 323.
(c) Most players (HFs or otherwise) will have a good idea where the stops are.
(d) If/when SPY approaches 323, prop desks deploy cash to push bids higher. I’m stopped out of SPXU – just before the same funds close their new SPY positions + open large shorts.
So I would probably size down to a point that allows me to absorb an acceptable loss even at let’s say SPY 325.
I usually keep my stops tight and place them under near term support if long or above near term resistance if short. However, traders love to just break support or resistance so they can take out those stops. History has shown me that where I put my stops usually would have been a better place to put my entry orders.
Interesting, Wally. Thanks.
I place my trailing stops at levels dependent on my positions’ volatility. My intention is to be not too tight when something has a lot of noise, but not too loose for an ETF that is normally quite stable where I still want crash protection.
For instance: DIA, SPY: 10%
DDM, SSO: 20%
TLT, IJH, IWM, PSQ: 5%
Cam, thanks for the response above.
Another question. I am seeing some day traders monitor order flows and use that to track the daily movements of the indices.
I am just interested in learning the basics of order flow monitoring. Any resource?
Thanks much!
Sorry I don’t know
Sanjay, are you on Twitter? Here are some excellent accounts that cover order flows:
https://twitter.com/DoubleWideCap
https://twitter.com/Reveretrading
https://twitter.com/AheadoftheNews
https://twitter.com/apollotradingsd
Ellen, thank you very much. I will check them out.
Hope they are helpful!
I’m looking for daily stock price data for the 1926 to 1940 on an Excel sheet. Can anybody help? Thanks
The site below offers daily DJIA closing prices from 1914-present for a nominal cost of eight bucks.
https://macrotrends.dpdcart.com/
The file will be in CSV format, which you can easily convert to Excel format using the Text Wizard function under the ‘Data’ tab.
Just downloaded the data. Got it.
I’m a little worried though, if that’s the time period you’re focusing your research on 🙂
To echo rxchen2’s point, I would be wary of analyzing the DJIA from that time frame for historical clues because of survivorship bias.
100 years ago, the US was a promising EM economy, much like Argentina or Canada. Today, it accounts for slightly more than half of global market cap.
To analyze US equity performance in isolation without considering the big picture macro situation would be like analyzing a FANG+ stock portfolio since 2009 and thinking that it’s representative of stock market performance.
I hear you.
Cam, how many of the indicators on the weekend post have triggered? If majority have, then time to be cautious on trading positions, IMO.
Thanks
Any insight on the dollar? I wonder if it is fueling some of this speculative rally.
The USD is just one indicator in the universe of cross-asset signals. Everything is related, and I wouldn’t try to analyze the dollar in isolation.
thank you!
Cam, I see no mention of Fed QE (or whatever the new term is) in your analysis of the stock market. Do you just ignore what the Fed is doing and only use the things we see you talk about in your analysis?
The main focus of this analysis is mainly technical and sentiment analysis.
That said, keep in mind the market’s purported reaction to the Fed:
1) It cratered last Thursday because Powell “wasn’t sufficiently bullish on the economy”
2) It rose this week because the Fed announced it was buying individual corporate bonds, which is a decision it had already announced before.
What’s the real reason for the market action?
Thanks, Cam.
OK. Thanks, Cam.
In the futures markets, we are at 3083 (-34.75). There is a minor support around the 3075 level. That said, 3150 seems like a level to sell if there is a reversal here (already buffeted back twice). 3150, give or take is also the top level of the island reversal (see last Thursday). These numbers are of futures, not of SPY, but there is a correlation between the two.
Yes, a systematic stair step, sell off has started in the futures markets. I wish I had a way to post graphics on this platform. Massive resistance at 3120. We were at 3150, at 5 PM earlier today and now at 3078!!!!
Like I wrote earlier, Cam nailed this call to short at 3180, give or take.
Thanks Cam for your analysis, Appreciate.
My friends, those who do not trade futures, there are free platforms where one does get futures prices with ten minute delay. FYI.
A familiar source for the S&P500 Futures:
https://finance.yahoo.com/quote/ES=F?p=ES=F
Thanks. There are others too.
I use the Bloomberg app available in the Playstore
Seems like a lot of the frothiness is driven by pajama traders overnight in Asia and Europe piling into US equities. Given Fed intervention do you see US futures/ equities continuing to be attractive space relative to other investments Cam?
Cam’s 3020 Island “bottom” is also the level which marked from where the breakout high circa fall of 2019 took off. This seems like a very very important level, also close to/@ 200 dma. There was a triple top at this level before the break out, and hence its importance. I am watching this level very carefully for long term capital allocation (??).
We just found support at this level in the last sell off. That said, the countertrend rally took us back to 3150, and failed. This was an incomplete rally which is usually what one expects in an evolving BEAR market.
We have been buffeted back from 3150 twice in the last few days. I am watching this range. Stay safe!!!!
There is nothing canonical about 3020 and a further down leg from this level is not completely out of the question. Let us put a -10% from 3150 (2835) as the next level for support.
Sorry, these numbers are all in the futures of S&P 500 (ES).
Didn’t we already hit 3020 few days ago?
Exactly.
Cam-
To spudonfire’s point, and at the risk of ‘stating the obvious but maybe I’m missing something-‘
Has the SPX already not only hit your ‘measured downside minimum target of 3020,’ but also exceeded the target by another 1-2 percentage points (to ~2967)?
It’s possible the SPX successfully survived at least a first test, and is now on its way back up – at least, that’s how I see it.
The downside target of 3020 was only developed after last Thursday’s gap down that created the island reversal. I don’t see how the previous touch at that level is relevant.
OK, thanks.
That was also my question, thanks.
Interesting article
https://www.bloomberg.com/opinion/articles/2020-06-18/nasdaq-s-surge-compels-investors-to-try-timing-the-bubble
Yeah, I would say that both ‘surge’ and ‘compels’ were well-chosen words for the link. Describes the dilemma perfectly. If fund managers are compensated (at least partly) on their performances relative to a benchmark, what else can they do?
https://twitter.com/AAIISentiment/status/1273601106229301248
Copper/gold ratio relationship to the 10-year T-Note yield:
https://www.mcoscillator.com/learning_center/weekly_chart/copper_gold_ratio/
Thanks Sanjay.
This week’s sentiment survey from AAII showed a large spike in bearishness. I’m quite aware of that survey’s limitations, but it does lead me to wonder whether last week’s island reversal refreshed the wall of worry.
https://twitter.com/ukarlewitz/status/1273677673764515841
Jerry and rx, check out this additional detail about the AAII survey: https://twitter.com/RyanDetrick/status/1273699190271545344?s=20
In addition to the island reversal last week, didn’t two of the three components of the Trifecta Model register “buy” signals? $VIX:VXV closed above 1.0 while the TRIN closed above 2.0.
Not sure what to make of the exacta buy signal. Usually these signals are triggered after a prolonged decline, not a one-day big fall in the market. For that reason the signal is highly unusual and probably anomalous.
Walter Deemer is also hesitant about his Breakway Momentum signal for the same reason.
I wonder if it is indeed the start of a new bull market, courtesy of the Fed and Central Bankers around the world.
(a) By the same token, the entire ‘retracement rally’ has been an anomaly. Is it really just a retracement rally, or the birth of a new bull?
(b) If the exacta buy signal is ‘usually’ triggered after a prolonged decline, should we automatically dismiss the current signal? Rather than question the signal, perhaps the correct approach is to question our own views re the market?
https://twitter.com/CNBCnow/status/1273698362638942216
SEC doing its job. Clearing out the deadwood will pave the way for a durable rally.
Yes, heavy outflows from ETFs and mutual funds this week, even larger than the heavy inflows the week before.
Guys like Grantham doing their best to convince investors to sell.
https://www.marketwatch.com/story/stock-market-legend-who-called-3-stock-market-bubbles-says-this-one-is-the-real-mccoy-this-is-crazy-stuff-2020-06-17
Hypothetically –
Let’s say fair value for the SPX (in retrospect) turns out to have been 2500 for 2020 – and in fact, the SPX ultimately retests its low of 2191 in October of 2021. However, in the interim, the index climbs another +20% to 3700.
Who’s ‘right?’ It depends entirely on time frame + risk tolerance + timing of interim buys and sells + one’s philosophical approach to the market.
In that sense, almost anyone can be proven ‘right.’ I recall that at one point during the GFC, a newsletter editor who had moved to cash in 1995 (or thereabouts) was finally proven ‘prescient’ when his portfolio briefly outperformed every other newsletter. However, it took 14 years to be proven ‘right.’ That’s just not right!
To answer who is “right”, it depends on what your time frame is. People like Grantham forecasts based on 7 year time horizons. People like Druckenmiller think in days and weeks, not years.
In theory, both can be right. It depends on the time frame.
We do know from finance theory that the longer the time horizon, the easier it is to forecast returns. The shorter the time horizon, return forecasts get noisier.
Interestingly Peter Tchir is now bearish after being bearish in January and bullish in late Mar through May. I can’t view this due to paywall but his Twitter describes his stance. https://realmoney.thestreet.com/investing/fixed-income/why-i-m-shifting-all-the-way-to-bearish-now-15341404
We have a few clues.
1. https://www.forbes.com/sites/petertchir/2020/06/06/stop-whiningthe-stock-market-rally-has-been-based-on-fundamentals/#2169059d5d64
So Tchir was bullish based on FUNDAMENTALS through early June, before turning neutral the last week of May – then moderately bearish on June 6. Furthermore, how did he define ‘moderately bearish?’ >> (June 6) ‘I am currently bearish, as of Friday, because I think the fundamentals (and technicals) are now aligned to create a small pullback in stock prices. I am mostly focused on whether D.C. can maintain their focus on the economy and what we do with China.’
(b) So two weeks ago he expected a SMALL pullback.
(c) Now he’s ‘all the way bearish,’ and he tells us why: ‘Why I’m Shifting All the Way to Bearish Now
Look for Washington to rapidly lose interest in pumping stimulus into the economy.’
My question is-> what makes him think Washington is about to rapidly lose interest in pumping stimulus into the economy…and is he correct in making that assumption? So basically, whether his call is correct hinges on being right re stimulus. I don’t where he gets that idea. Personally, I think Washington is still very interested in passing additional stimulus measures.
I don’t know where he gets it, other than the fact that McConnell and the Senate tend to be pretty conservative and their donors will not necessarily support more stimulus. Just another data point since Tchir has been quite bullish for the past few months.
It’s an election year. Washington will do anything and everything to keep the party going.
Spot on Sanjay.
Sanjay,
To Second Ellen’s thought process. They will not keep pumping money into the economy if they have a hint that a Democrat might win in November. Republicans have time and again handed ball back to Democrats when it’s about to run out of air. I think their psychology is going to be, “If we can’t win this with Trump, let’s at least scuttle the ship as much as we can, so Democrats look bad, thereby giving them some cudgel to use in 2022 elections for Congress.” Republicans like to play Chess. Just my $0.02 but then again, I could be just seeing some patterns.
Trump is behind 12-15% in polls. The Republican donors may give up on him.
The blogger Macro Charts has been incredibly insightful and posted this today, which seems to contrast with the data re outflows posted by Urban Carmel. Any idea why? https://twitter.com/MacroCharts/status/1273571161511731200?s=20
(a) Urban Carmel references Lipper for his data, which seems to hold up (see below). Furthermore, he states the data refers to ‘THE PAST WEEK’ – so probably June 10 through June 17:
http://www.lipperusfundflows.com/#create:home:Home:/php/signup_trial.php
06/17/2020 Equity Fund Outflows -$25.5 Bil; Taxable Bond Fund Inflows $5.1 Bil
xETFs – Equity Fund Outflows -$9.5 Bil; Taxable Bond Fund Inflows $2.6 Bil
(b) Macro Data uses the term ‘LAST WEEK,’ which may in fact refer to the week of June 3 through June 10:
06/10/2020 Equity Fund Inflows $20.4 Bil; Taxable Bond Fund Inflows $11.1 Bil
xETFs – Equity Fund Outflows -$1.8 Bil; Taxable Bond Fund Inflows $9.3 Bil
(c) In any case, Macro Data seems to set the reader up for a tenuous conclusion. To begin with, ONLY FIVE DATA POINTS! Secondly, he unfairly skews our thinking by saying ‘SINCE 2018.’ Really? Sounds like misguided recency bias to me. Third, if we assume that five data points are actually meaningful, then the odds are ~3:2 that we continue to rally 🙂
Thanks! Agreed, a short term rally may absolutely still be in the cards. That said I do listen to most if not all of what Macro Charts shares on Twitter for what it’s worth– been extremely spot on. There are data points in numerous directions right now so trend following upward is reasonable. Tomorrow is quad witching/ OPEX as well and I am not sure what the effect of that will be.
Ellen
Be careful next week. https://jeffhirsch.tumblr.com/post/620728313288310784/more-volatility-likely-during-june-options
Many thanks, and noted, DV!
Here’s an alternative scenario. Retail investors went long in a big way the week of June 3-10. Then panicked and dumped positions in a big way the following week. The pullback that MacroData expects has already taken place, and markets are now ready for another leg up.
‘Macro Charts’
It’s the calm before the……….(insert direction)
‘blow-your-hair-back rally.’
Feet to fire, that’s my bet.
LOL OK.
Doug Kass linked the following performance behind prison walls by Linda Ronstadt. Killer performance of ‘You’re No Good.’
https://www.youtube.com/watch?v=qoa3pznxPxU
https://www.cnbc.com/2020/06/18/goldman-sachs-has-a-world-winners-portfolio-of-global-companies-with-superior-growth-prospects.html
Any one check this?
SPY trades ex-dividend today.
Quadruple Witching today.
Kevin Marder could be referring to at least a few of you-
https://twitter.com/mardermarket/status/1273834463290552320
Tight wedge in the SPX. I think it breaks to the upside – but I’ve been (spectacularly) wrong before.
So is this really a “new” bull market and we will just have volatility or is the market trying to get me to buy so that it can just go ahead and “steal” my money? It still doesn’t feel right to me, but maybe I should get over it.
Joyce, I think you should order a crystal ball from someone psychic on eBay and let us know what it says. We know what Cam’s crystal ball is saying.
I,m not clear what Cam’s crystal ball is saying – it feels like “on the one hand…. but on the other …”. Are you still mostly cash, Wally?
Yes, mostly. I did ad about 10% more cash to work a few days ago but that only puts me at about 15% in the market. I’m prepared to fully hedge it, though, if Cam’s bearish outlook plays out.
Thanks Wally. The tone out there in twitterverse and other websites seems so bullish – still the difference between main street and wall street. And the pandemic does not seem to be wanting to go away, either. Oh well – more wait and see I suppose.
My thought is that you should take everyone’s opinion, website, twitter post, etc. with a grain of salt until and unless you can verify their track record of being correct over a long period of time. Otherwise, you are just confusing yourself with worthless conjecture.
Oh, and hypothetical track records don’t count. Curvefitting is too easy. It has to be a real time track record.
To brighten your day:
“Analysts, led by Henry Allen, say there is at least a one-in-three chance that at least one of four major tail risks will occur within the next decade: a major influenza pandemic killing more than two million people; a globally catastrophic volcanic eruption; a major solar flare; or a global war. (The current COVID-19 pandemic has killed 443,765 globally already.) If the time frame is two decades, then there is a 56% chance of one of these disasters occurring.”
https://www.marketwatch.com/story/theres-a-one-in-three-chance-of-a-massive-disaster-that-could-be-worse-than-covid-19-says-deutsche-bank-2020-06-17
Don’t want their crystal ball.
I’m reminded of the joke about the man walking along a cliff top. He slips, but manages to grab a root and is hanging on like grim death. He calls out, “Help, help, is there anyone up there?”
A heavenly voice speaks and says “Have faith, let go.”. The man looks down at the crashing waves on the rocks hundreds of feet below, then says “Help, help, is there anyone else up there?”
LOL. They don’t work anyway. If they did, all the psychics would be rich.
Here’s how I look at it:
(a) Cam isn’t perfect. No one is.
(b) However, he has a process. His process has a very good track record.
(c) Occasionally he’ll be wrong.
When he’s wrong, is that a reason for him to abandon his process? No, of course not!
Don’t disagree, but is this one of the “wrong” times or is it just a time frame issue? I mean “near” time frame (next 6 months). If things will go tilt in the next 6 months, it’s probably worth the wait. If this is a really new bull market – how to know. Or do you just become a trader/investor as opposed to a long term investor?
We’re not meant to know the answers to your questions, Joyce.
Trading is meant to be a challenge. If it wasn’t, we would all be making money with zero risk and be unhappily earning 1% annually on our funds (that game is marketed by banks as Certificates of Deposit).
Exactly. But you and I are both bucking Cam’s current short term short position. I’m not holding any short position and neither are you. But, I am remaining in cash with the vast majority of my account because of Cam’s warnings.
Well, me too, Wally. I have lost on previous short calls and have now avoided both long and short calls.
I want buy shares in “real” companies that have real long term prospects with minimal (not none) volatility, i.e. a real “investor”.
Perhaps I am dreaming. Probably.
Looks like Cam’s system is working.
This is definitely the market I know – the bucking bronco that does everything it can to take you out of a bull trend.
One thing I have found helpful that I hadn’t really heard of before finding Humble Student is the investment policy statement. By going through a formal process of determining your risk tolerance, goals, income needs, etc. you come up with a target asset allocation. What I have done from there is adjust my policy weights based on the “inner investor” and “inner trader” calls that Cam puts together. It seems like this concept has been alluded to in various comments and articles over the years, but to my knowledge there isn’t really a formal write up of this concept and how to apply it here. I am guessing a lot of that comes down to liability, where Cam has to distance himself from the idea that he is your financial advisor because he is not (a lot of comments are the disclaimer, it depends on your own situation, which I do not know, so I can’t advise you) which is fair enough, I get that.
What I have always thought would be really helpful though, and more in line with the ‘teaching you how to fish’ philosophy, if there could be a few more educational posts on how a few different hypothetical investors might come up with an investment policy statement, and how they might adjust the weights based on the sort of risks we get hints of from the inner trader and inner investor directions here.
The reason I think this would be helpful is that I fear some readers may be taking Cam’s calls as an ‘all in’ bet on the market, which I don’t think an investment policy statement would ever suggest. Instead of swinging from 100% stocks to 0% stocks in other words if the inner investor flips bearish, following your policy statement you might go from your target weight of 60% stocks/ 40% bonds, to a more conservative 40% stocks, 60% bonds. If you preset trading bands you have a plan ahead of time and you avoid a lot of the emotional decision making and second guessing after the fact.
I think the current trading environment helps validate this concept. I never would have guessed either the magnitude of the decline, or the speed of the recovery in our current environment. I actually went outside of the investment policy I had sort of pieced together and have a lower allocation to stocks than my original minimum band – which turned out to be a mistake (oops). I was just so ‘certain’ we would top out and retest that I ‘made a bet’ and sold an extra 10-15% of my stock holdings below what I decided would be my minimum stock holding percentage. In other words, I went outside of my rationally put together plan, and here we are with the market higher and me ‘hoping’ the market goes down instead of running off a carefully crafted plan where I would be fine no matter what happens (and to be clear, hope is never a good plan).
By using an investment policy statement I think the potential is there for us to skim some extra wins, while also still doing ‘ok’ against black or white swan scenarios. Here is an article I found on Morningstar that might be helpful if anyone is interested in learning more about this concept:
https://www.morningstar.com/articles/808692/how-to-create-an-investment-policy-statement
I know the feeling of being over or under invested in the market over the years and being on the wrong side of a trade so wanted to throw this out there in case helpful to anyone because I feel like there are some fellow students out there struggling with what to do with a seemingly irrational market.
I think it was Todd Harrison who used to point out that we’re always holding too much when a position moves against us, and never enough when we’re right.
Over the years, we learn what we’re comfortable with, and what works for us.
The Vice Fed Chairman is talking the market up after bad Covid numbers knocked it down.
Did you guys read this article? I only say that because we have been debating about Robinhood traders on the blog, this article will give you some clarity.
https://www.cnn.com/2020/06/19/business/robinhood-suicide-alex-kearns/index.html