Mid-week market update: It can be difficult to discern the market’s short-term outlook on an FOMC meeting day, but the Fed has spoken, and the market reaction has important signals for equity investors from an inter-market, or cross-asset, analytical basis.
The first important signal comes from gold prices. Gold staged an upside breakout to a fresh high from a multi-year base that stretches back to 2011. Point and figure charting shows upside targets in a range of 2440 to 2670, depending how the box size and reversal parameters are set.

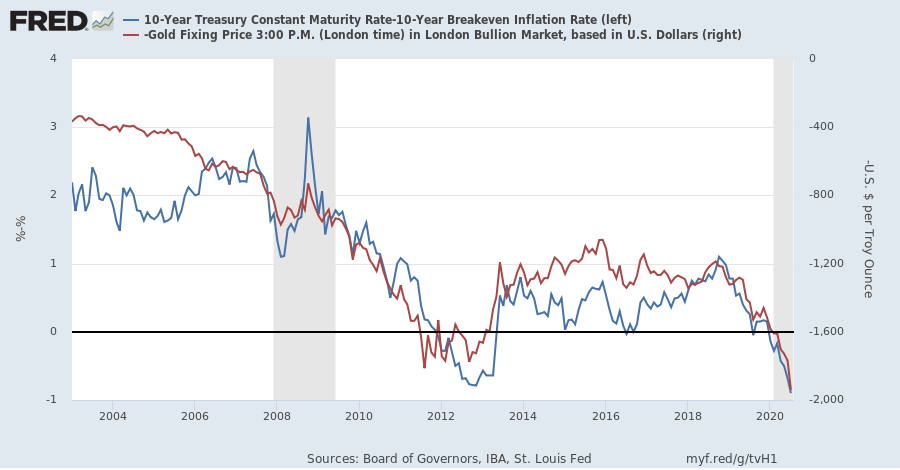
The Fed’s dovish tone is a statement of policy that it intends to keep rates low until employment returns to pre-pandemic levels. As well, it has not ruled out yield curve control to suppress rates in longer Treasury maturities. Real yields are falling as a consequence, and real yields (blue line) have been inversely correlated with gold prices (red line, inverted scale).
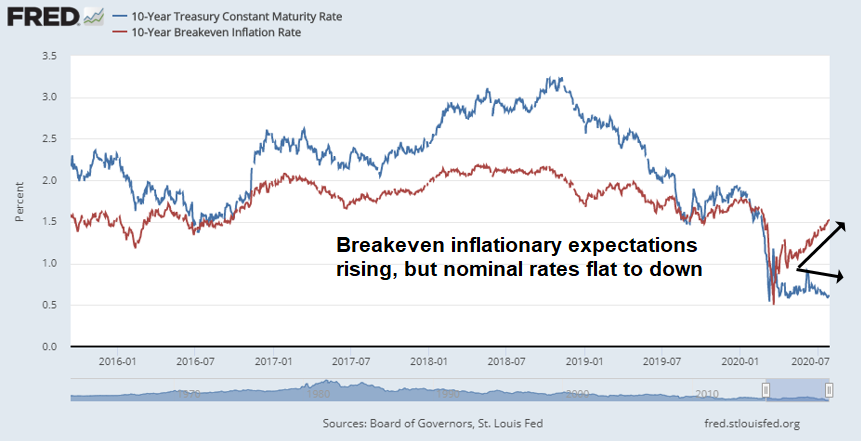
Separating the real yield into the 10-year nominal Treasury yield and the 10-year breakeven yield reveals a divergence in market expectations. On one hand, the stubbornly low level of the 10-year yield indicates that the Fed is expected to be on hold for a long time. On the other hand, a rising breakeven indicates expectations of successful reflationary policies over the next few years. The risk is the economy fails to reflate, or reflationary expectations fizzle in the future. Both outcomes would deflate gold prices.
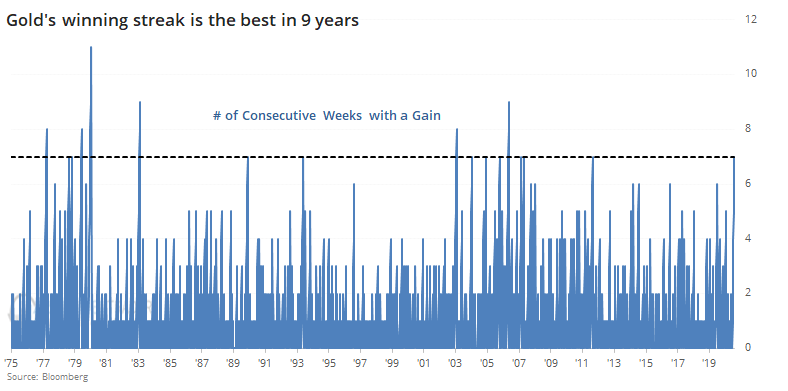
To be sure, gold sentiment is at an off-the-charts bullish extreme, which is contrarian bearish. SentimenTrader pointed out that the current rally represents a seven week winning streak for the shiny metal. “Outside of the late 1970’s run-up, every single signal showed a loss over the next month. Only one of them showed a gain even three months later.”
The same goes for silver prices. One of the bearish tripwires that I mentioned on the weekend is weakness in silver prices, which serves as a risk-off signal for equities (see Warnings. warnings everywhere, but bears should not drink…). That sell signal has not been triggered yet.

Brace for volatility
As well, there are warnings of a possible spike in volatility. Macro Charts observed that rate volatility (MOVE Index) has reached an all-time low. Low volatility episodes have been followed by volatility spikes in all asset classes.

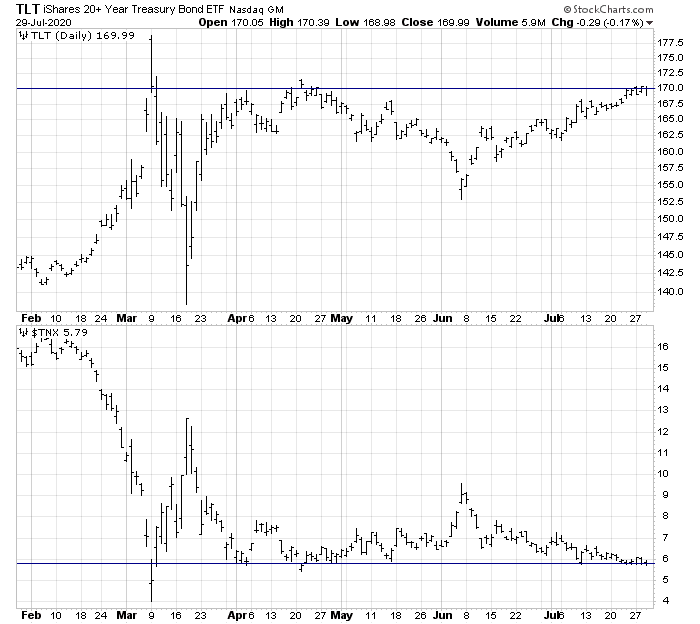
Long bond prices (TLT) are tracing out a possible inverse head and shoulders pattern, though it has not broken up through the neckline. The 10-year Treasury yield has been testing a key support level. In light of the environment of suppressed volatility, a bond price rally could be a signal for an explosive risk-off episode.
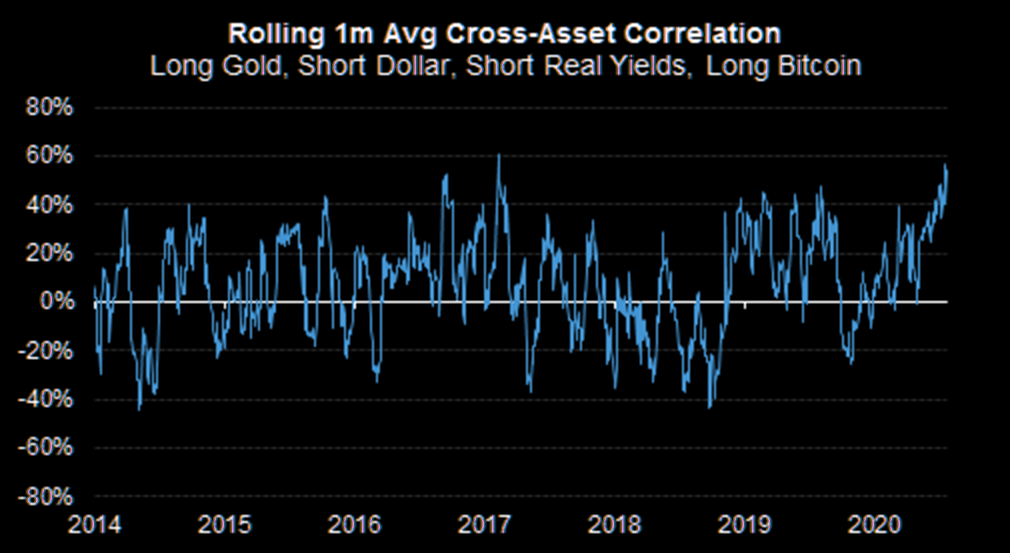
The explosion in gold and silver prices, and the weakness in the USD, are all becoming one big macro trade. Cross-asset correlation is rising, indicating herding behavior. We have a crowded long in gold and silver, and a crowded short in the USD. With sentiment so stretched, this is setting up for a possible explosive reversal.
Stalling confidence
I wrote back in May that the falling stock/gold ratio is a sign of long-term headwinds for equity prices (see What gold tells us about confidence) and I stand by those remarks.
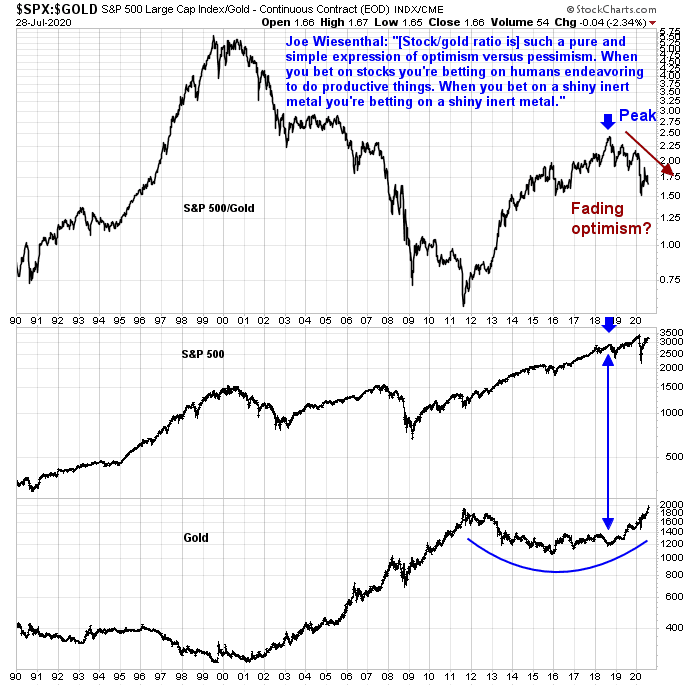
In the short run, however, gold prices are highly extended. A likely outcome of this upside breakout is a pullback into a cup and handle pattern, which is still long-term bullish.

Tactically, we don’t have the bearish triggers yet. Near-term event risk is high, as roughly 40% of the weight of the NASDAQ 100 report tomorrow. My inner trader is staying on the sidelines but monitoring the situation carefully. He is prepared to jump in on the short side should we see a bearish trigger. My inner investor remains neutrally positioned at roughly his investment policy targets for each asset class.
Cam- The most bullish move a market can do is to move up in price. What might constitute a bullish trigger for your inner trader?
‘the most bullish move a market can make…’
To be bullish, I would like to see the following combination:
1) Strength in FANG+ and cyclical sectors
2) Continued USD weakness
3) Rising bond yields
Thanks Cam! Great benchmarks.
Cam, I though the FANGs were strengthening because of weakness in the real economy as people work from home. If the real economy sparkles, the strength in FANGs should fade.
At a minimum, I wouldn’t want to see large cap tech totally fall apart. That would be bad for the bull case.
Thoughts on the VIX, Cam? Some are speculating it is still trending downward…
As I pointed out, MOVE is at an all-time low. Is that a sign of complacency, or is the market discounting better times ahead?
Thank you! Complacency is also implied by put/ call ratio (see Urban Carmel tweet today) but that has not mattered quite yet… Fed announcement seems to have placated markets and there is widespread belief that stimulus bill will pass, which seems priced in. Any disappointment on the stimulus could surprise the market IMO…
Has anybody seen the Hunt brothers around anywhere?
How low can the 30 year go?
A 30-year fixed at 0% or lower? The day may come when Fannie and Freddie pay us to buy homes!
This morning’s shakedown was probably enough to launch the next leg up.
From SentimenTrader-
‘Consumers keep fighting this uptrend
We’ve been seeing for months that consumers haven’t really been buying into the idea of an immediate economic recovery. Four months later and more than 25% higher in many indexes, consumers still aren’t buying it.
‘The latest survey from the Conference Board shows that more consumers expect stock prices to decrease over the coming months than increase. This is highly unusual – there is a strong positive relationship between the S&P 500’s rate of change over the past four months and the net percentage of consumers who expect stocks to rise going forward.
‘Recency bias is a real thing. The only other months in more than 30 years of history when the S&P gained more than 20% and yet consumers, on balance, expected stocks to fall were June and July 2009.
‘There is no good way to reconcile this against other indicators that show highly speculative behavior from investors – there are rarely any times when every indicator agrees. It’s just a matter of determining what matters most and using weight of the evidence.’
“In sum, both long leading indicators in the GDP report suggest that the economy will not be doing that well by summer 2021, even if the coronavirus is contained.”
https://bonddad.blogspot.com/2020/07/q2-gdp-does-not-bode-well-for-early-2021.html
https://www.marketwatch.com/story/osterholm-americans-will-be-living-with-the-coronavirus-for-decades-2020-07-30?siteid=bnbh
RX, I think those who were jumping on the world-wide pandemic theory in January were those who are prone to worst case and conspiracy theories. This epidemiologist seems to be one of those types of people.
I think it may be in parts of the world for some time but in advanced western countries the advent of one or more vaccines will pretty much end the reign of the coronavirus within months.
This market is full of upside surprises-
‘Apple announces 4-for-1 stock split; stock rises 5% on earnings beat’
FB, AAPL, AMZN – all killing it.
Difference between have and have nots is huge in this economy.
Yes, spot on. The difference between haves and have nots. A minority of Americans own stocks and Jane and Joe six pack are still selling stocks and buying bonds!
More seriously though, market action next few sessions will tell us whether we have an intermediate peak or not. As expected, tech has beaten handily today. Indices are up in the futures markets. For now, it is hard to figure out what would be a bearish catalyst.
DV, only bearish catalyst that immediately comes to mind is that Congress has gone to recess for the next 93 hours and allowed the unemployment benefits to expire.
I still think the end of month ramp up for tomorrow seems likely, but after that I would be very concerned about the stimulus package. The two sides are further apart than the market is pricing in IMO. They will get there eventually but not without a fight. Dems realize they have leverage because there are only 53 GOP senators and they need 60 to pass anything. Does not look like Schumer and Pelosi are going to merely accept temporary extension of unemployment without the other necessary items in the package such as testing and contact tracing funds, school funds, etc.
The action in the bond market is more than just Joe six pack, maybe folks taking money off the table? I know I have.
Big tech success In q2 is both a result of and a driver of inequity. And I say that from the bubble of Silicon Valley where Shelter In Privilege is the norm. Apple got $1k from our family and everything comes from Amazon to our door. That times several million and you get the quarter results. Probably will continue at this pace IMO, the big get bigger. I don’t work in big tech but they are my clients. Money is not a problem in the big companies, they are spending too. We also benefit from stocks and real estate. The trends of the past twenty years are being accelerated by Covid.
“Shelter in Privilege” perfect description
How often have we seen this setup play out-
1. Upside breakout appears imminent.
2. First attempt ‘fails.’
3. Sharp move lower to shake out weak hands.
4. Upside breakout after hours that leaves everyone in the dust.
Fakeout to breakout.
Intraday, buying the dip has worked out very well this week.
An incidental benefit to holding ten ETFs/seven funds (rather than 1-2) is watching the intraday and interday ticks. The ones that have performed best over the past two days? REITs (by a wide margin) and small-cap value – two sectors I have never paid attention to in the past.
Interesting. Thanks!
Pretty tepid post-earnings rally, but IMO that’s a plus – a sharp rally would be sold and lead to a red close, whereas opening flat may draw in additional buyers and result in a close near the highs.
Doesn’t get any better than that. I think we gap up on Monday (against all expectations) to kick-start a move to new highs.
$wlsh monthly, positive at 4.762. End of day push just enough to get the job done!!
Here’s one of those comments I come across on Twitter that makes my day:
https://twitter.com/aztecs99/status/1289290578773938176
Picked up some energy stocks this morning since McClellan is suggesting inflation is coming.
https://www.mcoscillator.com/learning_center/weekly_chart/corn_and_wheat_prices_headed_higher/
https://www.mcoscillator.com/learning_center/weekly_chart/crude_oil_uptrend_to_october/
https://twitter.com/kalibercap/status/1289309936623726600
Bollinger bands are systems of suppression.
#defundthebands
*oppression #dammit
Monthly MACD turned positive with today’s close.
https://twitter.com/mark_ungewitter/status/1289295912401952768