Preface: Explaining our market timing models
We maintain several market timing models, each with differing time horizons. The “Ultimate Market Timing Model” is a long-term market timing model based on the research outlined in our post, Building the ultimate market timing model. This model tends to generate only a handful of signals each decade.
The Trend Asset Allocation Model is an asset allocation model which applies trend following principles based on the inputs of global stock and commodity price. This model has a shorter time horizon and tends to turn over about 4-6 times a year. In essence, it seeks to answer the question, “Is the trend in the global economy expansion (bullish) or contraction (bearish)?”
My inner trader uses a trading model, which is a blend of price momentum (is the Trend Model becoming more bullish, or bearish?) and overbought/oversold extremes (don’t buy if the trend is overbought, and vice versa). Subscribers receive real-time alerts of model changes, and a hypothetical trading record of the those email alerts are updated weekly here. The hypothetical trading record of the trading model of the real-time alerts that began in March 2016 is shown below.

The latest signals of each model are as follows:
- Ultimate market timing model: Sell equities
- Trend Model signal: Neutral
- Trading model: Neutral
Update schedule: I generally update model readings on my site on weekends and tweet mid-week observations at @humblestudent. Subscribers receive real-time alerts of trading model changes, and a hypothetical trading record of the those email alerts is shown here.
Subscribers can access the latest signal in real-time here.
Sentimental warnings
There are two kinds of sentiment models. Some sentiment readings come from investor surveys, and others are derived from investor positioning. I prefer the latter because it shows how people are behaving with their money instead of just expressing opinions.
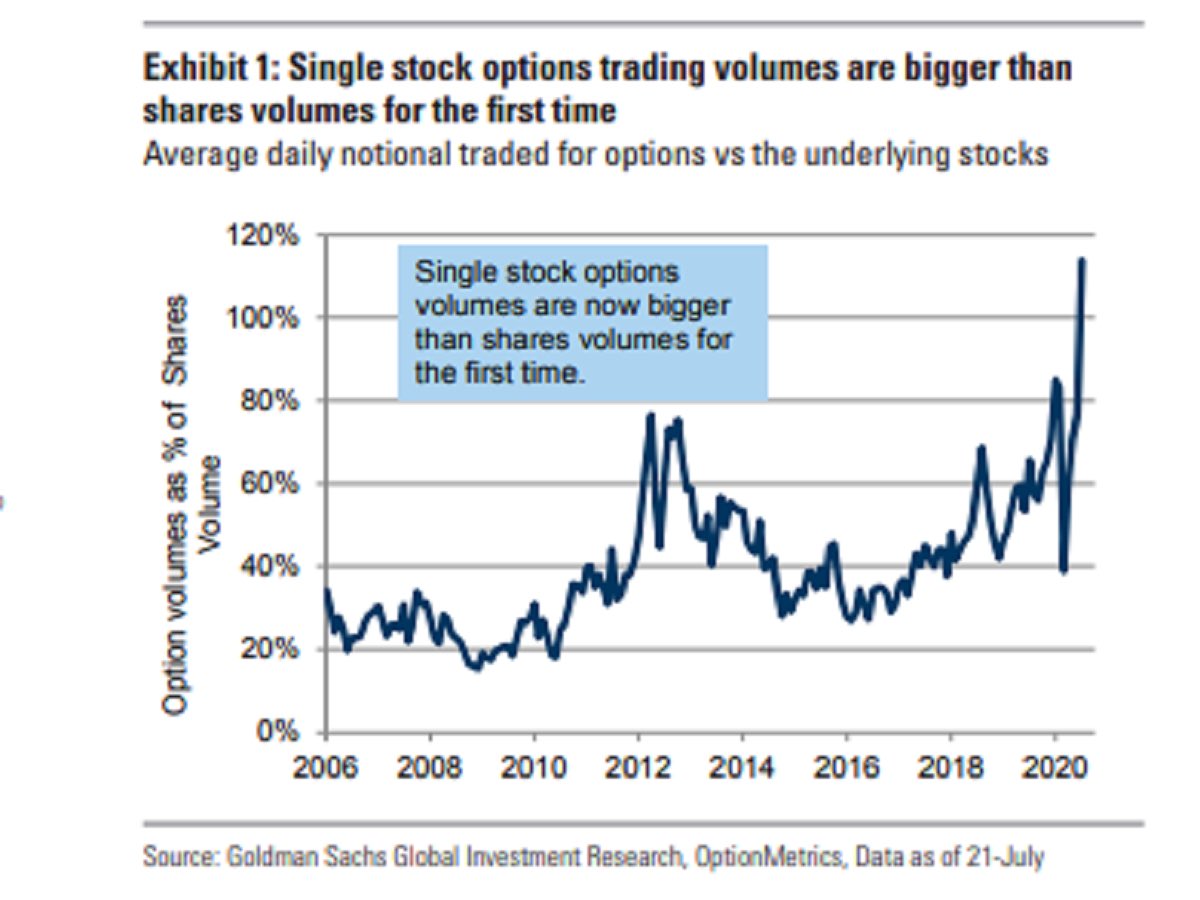
Intermediate term option sentiment models are flashing warnings everywhere. It is a sign of froth in this market when individual stock volumes have exceeded the volumes of the underlying stocks.
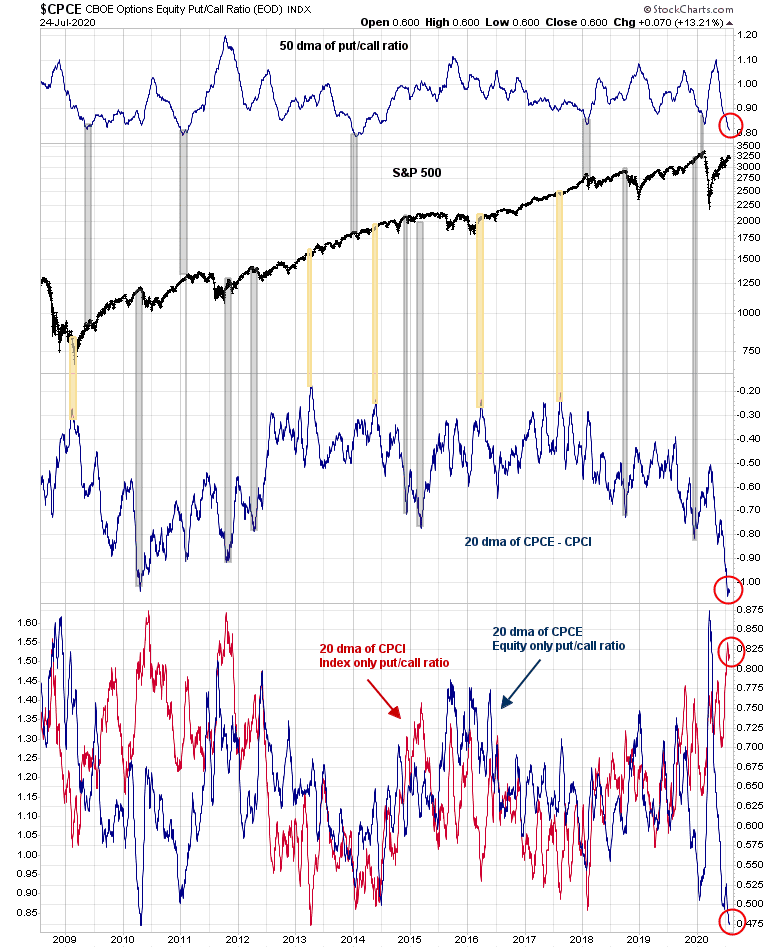
In addition, the 50 day moving average (dma) of the put/call ratio (top panel) is extremely low. Past episodes have seen the market either correct or stall. As well, there is an enormous gap between the equity-only put/call ratio (CPCE) and the index put/call ratio (CPCI). Individual traders (dumb money) tend to express their exposure preferences through individual stock options, while professionals (smart money) use index options for hedging. Such extreme differences in option opinion between the two groups have created headwinds for stock prices in the past.
Although this is an opinion survey, the NAAIM Exposure Index, which measures the opinions of RIAs, has returned to bullish extremes. I would caution, however, that this indicator has only worked well as a buy signal when RIAs panic, but it has not flashed actionable sell signals in the past. Nevertheless, it does show that sentiment has reached high levels of bullishness.

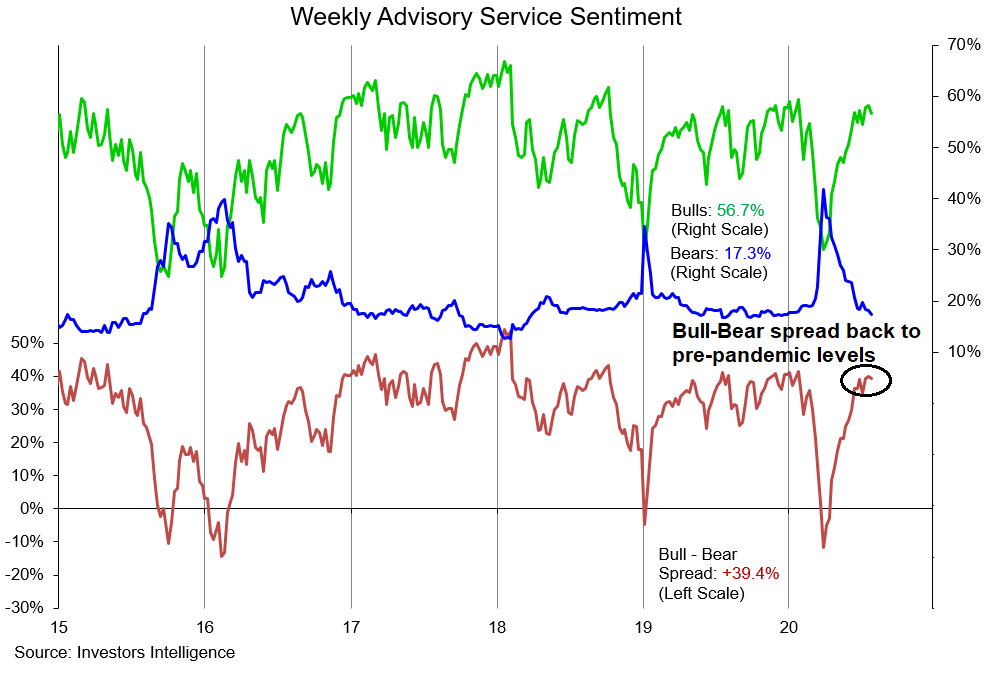
The Investors Intelligence Survey shows that the bull-bear spread has returned to the pre-pandemic levels seen before the COVID Crash.
The State Street’s North American confidence, which measures how institutional managers are positioned using aggregate custodial data, shows that institutional bearishness has evaporated. That said, readings are not at bullish extremes.

I would warn, however, that these excessively bullish sentiment readings are only contrarian bearish setups. While the intermediate term risk/reward for the stock market is subpar in light of these conditions, short-term conditions have suddenly flipped from bullish to bearish. After two weeks of faltering NASDAQ price momentum, the tone in my social media feed has turned to a panicked “this is the start of a major correction” narrative. While the NASDAQ 100 has violated a support level (dotted line), the index remains in an uptrend.

Short-term breadth is recycling from an overbought reading, but it is still tracing out a pattern of high lows.

A relief rally may be in order early next week.
Cross-asset bearish tripwires
While we certainly have the elements of a bearish setup, we don’t have a definitive sell signal for the stock market yet. Here are some inter-market, or cross-asset, bearish triggers that I am monitoring.
First, bond prices and, its inverse, bond yields are useful risk-off indicators. The 10-year Treasury yield has been testing a key support level, which it has failed to violate. Conversely, the long bond ETF (TLT) appears to be forming an inverse head and shoulders formation. As good technicians know, a head and shoulders pattern is not confirmed until the price breaks the neckline. If either the 10-year yield were to violate support, or TLT stages an upside breakout through the neckline, it would be a risk-off signal.

One sign of froth present in the market is the surge in silver prices, which is a bullish cyclical indicator. Troy Bombardia observed that call option volume on SLV, the silver ETF, has spiked to an all-time high. Call option volume on GLD, the gold ETF, is also at one of its highest levels ever (not pictured).
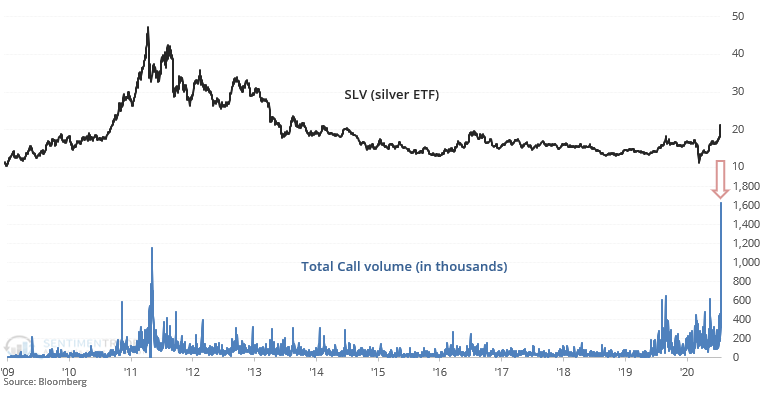
Past episodes of price reversals after silver goes parabolic have usually not been good for stock prices. I am watching for an inflection point in silver’s 52-week rate of change (bottom panel). Again, we have a bearish setup, but not a sell signal for equities.

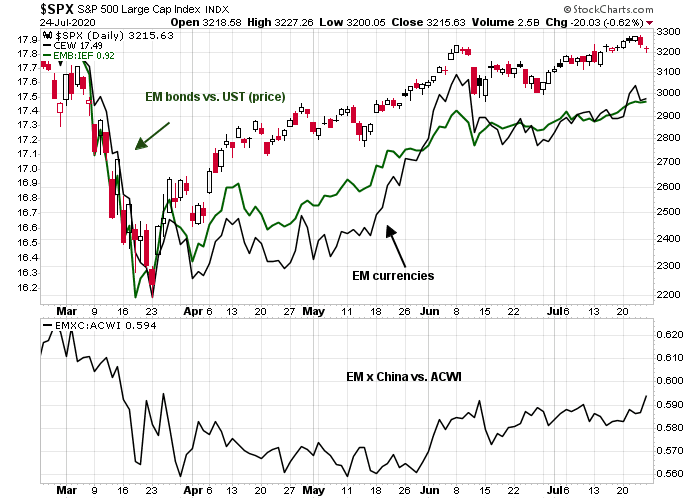
As well, recent weakness in the USD has been supportive of emerging market equities. The strength in EM currencies and EM bonds has put a bid under fragile EM economies with large current account deficits.
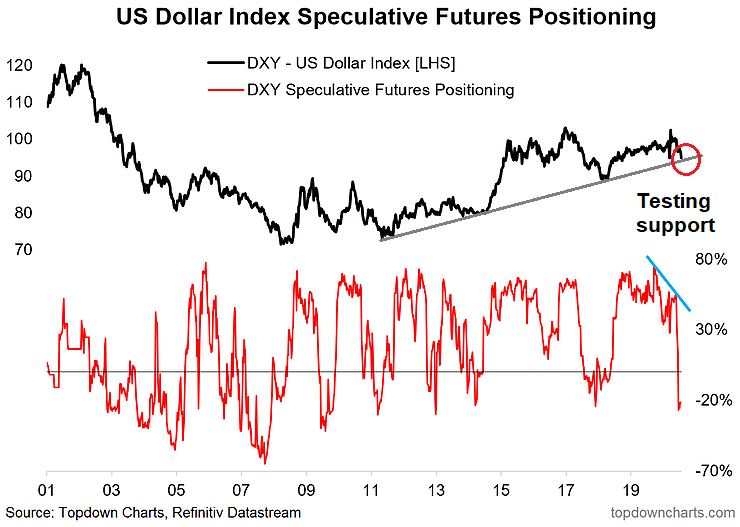
What if the USD were to reverse upwards? Callum Thomas of Topdown Charts pointed out that speculative positioning in the USD is at a crowded short. In addition, the USD Index is testing key rising uptrend support. This is the perfect combination for a dollar rally.
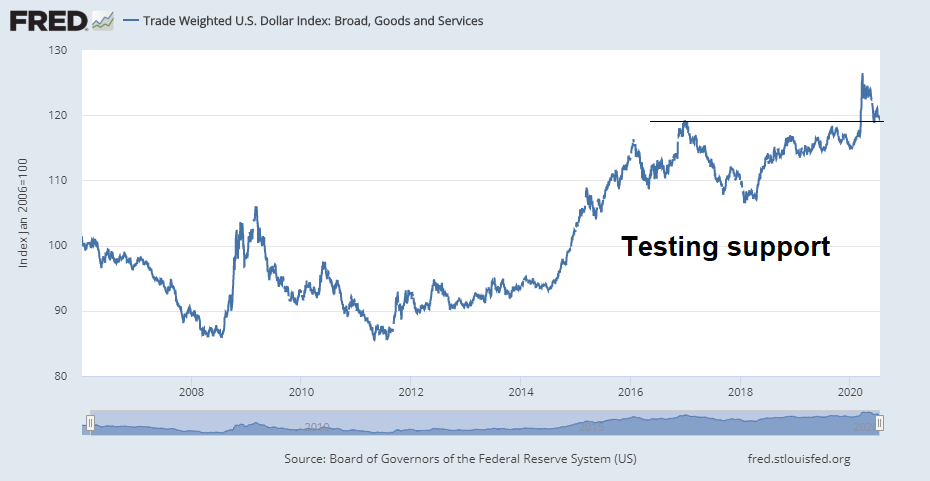
The market’s focus on the USD Index (DXY) may be misleading. While the technical condition of DXY appears weak, the technical condition of the broad-based trade weighted dollar (TWD) is far more benign. The TWD has retreated after a spike back to test a key resistance turned support level, which is a far more constructive technical pattern than DXY.
Were the USD to turn around and begin to rally, it would create an additional headwind for risk appetite.
Waiting for Congress
Last week’s market action may be indicative of a change in psychology. The market’s focus appears to be shifting towards how Congress will respond to the economic cliff of the expiry of the $600 per week unemployment insurance payments on July 31.
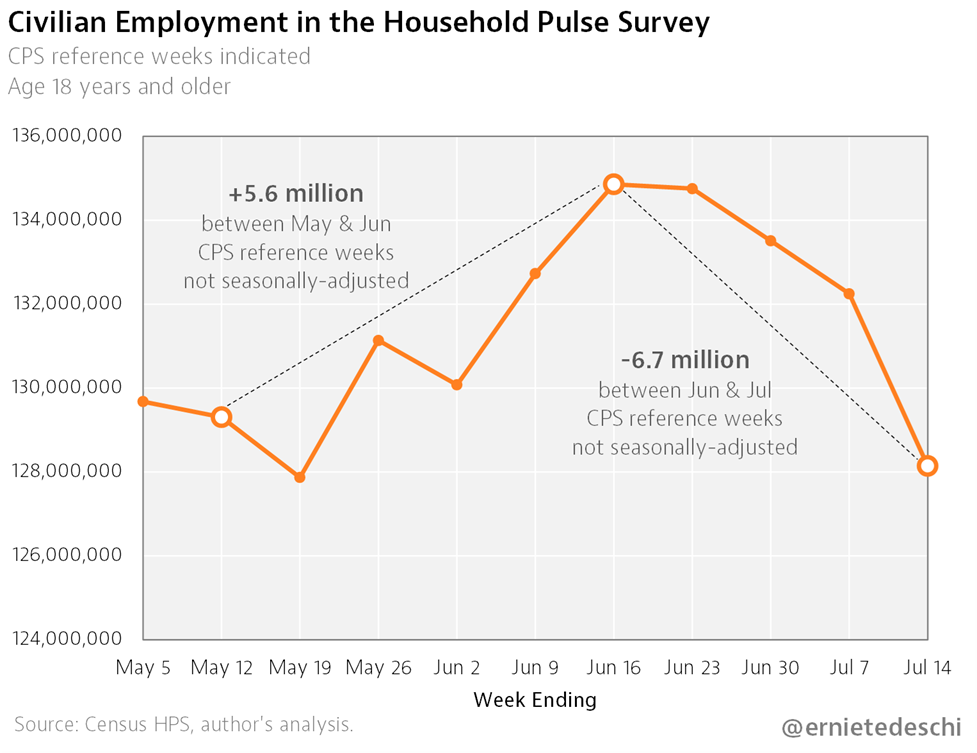
More and more high frequency data is pointing to a softening in economic growth, such as the Census Bureau’s Household Pulse Survey of employment.
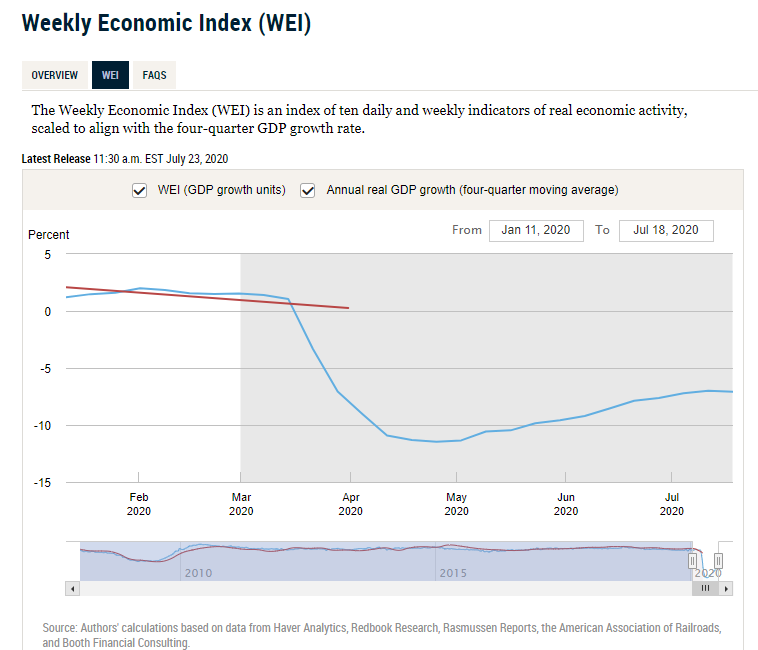
The New York Fed’s Weekly Economic Index is stalling and may be starting to roll over.
Data from Yelp shows that permanent business closures are rising, with restaurants and retailers the hardest hit.

A renewal of the expiring CARES Act fiscal stimulus is therefore of high urgency if the economy were to avoid falling off a cliff. Lawmakers have already missed the July 25 deadline for states to re-program their computers to implement a new stimulus plan. The Republicans are in disarray and have not been able to present a united front. Republican Senate majority leader Mitch McConnell is expected to unveil a proposal Monday, which is necessary before they even begin to negotiate with the Democrats in Congress.
Expectations are rising for a deal. This week’s cover of the Economist could be interpreted as a contrarian magazine cover indicator.

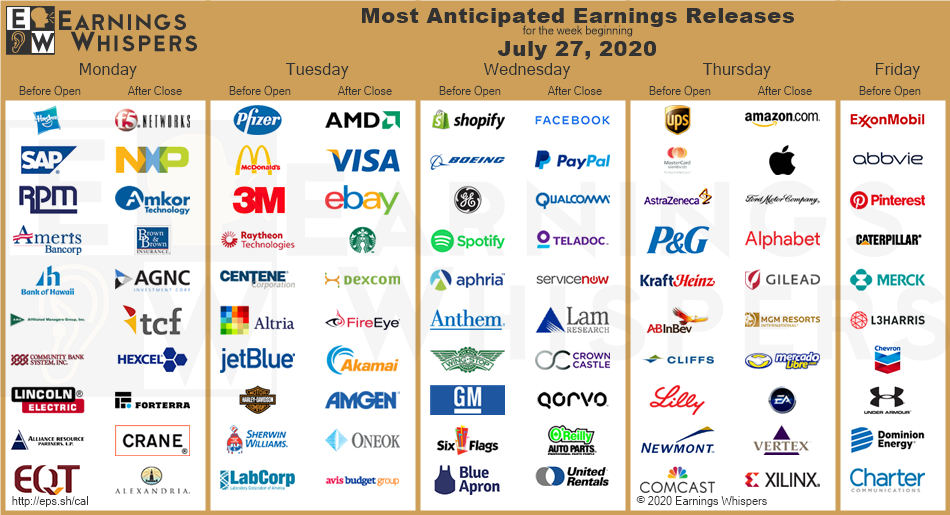
The market’s risk-off tone last week was probably in reaction to the latest uncertainty in Washington. Market psychology is very jittery and headline sensitive. As well, several major large cap FANG+ stocks, namely Facebook (FB), Apple (AAPL), Amazon (AMZN) and Alphabet (GOOG), are expected to report earnings in the coming week. Brace for volatility.
While I am intermediate term cautious, my inner trader is inclined to wait for bearish confirmation of a break before taking action on the short side.
Robinhood charges nothing for trades. One key way they make money is by routing their customers trades through HFT (High Frequency Trading firms). These firms pay large sums to firms like Robinhood. The HFT front runs customer trades with high speed computer algorithms, when they see a large wave of trades (both buy or sells) coming to the market. They make small amounts hundreds of thousands of times a day. This adds up to big profits. It also ups the number of trades. Read this;
https://www.bnnbloomberg.ca/robinhood-gets-almost-half-its-revenue-in-controversial-bargain-with-high-speed-traders-1.1152685
This is a known situation in stock trades but I have never heard it in options. But I suspect HFT firms are exploiting this area now. This would make the number of option trades soar as HFT computers zip in and out with positions held for seconds.
The HFT effect on a Robinhood clients is adding small amounts to their fill prices. So it is not free trading. It’s hidden costs.
Ken you are right about the volume. It is distorted and more so when there are big blocks of trades involved. But overall since the HFTs arrived at the scene the market liquidity has improved dramatically and actually benefited small investors/traders. 20 years ago discount brokers charge $9.99 and then $4.99, and now $0. And more importantly for more frequent traders, the bid-ask spread has shrunk considerably. Now if you look at your fill price, it is common now to see the numbers get into three digits behind decimal points.
I did HFTs for a while after quitting engineer’s job, working inside CME/CBOE buildings. It is a lot involved, and not as flashy as media portrayed. It is a gritty business. Many of the firms are gone. The rest have merged with one another or got bought out by big hedge funds. My memory of those days are still fresh. I met tons of brilliant people. Most of them have Ph.D. degrees in math, EE, CS, physics from big name schools: Caltech, MIT, Stanford, …, you name it. It is just a colossal wast of talent. Image if we can put these people together and work on most important problems in societies. On the other hand, this is the greatest strength of American system, despite its many flaws: it allows people freedom and opportunities to pursue anything at the risk of losing everything. Many made their money and have since put to good use and feedback to societies for good causes. Brilliant techies still are doing this today. MIT recently lost one young genius math professor to one big quant hedge fund.
Apparently the most efficient method of fooling the HFTs is by spoofing. So, what does the CME and HFTs do about this ? They combine forces to make spoofing illegal.
That way the CME makes money off of the CME volume while the HFTs take money from brokers’ clients.
Probably a tough week for either bears or bulls to be drinking. Instead, sit in cash with a good cup of coffee and watch the markets take off in one direction or the other – but be prepared to make your move after the market shows its hand.
A good write-up from Callum Thomas:
https://www.topdowncharts.com/post/weekly-s-p-500-chartstorm-26-july-2020
From a personal perspective, my retrospective take is that I was sucked in on June 8 by the melt-up in tanks and banks – to my detriment. However, the correct move is generally to buy the first pullback – which is what saved my —. Now it gets trickier.
If the CPCI (smart money) is high, it indicates good amount of hedging already by institutions. If they are hedged, would that not be contrarian bullish? If I (dumb money) am not hedged, then using options to take positions would be a risk defined way to be in the market. Particularly when trading costs are next to nothing. What am I missing?
I’m not sure how this video ended up in my Youtube feed, but it’s worth watching:
https://www.youtube.com/watch?v=BHBr0o8Imj4
The last time I recall seeing a photo of Frampton was along South University in Ann Arbor in the Seventies – he had curls down to his shoulders and shirt open to his navel. Glad to see he’s still playing and playing better than ever!
https://www.telegraph.co.uk/news/2020/07/26/risk-uncertainty-fear-failurewhy-scientists-arent-celebrating/
No one seems to talk about share of earnings of FAANGM in ratio to total SP500 earnings and their corresponding market cap ratio. Is it out of line on that basis? Growth rates of these 6 vs rest of SP500 campaniles?
Check out Ciovacco’s weekend video. He doesn’t think so.
Thanks!! Quite illuminating and refreshing.
Is it possible for the Fed to suppress interest rates? Or is this a market reaction to the Fed?
Seems like futures are reacting to the US dollar selloff. Tailwind for equities or is that too simplistic?
Could also be a side effect of the bond market. 30 and 10 year interest are lower this morning.
I usually take it as a signal that there’s volatility in equities coming, but everyone’s expecting this due to earnings anyways.
Thanks! I’ve seen speculation that the moves in precious metals and USD may suggest that the FOMC could imply Yield Curve Control on Wed.
https://twitter.com/BullandBaird/status/1287743149528494080
Wow.
Cam,
With the debasing of the $, is it time to buy commodities?
Thanks.
Here is a chart from Nautilus:
https://twitter.com/NautilusCap/status/1283429910078423040
Another one on USD:
https://twitter.com/NautilusCap/status/1285260910693691392
Thanks Sanjay. Within commodities, probably metals without gold/silver and no oil is probably what one needs to look at.
D.V., look at uranium and copper.
Major uranium mines at the two largest uranium producers (Cameco and Kazatomprom) have been shuttered due to covid-19. A few large mines are also expected to close over the next few years. The market is in deficit with the deficit being bridged with secondary supplies (uranium inventory at utilities, etc.). The expectation is that the secondary supplies are getting exhausted as well.
https://twitter.com/quakes99
(Admittedly, a long-time bull and cheerleader on uranium).
SPY might be worth shorting here down to 317. Then flip long.
Facebook announces plan to breakup the U.S. Government before it becomes too powerful.
https://www.theonion.com/facebook-announces-plan-to-break-up-u-s-government-bef-1844121902