Preface: Explaining our market timing models
We maintain several market timing models, each with differing time horizons. The “Ultimate Market Timing Model” is a long-term market timing model based on the research outlined in our post, Building the ultimate market timing model. This model tends to generate only a handful of signals each decade.
The Trend Asset Allocation Model is an asset allocation model which applies trend following principles based on the inputs of global stock and commodity price. This model has a shorter time horizon and tends to turn over about 4-6 times a year. In essence, it seeks to answer the question, “Is the trend in the global economy expansion (bullish) or contraction (bearish)?”
My inner trader uses a trading model, which is a blend of price momentum (is the Trend Model becoming more bullish, or bearish?) and overbought/oversold extremes (don’t buy if the trend is overbought, and vice versa). Subscribers receive real-time alerts of model changes, and a hypothetical trading record of the those email alerts are updated weekly here. The hypothetical trading record of the trading model of the real-time alerts that began in March 2016 is shown below.

The latest signals of each model are as follows:
- Ultimate market timing model: Sell equities
- Trend Model signal: Neutral
- Trading model: Bearish
Update schedule: I generally update model readings on my site on weekends and tweet mid-week observations at @humblestudent. Subscribers receive real-time alerts of trading model changes, and a hypothetical trading record of the those email alerts is shown here.
Subscribers can access the latest signal in real-time here.
The moat around the island
I have been highlighting in these pages the bearish island reversal which formed in mid-July. Although stock prices haven’t fallen significantly, the bulls have been unable to breach the gap that defines the island reversal. Conversely, past market advances since the downside break from the island has stalled at resistance at about 3150-3160.
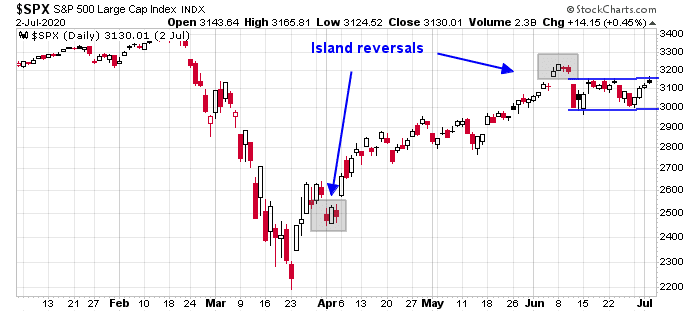
Is there a moat around the island?
A NASDAQ stall?
The intermediate term internals continue to tilt bearishly. Let’s begin with the NASDAQ, which achieved all-time highs on Thursday. However, the fresh highs were accompanied by negative 5 and 14 day RSI divergences, as well as negative divergences from the percentage of NASDAQ 100 stocks above their 50 and 200 day moving averages. That said, these negative divergences are not necessarily actionable trading signals, as they can persist for some time before the market turns down. What they do show is that the intermediate term outlook is not favorable for the bulls.
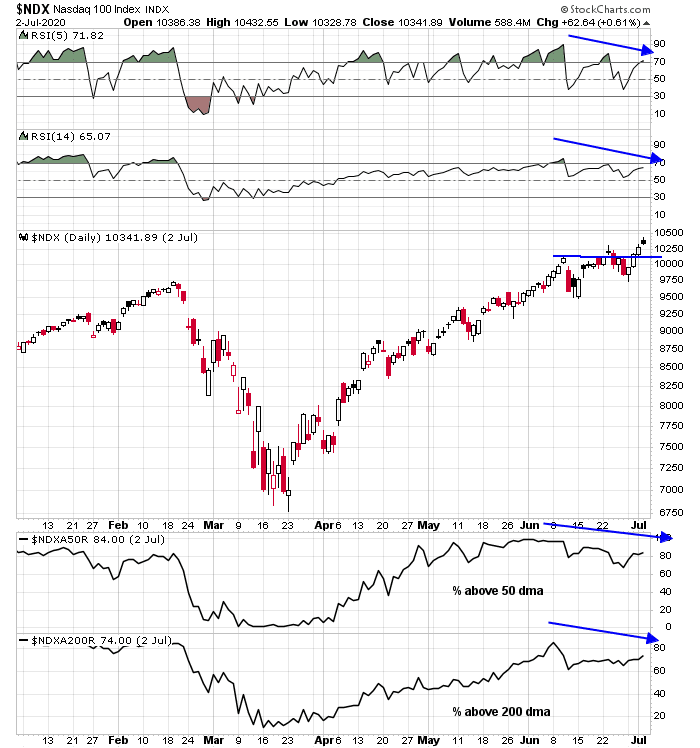
Similarly, the relative performance of NDX to SPX is also exhibiting a negative RSI divergence.

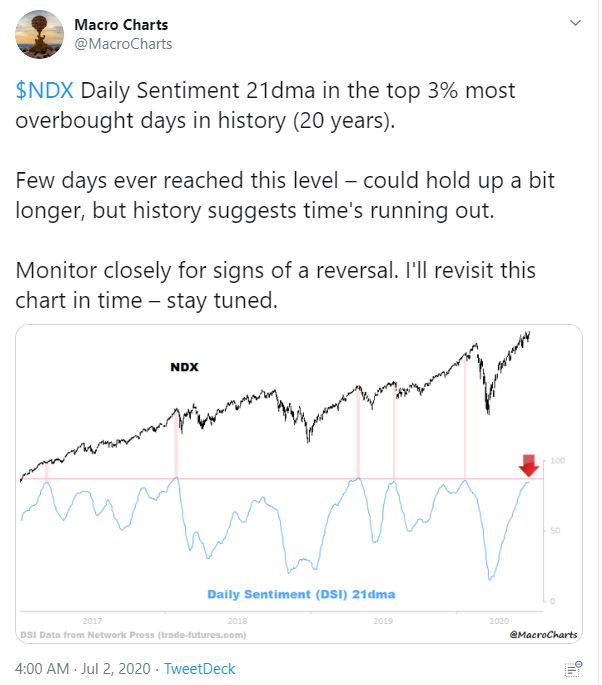
Macro Charts voiced a similar warning on the NASDAQ. Stay cautious, but wait for the downside break before turning too bearish.
A long-term monthly chart of the NASDAQ 100 reveals that the index is testing a key rising trend line. The advance is likely to stall despite the bullish development of the latest new highs.

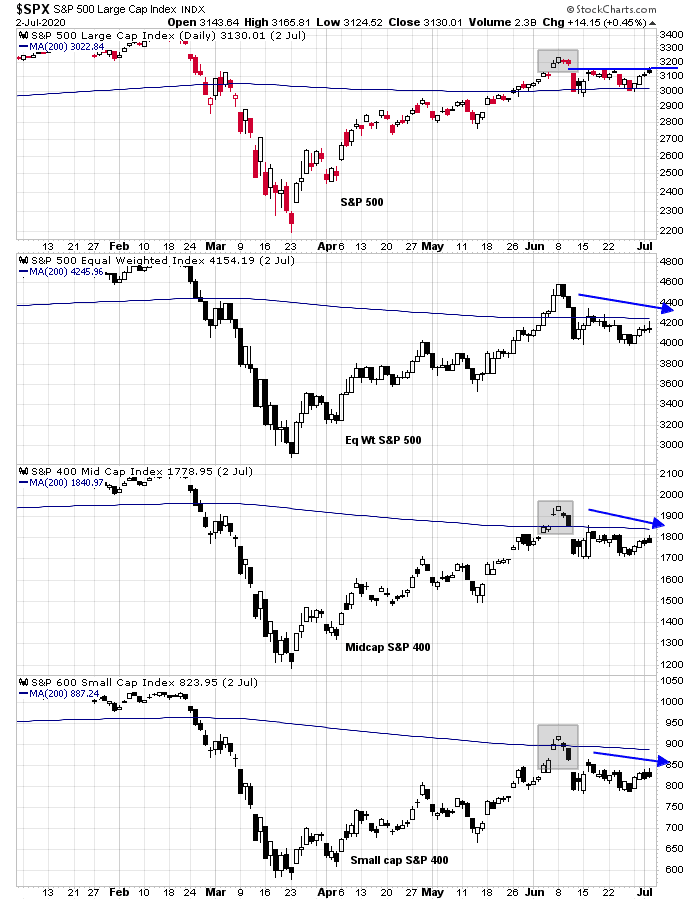
Trouble under the hood
If we were to move beyond the NASDAQ leaders, the chart patterns of mid and small cap stocks are cause for concern. The chart below shows the S&P 500, the equal-weighted S&P 500, the Midcap S&P 400, and the Small cap S&P 600. Three interesting patterns emerge from this analysis.
- All indices, except for the equal-weighted S&P 500, show a bearish island reversal.
- All of other indices show a pattern of lower highs even as the large cap S&P 500 rallied up to test resistance at 3150-3160.
- All of the other indices are below their 200 dma, while the large cap S&P 500 is holding above its 200 dma.
The pattern of lower lows and lower highs in the percentage of stocks above their 50 dma is another worrisome sign.
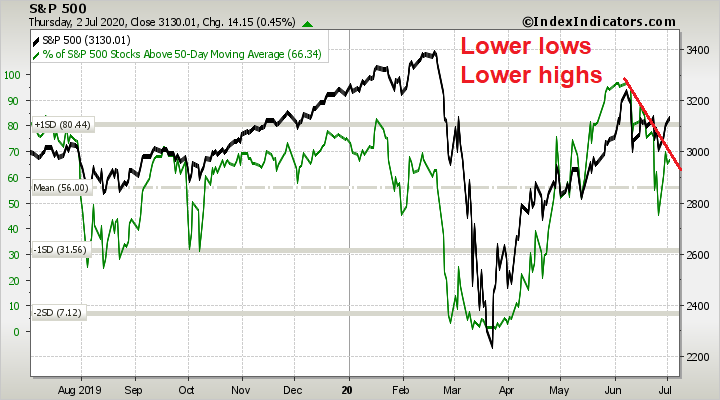
These are all signs of trouble under the hood, but they are only warning signs that will stay “under the hood” until the bears can muster a downside break in the major market indices.
Top of the range
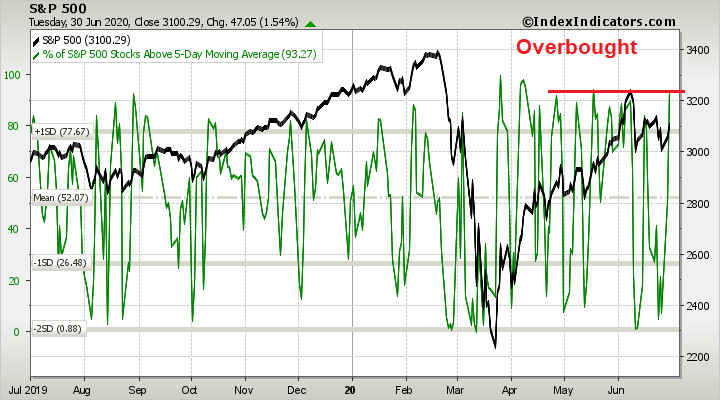
Short term breadth is overbought and the market is due for a pullback. The confluence of bearish intermediate term internals and overbought readings argue for a range-bound market, where we are at the top of the range.
The stock exchange was closed on Friday July 3, but the futures market was open. Equity futures closed Friday in the red. While the after-hour futures is thin, Friday’s market action is nevertheless an indication that the bulls failed yet once again at a key resistance level.

My inner investor remains neutrally positioned at the asset allocation targets specified by investment policy. While he is cautious for fundamental and valuation reasons, he is mindful of the possibility that we are witnessing the start of a market bubble that could take stock prices to heights that he hasn’t imagined.
My inner trader is bearishly positioned. His base case scenario is the market will stay between 3010-3020 on the downside and 3150-3160 on the upside. Until the market breaks out from that range, he will endeavor to buy the dips and sell the rips.
Disclosure: Long SPXU
I quote Ravindra from last night who makes good points. I agree with Ravindra that the Biden candidature represents a complete unknown for now, Trump should be given the benefit of the doubt. Well, a Biden Presidency means higher corporate and individual taxes. We know that for sure (Lol). Nothing new there.
Perhaps stocks do have a shot at reaching unimaginable highs in the next quarter, as the “inner investor” is referring to.
Ravindra says:
July 4, 2020 at 8:45 pm
We know Mr. Trump. We know his policies. We don’t really know Mr. Biden. The odds may change dramatically when he lays out his vision, his choice for VP and how people perceive his mental agility and acuity (phone ringing at 3 am). I think he will be torn between his deep beliefs and what progressives want him to be. How he handles that will be critical. Debates pose an existential crisis for him. Media cannot hide his gaffes.
The failure of Bernie/ Warren implies that Democrats are not ready for a big push to the left. Left will be very unhappy if they don’t get someone like Warren.
So, relax and enjoy till the campaign really begins. And we will see what polls, pollsters, betters and the voters say and do. Till then, I am staying with stocks I believe will perform better in the new economy.
Overlooked this one from last Monday-
https://www.bloomberg.com/news/articles/2020-06-29/canaccord-s-dwyer-says-buy-the-dip-boosting-s-p-500-forecast
‘Equity pullbacks such as last week’s are worth buying because stimulus measures will help sustain a rebound in corporate earnings, according to Tony Dwyer.
‘The chief market strategist at Canaccord Genuity LLC increased his 12- to 18-month target for the S&P 500 to 3,300 from 3,000 while boosting the 2021 profit estimate to $165 a share from $150. The new projection represents a roughly 9% gain from the benchmark’s current levels.’
There is also a bullish island reversal in early April at around S&P 500 2550. This is now an open gap that hasn’t been filled.
I live in a very blue city and very blue state and my neighbors are pissed at our local leadership or their lack of leadership. The unscheduled, unapproved 4th of July celebration (we had a stay at home order by our Gov) went into 3am last night. Sounded like a war zone, the entire street is filled with garbage and leftover empty firework casing and they are huge. The streets are blocked all night with loud music and partying with drugs and liquor; not one police officer in sight.
I see my neighbors and left leaning friends staying home this Nov. There are zero Biden flags or signs on the window that I can see. I still see Bernie flags all over my neighborhood.
The reason for the market confusion of experts is the speed and amount of Fed and fiscal stimulus that has happened. In previous bear markets, the economy turns down, the Fed is slow to react with too little too late until finally a big government plan is enacted that turns the economy up. The bear market ends after going down for a year.
After the 2008 GFC, the Fed egg-heads have been planning what to do if a recession hits when you are at zero interest rates. I have kept a 2012 speech by Bernanke that talks about ‘helicopter money’ to be sent out as a last resort. Well they were prepared and sent the ‘helicopter money’ checks out in double time.
The amounts are staggering. With the jobs losses there was a 17% decline in wages in the fives months from the beginning of the year to the end of May. But, personal incomes jumped the most in history, 12.3%. How the heck??? Well, government programs for individuals went up 228%.
Last year the average unemployment benefit was $387 a week. After the Covid, the government topped that up by $600 a week plus more if the layoff was after the virus hit. Laid off low end service workers are making more than double their normal wages. Good for them. I’m just saying, this is why we might have had a one month severe bear market and then onward and upward.
The speed of the Fed and government response is unlike anything veteran portfolio managers have experienced. Young, Robinhood day traders had no fear.
Many of these programs for the unemployed end after July. That might cause problems.
KEn,
Re: The Fed liquidity and Congress stimulus
That’s what some of us have been saying for a while now. The question is at what point does the weight of sinking Covid-19-infected economy outweigh the lift provided by the Fed+Congress?
Circa, early part of last decade, now discredited analyst Marc Faber talked about QE infinity. He was right.
You and me and others should pay heed to the evidence that we are in a new paradigm.
Do you still believe that we are now in a “moonless world”? I think the paradigm changed from a moon to thousand brilliant suns (= More QE, faster QE and QE until the cows come home). The US Fed has discovered a new vaccine against deflation!
Yes, one day, QEs will stop working and fiat money will be discredited. I have no problem believing that idea (it has been historically true over the millennia). We do not know when, but the music is still playing.
The market cycles you talked about also have an inflation component to them. Like a stupid fool I have believed that inflation is not dead in the water. I have been waiting now for good part of three decades for inflation to rear its ugly head (I have now changed my mind about it after three decades, Lol).
To be sure, there will be 50% swings in the market. This is true historically. The question is how would US Fed reserve use its powers to stave of collapse of the US economy. The US Fed in its tool box has rumored to have non-conventional means. If I have to guess, the next set of tools would be more and greater financial repression (Thanks Cam for the clarification), more negative real and nominal interest rates and outright equity purchases, making gold illegal to own.
History shows that most of the above may be plausible. Let us pay heed to changing paradigms.
Are there other “tools” that may be out there, that we should be prepared for (Yes, war is there)?
I particularly identify with:
“Like a stupid fool I have believed that inflation is not dead in the water. I have been waiting now for good part of three decades for inflation to rear its ugly head”
The recent huge surge and then pullback in many industry ETFs has been head-spinning. From May 16 to the peak on June 8 and then to today is shown in this chart of the U.S. Bank ETF.
https://tmsnrt.rs/36vuKQT
It went up 40% in three weeks (not a misprint) and then dropped 25% in the next three weeks to Friday. Still 14% over its May 16 starting price.
Many cyclical industry indexes have had similar ups and downs. Maybe the blow-off June 8, bubble-like peak has seen a pull-back large enough that allows for them to have a positive pathway going forward. If we hold at these levels for these cyclical industries, it’s possible a new bull market has started.
On the other hand, if we go below the May 16 starting point, it puts the whole turnaround in doubt with the bear market likely reasserting itself.
Could go either way.
Five charts of alternative data, courtesy of CNBC:
https://image.cnbcfm.com/api/v1/image/106601425-1593698565838-20200702_apple.png?v=1593698643&w=678&h=413
https://image.cnbcfm.com/api/v1/image/106601435-1593698703311-20200702opentable_with_note.png?v=1593698739&w=678&h=413
https://image.cnbcfm.com/api/v1/image/106601453-1593701134390-20200702_str.png?v=1593701149&w=678&h=413
https://image.cnbcfm.com/api/v1/image/106601438-1593698817861-20200702_tsa.png?v=1593698850&w=678&h=413
https://image.cnbcfm.com/api/v1/image/106601446-1593698910286-20200702_mba.png?v=1593698928&w=678&h=413
Not a picture of an economy in great shape but human activity trending in the right direction and housing a bright spot.
What historical analogs totally miss is the difference from previous episodes. The scale and speed of monetary and fiscal response have been unprecedented. And more is likely coming. A bet against that is not in my playbook. If one ignores the noise, the trend remains up. When some macro or fundamental event or events occur, one must reassess.
Digital transformation is inevitable and occurring at almost warp speed. Neither Trump nor Biden can stop that. Why not think about markets in a different way than we have before and invest accordingly?
Interesting set of graphs, at the root of which is Helicopter money.
Let us see when the next set of money drops is forthcoming.
Thanks for the insights and charts, Mark, Ken and Ravindra. That is all very interesting.
I think with all the QE and government stimulus we can call this the Powell Put on the market. But what will make the Fed pull back its stimulus and start cranking up rates? INFLATION.
At some point all this money creation is almost certainly going to lead to inflation. And, if it isn’t inflation that eventually blows up this bubble it will be a sliding U.S. Dollar. The Fed will have to support the Dollar if it starts a big tumble. If other countries are printing as fast as the Fed we can forget about a dollar collapse – but are they?
Keep your eyes on the price of Gold and the Dollar for the early clues.
D.V. Like you, I keep expecting to see inflation come back especially during the QE of the Obama years. Although inflation is dead right now I still am looking in the rear view mirror for the Inflationmobile to come charging up on us from behind.
Wally
The money printing has not really gotten into general circulation and hence there is no inflation, as yet.
The graph shown by Liz Ann Saunders of Fed assets versus “velocity of money” shows that the “velocity of money” was negative. This was published and posted here several weeks/months ago.
QE money has shored up asset prices to a certain extent. The PPP money may be true helicopter money in the hands of the American people. That said, most wealthy Americans never needed PPP. The wealthy needed protection of assets that QEs provided in ample amounts. Sure enough, more PPP money is being talked about (buying time until there is a vaccine).
Turn the clocks back to 2008. QEs back then arrested rampant fall of stocks that helped wealthy Americans. Fools like me waited to buy stocks back then thinking that the US Fed would let a normal market cycle play out with a 1929 style depression, letting cash holders ample time to buy assets. That really never happened.
What I am writing here is dead opposite of RxChen2. Holding cash is what is critical. Dollar cost average into your cash reserves (opposite of dollar cost average into stocks).
I hate to say this but the money printing is all about the wealthy manipulating the system. John Paulson should have never opened the flood gates of money circa 2008, after Lehman Bankruptcy.
Ravindra is right, by many metrics gold is cheap. I would like to see gold at 5k per oz. in my lifetime. I have written about gold in several earlier posts.
Thanks for the explanation D.V. But it does seem to me that when ever the Fed injects funds into bonds or what ever much of that money always finds its way into stocks.
Inflation is a big risk. Gold and TIPS (cheap at the moment) deserve a serious look to hedge. I find that cost of each service I have used has gone up post opening. Cam’s warning regarding margin pressure is appealing. Focus then on businesses that can pass on the extra costs.
We should take into account that February was a winter statistic and would be lower on summer air travel and hotel as well as home sales. So today’s number is worse.
Interesting technical insight from Steve Deppe here. https://twitter.com/SJD10304/status/1279837602917388288?s=20
Very interesting. Thanks for sharing.
No problem DV!
From May 11-
https://www.marketwatch.com/story/why-morgan-stanley-analysts-says-you-can-bank-on-strong-economic-recovery-from-coronavirushint-u-shaped-recoveries-really-never-happen-2020-05-11
How many of us took it seriously then? Almost two months later, it seems prescient.
K.I.S.S.
Keep it Simple ___.
After reading all the comments and analysis (mostly useful) I have come to a conclusion – It is very difficult to call tops and bottoms in the market all the time correctly. History is littered with examples: Granville, Bob Prechter, Hussman etc.
So what is the solution? A simple crossover of two moving averages would have kept you in the right side of the market this whole year. Feel free to experiment with 10 and 30 closing or any combination which you feel comfortable with.
This simple solution helps you be on the right side of the market and unclutters your mind of extraneous analysis. Also, when Cam’s excellent fundamental analysis confirms the signal of the simple moving averages you can go for the fences.
Granted you will not have the bragging rights to call the exact date and time of the exact top or bottom but is that really that important?
Fewest U.S. CoronaVirus deaths since early March.
https://noqreport.com/2020/07/05/milestone-this-week-had-the-fewest-coronavirus-deaths-since-march/?utm_source=whatfinger
https://www.yahoo.com/news/time-china-decouple-yuan-us-093000362.html
This has the potential to significantly strengthen the USD and as a consequent depress all kinds of global asset prices (deflationary).
Money usually flows into king $ (and Yen) when crises hits.
China should wait for four months to see how their buddy Joe fairs in the election before taking drastic steps.
Not counting DJT out yet. Too early. Just my 2 c.
Thomas Bossert, former Homeland Security advisor to Trump, fears 500k deaths, since “once a state is over 1% prevalence, it becomes much harder to extinguish the flare up.” If he’s right, then it looks like the Republican Virus is here to stay.
https://twitter.com/TomBossert
Is that a cup-and-handle on the SPX – or just wishful thinking?
RX, there are some volume rules that go along with the cup-and-handle. I think they were satisfied but my volume data is flaky.
Looks like the market is about 6 S&P points or 668 Dow Industrial points from closing the island gap.
Update, the S&P 500 has closed the gap.
Speaking of ‘island’ moats, is there a statistical significance to them? I am just happy to move on.
S&P forward earnings estimates revised upward.
https://realmoney.thestreet.com/investing/stocks/s-p-500-earnings-estimates-spike-15365425?
Thanks, Wally. As a reminder, Ciovacco Capital recently reviewed instances where valuations remained elevated for extended periods of time. So valutation is always a concern – but don’t let that be the only reason to stay sidelined during what may be the beginning of another bull market.
Shanghai Composite +5.71% to a 2-year high. ASHR +10.63% on high volume over the past four hours. More evidence we’re witnessing the onset of a new bull.