Preface: Explaining our market timing models
We maintain several market timing models, each with differing time horizons. The “Ultimate Market Timing Model” is a long-term market timing model based on the research outlined in our post, Building the ultimate market timing model. This model tends to generate only a handful of signals each decade.
The Trend Asset Allocation Model is an asset allocation model which applies trend following principles based on the inputs of global stock and commodity price. This model has a shorter time horizon and tends to turn over about 4-6 times a year. In essence, it seeks to answer the question, “Is the trend in the global economy expansion (bullish) or contraction (bearish)?”
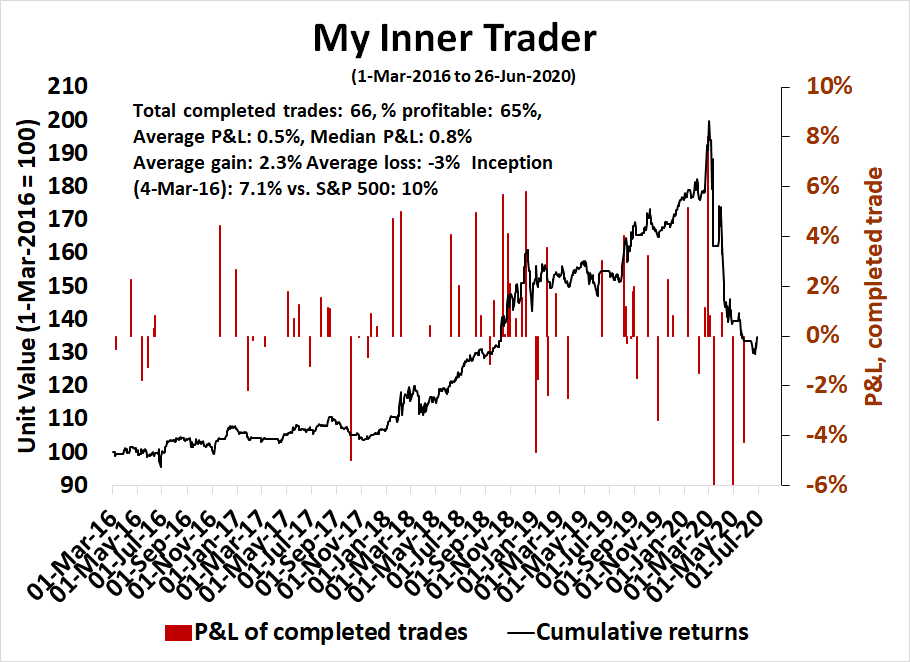
My inner trader uses a trading model, which is a blend of price momentum (is the Trend Model becoming more bullish, or bearish?) and overbought/oversold extremes (don’t buy if the trend is overbought, and vice versa). Subscribers receive real-time alerts of model changes, and a hypothetical trading record of the those email alerts are updated weekly here. The hypothetical trading record of the trading model of the real-time alerts that began in March 2016 is shown below.
The latest signals of each model are as follows:
- Ultimate market timing model: Sell equities
- Trend Model signal: Neutral
- Trading model: Bearish
Update schedule: I generally update model readings on my site on weekends and tweet mid-week observations at @humblestudent. Subscribers receive real-time alerts of trading model changes, and a hypothetical trading record of the those email alerts is shown here.
Subscribers can access the latest signal in real-time here.
Bearish tripwires
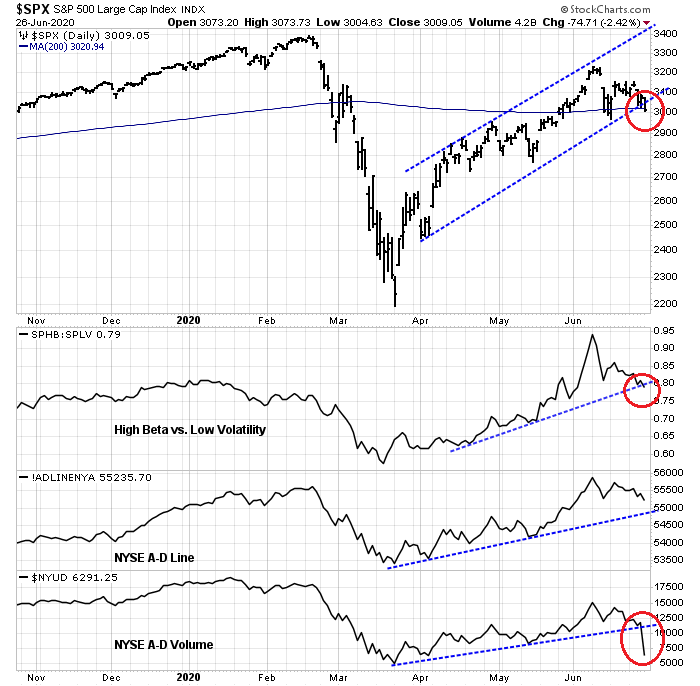
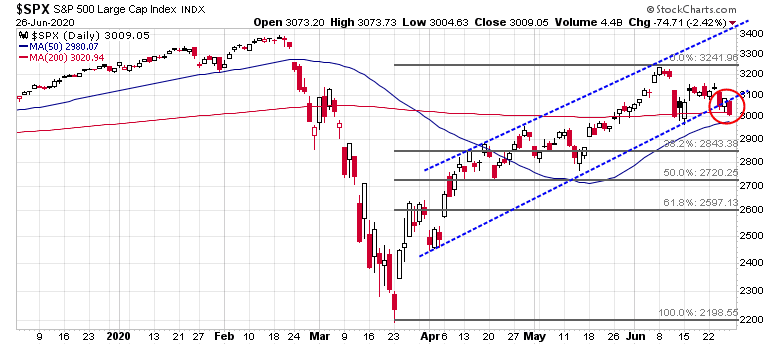
I have been cautious about the equity outlook for several weeks, and the market triggered several bearish tripwires last week. First, the S&P 500 violated a rising trend channel, and fell through its 200 day moving average (dma). Other trend line violations observed were the high beta to low volatility ratio, which is an equity risk appetite indicator, and the NYSE Advance-Decline Volume Line, though the NYSE A-D Line remains in an uptrend.
Is this the beginning of a minor pullback where the market consolidates sideways, or the start of a major correction?
Shallow pullback and consolidation?
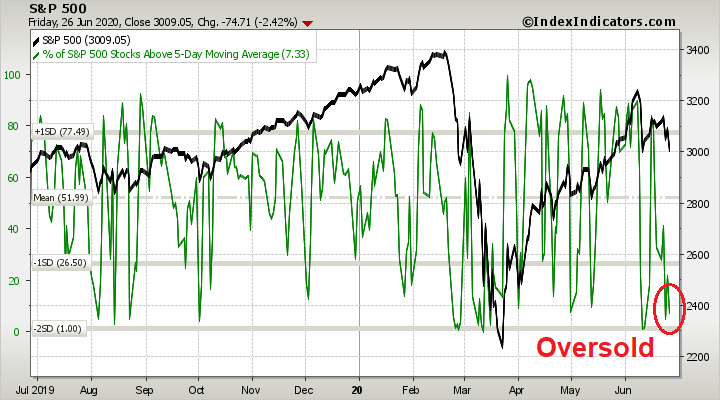
Here is the case for a minor pullback. The market is becoming oversold in the short run, and due for a bounce.
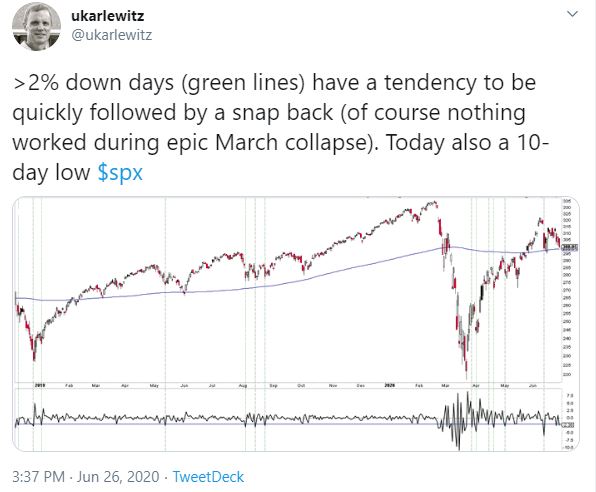
Ukarlewitz observed that heavy sell-offs like Friday’s -2.4% weakness tend to mark the end of short-term corrections. The exceptions are downdrafts that are part of a major correction like the one we experienced in February and March.
These conditions set up circumstances where the average calls for a relief rally, but with an extreme tail-risk of further downside. How should play those odds?
Long-term warnings
Let’s consider the longer term picture to assess the chances of a major downdraft. I have highlighted plenty of warnings, or bearish setups, in the past few weeks. Many analysts have observed that the equity-only put/call ratio (CPCE) has been extremely low, indicating complacency. Less noticed has been the index put/call ratio (CPCI) has become elevated, indicating cautiousness. This sets up a bearish divergence between retail traders, who mainly trade equity options, against professionals who hedge with index options. Past extremes in a dumb (retail) money/smart (professional) money dichotomy has seen the market either correct, or experience difficulty advancing.

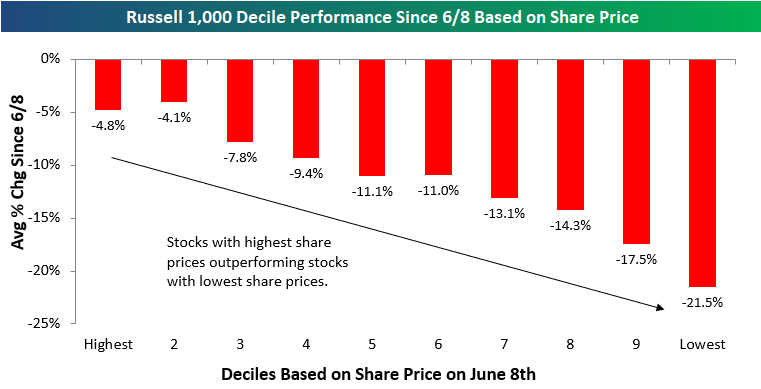
Arguably, the weakness from the June 8 top was an unwind of retail speculative fever. Bespoke found that the returns to the share price factor fell almost monotonically by price decile. The stocks with the smallest share prices did the worse, while the ones with the highest share prices fell the least. This is an indirect signal that the small retail speculative traders, who tend to favor low-priced stocks, got long and hurt in the pullback.
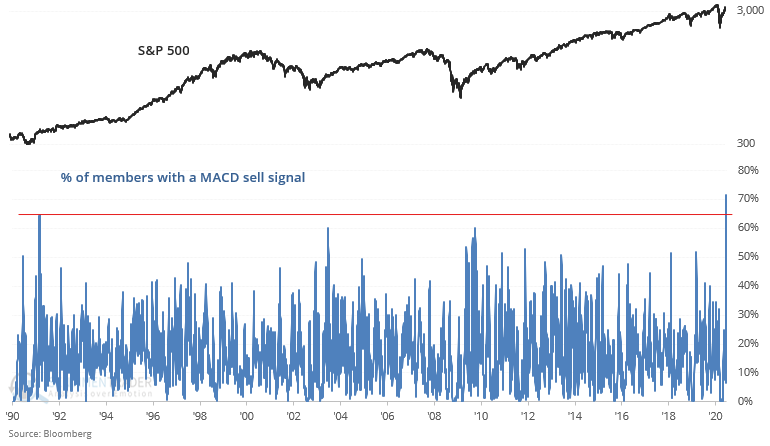
Troy Bombardia at SentimenTrader also issued a number of warnings. The percentage of stocks with MACD sell signals were spiking across the board, indicating a broad technical deterioration in market internals. These signals were seen across a broad swath of indices: the S&P 500, NASDAQ, Euro STOXX 50, and Nikkei.
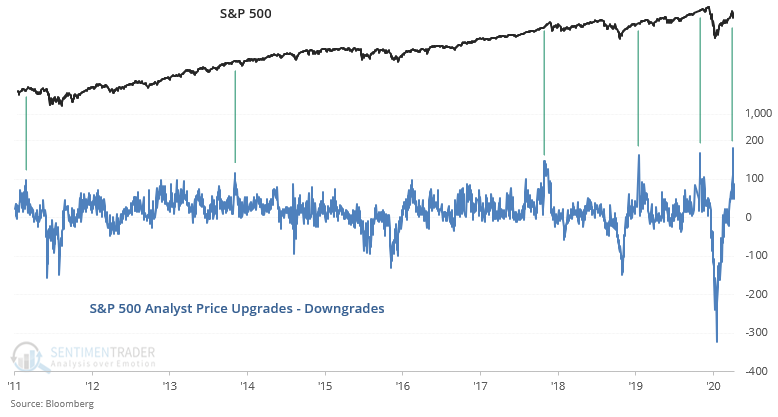
He also observed that Street analysts have been chasing the rally by upgrading their price targets in a FOMO-like stampede. Such instances have usually been resolved by pullbacks and corrections in the next 2-3 months.
An exhausted Fed?
In the past few weeks, a number of market commentators have attributed the rally from the March low to Fed intervention. While I have not been a fan of singular reasons for market moves, there are good reasons why Fed induced liquidity can buoy asset prices. Moreover, there is an empirical relationship between the size of the Fed’s balance sheet (blue line) and stock prices (black line).
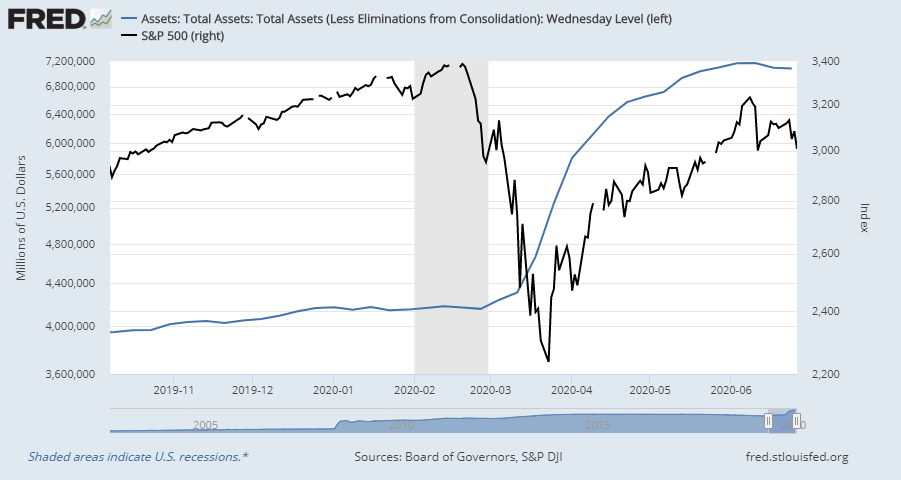
We can see that Fed’s balance sheet contracted for a second week in a row, and the contraction was attributed to the unwind of USD swap lines by foreign central banks. Open market operations continue to inject liquidity into the market. The latest week’s report shows that Fed holdings of Treasuries and other paper rose by 53.2 billion to 6.1 trillion, though that represented a deceleration from the previous week.
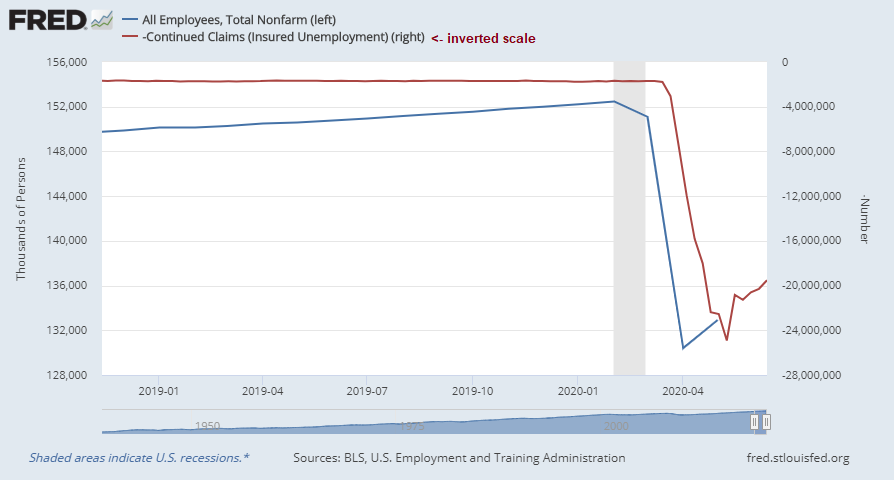
None of this means that the Fed is about to stop supporting the market with additional liquidity. Jerome Powell has made it clear that the Fed is focused on normalizing employment levels while asset price levels are only a secondary consideration (see A bleak decade for US equities). There is a Powell Put, but only indirectly. Recent continuing jobless claims figures (red line, inverted scale) are pointing to further improvement in the upcoming June Employment Report on July 2. While the recent surge in COVID-19 cases will undoubtedly be a concern for the Fed as they could result in a second wave of unemployment, the expected improvement in Non-Farm Payroll will make for a second consecutive month of “less awful” jobs numbers. These conditions are unlikely to prompt Fed policy makers to press harder down on the quantitative easing accelerator, and that could act as a brake on stock prices.
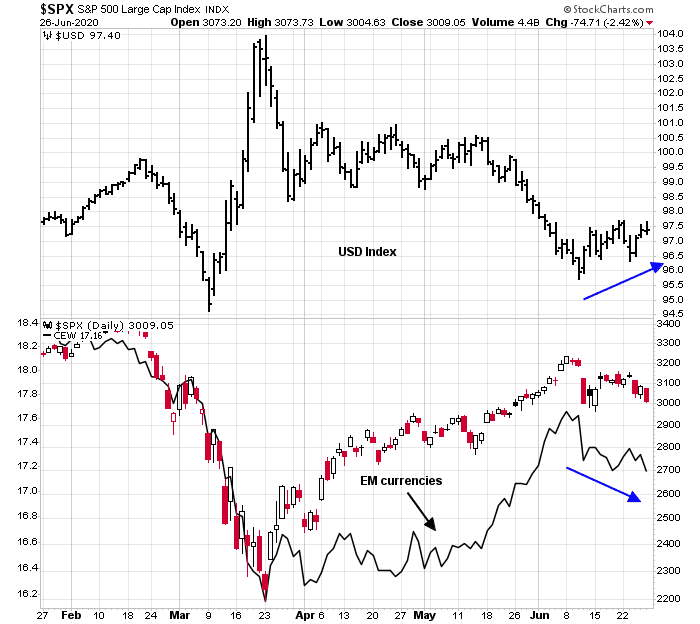
The unwinding of foreign central bank swap lines are indicative of a reduction of offshore USD shortages, and this development could also create some headwinds for equity prices. The swap line unwind coincided with the greenback catching a bid during the same period, which has also manifested itself in EM currency weakness. EM currencies are the most vulnerable to offshore dollar funding pressures and act like canaries in the cross-asset risk appetite coalmine. The combination of USD strength and EM currency weakness raises a warning flag for the price of risky assets like stocks.
The week ahead
So where does that leave us? Is this just a minor market setback, or the start of a major correction? I am leaning towards the major corrective scenario, but I am keeping an open mind as to the outcome.
The market could see further selling pressure on Monday and Tuesday from portfolio rebalancing flows as managers sell equities and buy bonds to re-weight their portfolios back to their targets. While we may see some further minor violations of support levels, the bulls need to hold the line here. The next support level for the S&P 500 is the 50 dma at 2980, with further support at the Fibonacci retracement level of ~2845.
My inner investor is neutrally positioned at his investment policy asset allocation targets. My inner trader remains short the market.
Disclosure: Long SPXU
Houston, San Antonio, and Austin, TX are reporting ICU capacity is close to limits in major hospitals. Local message boards are reporting patient transfers to other area hospitals that still have a few ICU units left.
My primary concern is that current policies are not curbing hospital admissions.
Reference:
https://austin.maps.arcgis.com/apps/opsdashboard/index.html#/0ad7fa50ba504e73be9945ec2a7841cb
https://www.tmc.edu/coronavirus-updates/tmc-daily-new-covid-19-hospitalizations/
https://dallascityhall.com/Pages/Corona-Virus.aspx
My locale’s restrictions are based on a 7 day moving average of hospital admissions, which means the city’s response will be lagging by at least 7 days – most likely more since it’s using averages. Its also not based on the strategies that have successfully eliminated the infection.
My forecast is that major Texas cities will close businesses either this week or the following in an official or unofficial capacity. There is also now a possibility of much more disastrous outcome.
Satire alert!!!!!
Alex1, “Come on, it’s just a Flu.” “Masks are infringing on my Freedoms.”
File under Famous Last Words.
I see runners running with N95 on. As a weekend warrior, that cannot be good for the respiratory system. I also see drivers wearing mask with no passengers. Only time will tell if people wear mask for an extended period of time will have other respiratory problems. I only wear face mask when shopping at Safeways or Trader Joes and it gives me a huge headache. I go in, shop, and get the heck out and take off my mask ASAP.
Mark,
Masks are not Panacea. They are a deterrent to aerosolized particles going too far if you cough or sneeze, or if someone coughs or sneezes near you. Good thing you are wearing your mask when out and about in public.
While not minimizing or negating you experience with headaches due to a mask, I have been wearing masks on a daily basis for the last 12 years now. I usually wear Level-III surgical masks, as hundreds and thousands of my medical colleagues do on a daily basis. We have still to find any issue with breathing or respiratory problems. No one is being asked to wear it all the time. And like you said wearing a mask while driving is silly. However it could be because once you put it on, you might become used it on and are lazy. Also I have left the mask on because I am going from one location to another where mask will be required and I don’t want to forget to wear it. I am sure not many, (i.e. out side of a hospital/healthcare setting), including the runners with N95 (which is overkill, a regular mask will do), understand that N95 is a fitted mask. You have to be fitted by a professional for it to work as it’s intended. In other words, you are not getting Less Oxygen during regular usage, unless your mask was properly fitted. And most people don’t have a complete seal that would make getting oxygen a problem.
Masks are there to protect aerosol that is produced during normal talking or screaming and can travel. A mask itself is a just one part of the equation in slowing down the spread so that we can all go out. We still have to do other things, i.e. 6 ft apart, wash hands often, etc.
“If this trend continues, our hospital system capacity will become overwhelmed, leading us to make difficult choices of delaying much-needed non-COVID care to accommodate a greater number of COVID patients,”
https://www.houstonchronicle.com/news/houston-texas/houston/article/Houston-ICU-capacity-could-be-exceeded-Thursday-15363724.php
Alex1, last couple months people were so scared of COVID19 that they have not visited hospital even in need of medical care. I believe that was the reason that some hospital were laying off staff. I certainly do not want our hospital overwhelmed but there are other diseases and medical problems we all are faced prior to COVID19. Personally, I am more concerned with the mental aspect of shelter in place and face mask. There is a bigger problem out there, suicide. I believe COVID19 jumped the line and that is unwarranted.
Thanks Mohit. Most people are not in the medical industry and don’t have the mask that you use and professionally fitted. You have the discipline not to touch the mask or move it around your face; that is not the case out there. It is hilarious to see what people do with their mask. I can bet that most people will reuse the mask many times. As long as it looks kinda white (hanging on the rear view mirror), it is good for a reused. Improper use of face mask will not slow the spread, it may increase the spread.
I do agree with washing hands frequently and don’t touch your face.
One way to gauge the severity of the correction is to observe the price actions of high octane ETFs, like VGT, SMH, IGV, FDN, HACK, SKYY, IPAY, IBUY, XBI, ARKK, ARKG, ARKW, etc. If these break down, then it is more likely correction will be more substantial. Meanwhile, you can trade reliably GLD and GDX. Does $lumber signal a better housing sector and by extension a better economy going forward?