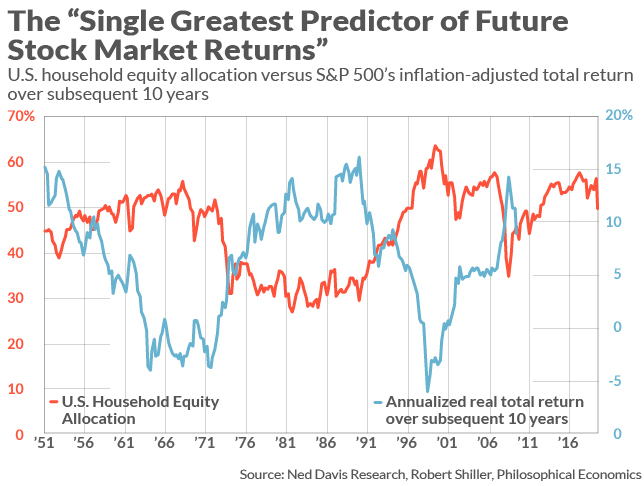
Some analysis has recently emerged pointing to a bleak decade for equities, and US equities in particular. Mark Hulbert highlighted a model outlined in the Philosophical Economics blog, entitled “the single greatest predictor of future stock market returns”. The model is based on US household allocation to equities and uses the levels as a contrarian indicator.
Notice that the household equity allocation is the flip side of the coin from household cash — sometimes referred to as sideline cash. Higher cash levels are therefore bullish and, sure enough, household cash allocations have risen markedly as equity allocations have fallen. But backtesting has shown that household equity allocation is the better predictor. In fact, according to Ned Davis Research, it is able to explain 77% of the variation in the stock market’s return in all 10-year periods since 1951. I am aware of no other indicator that does as well.
Hulbert continued:
Consider a simple econometric model I constructed from quarterly household equity allocation data since 1951 and the stock market’s subsequent inflation-adjusted total return at each step along the way. Based on the year-end 2019 allocation level, that model projected a 10-year inflation-adjusted return of negative 1.3% annualized.
That -1.3% expected real return was based on year-end 2019 data. Q1 2020 figures are in, and we all know what happened in March, namely the COVID Crash. According to Hulbert, projected annualized real returns improved to a positive 2.3% based on March 31 levels. Fast forward to today, the market has recovered most of its losses, and expected inflation-adjusted returns are undoubtedly negative again.
The news is even worse than that. The projected returns are calculated before fees. If an investor were to create a balanced portfolio consisting of some stocks and bonds. Add in some trading costs and management fees, diversification and frictional costs could easily subtract another 1%-2% from overall returns.
The Bridgewater warning
Bloomberg reported that Ray Dalio’s Bridgewater Associates has a different take on long-term equity returns. The firm is projecting a possible “lost decade” for US equities:
A reversal of the strong growth seen over the years in U.S. corporate profit margins could lead to a “lost decade” for equity investors, Ray Dalio’s Bridgewater Associates warns.
The margins, which have provided a big chunk of the excess return of equities over cash, could face a shift that would go beyond the current cyclical downturn in earnings, Bridgewater analysts wrote in a note to clients dated June 16.
“Globalization, perhaps the largest driver of developed world profitability over the past few decades, has already peaked,” the analysts said. “Now the U.S.-China conflict and global pandemic are further accelerating moves by multinationals to reshore and duplicate supply chains, with a focus on reliability as opposed to just cost optimization.”
The pandemic-induced collapse in demand has already resulted in a huge fall in profit margins in the short term, the analysts added.
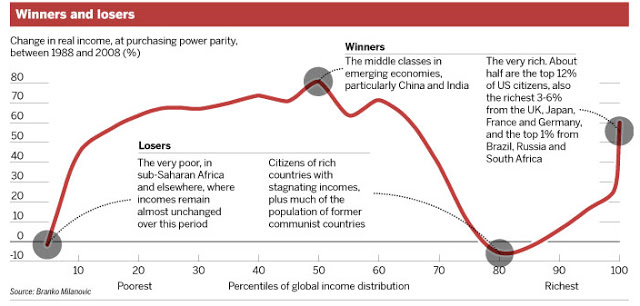
The Bridgewater thesis is based on margin mean reversion. Branko Milosovic’s famous elephant chart showed that the winners of globalization were the middle class in the emerging economies, and the top 1% of population, who engineered the globalization boom.
The reshoring trend outlined by Bridgewater isn’t just attributable to the desire to duplicate supply lines and focus on reliability over cost optimization. Bloomberg reported that the Trump administration’s non-tariff barriers against Chinese competition have prompted a scramble by American companies to comply with the unexpected fallout of new legislation.
Aerospace, technology, auto manufacturing and a dozen other industries are engaged in a lobbying frenzy ahead of an Aug. 13 deadline to comply with a far-reaching provision that was tucked into a defense spending bill two years ago.
The broadly written defense law could implicate virtually all companies that count the federal government as a customer, including global subsidiaries and service providers deep in a firm’s supply chain. Excluding subcontractors, more than 100,000 companies provided $598 billion in goods and services directly to the U.S. government last year, according to a Bloomberg Government tally.
To date, measures taken by the Trump administration against Huawei and other Chinese tech companies have been aimed at cutting off their access to American components and networks. This law would ratchet up the pressure even more, putting the onus on U.S. government contractors to comb through their businesses to ensure they have no connections to banned Chinese companies.
Just as America weaponized its dominance in finance to force any bank doing business with sanctioned entities access to the US banking system, this law weaponizes the procurement process to deny any company doing business with Huawei and ZTE from business with America.
Section 889, part B, of the National Defense Authorization Act would require companies to certify that their entire global supply chain — not just the part of the business that sells to the U.S. government — is devoid of gear from Huawei, ZTE, Hikvision and other targeted Chinese tech firms.
The measure could apply to virtually all companies that count Uncle Sam as a customer, including subsidiaries and service providers deep in a firm’s supply chain. Excluding subcontractors, more than 100,000 companies provided $598 billion in goods and services directly to the U.S. government last year, according to a Bloomberg Government tally.
Imagine a company has a foreign office. That office will naturally have a phone system which connects to the local phone network. If the phone network has any component that uses Huawei equipment, the company is not compliant. That’s how far reaching these measures are.
There are alternatives to Huawei equipment. Singapore recently announced its decision to use Nokia and Ericsson to supply its 5G systems. They’re just more expensive, which puts pressure on margins.
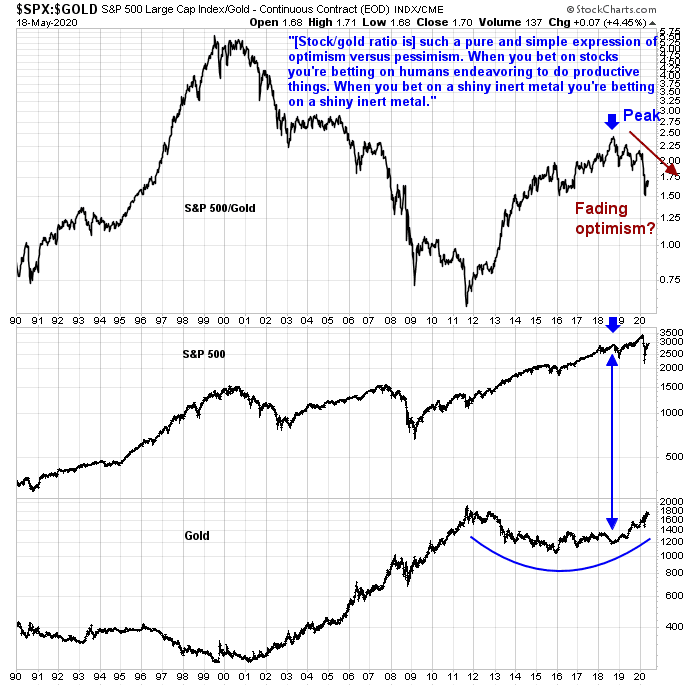
Gold as a confidence indicator
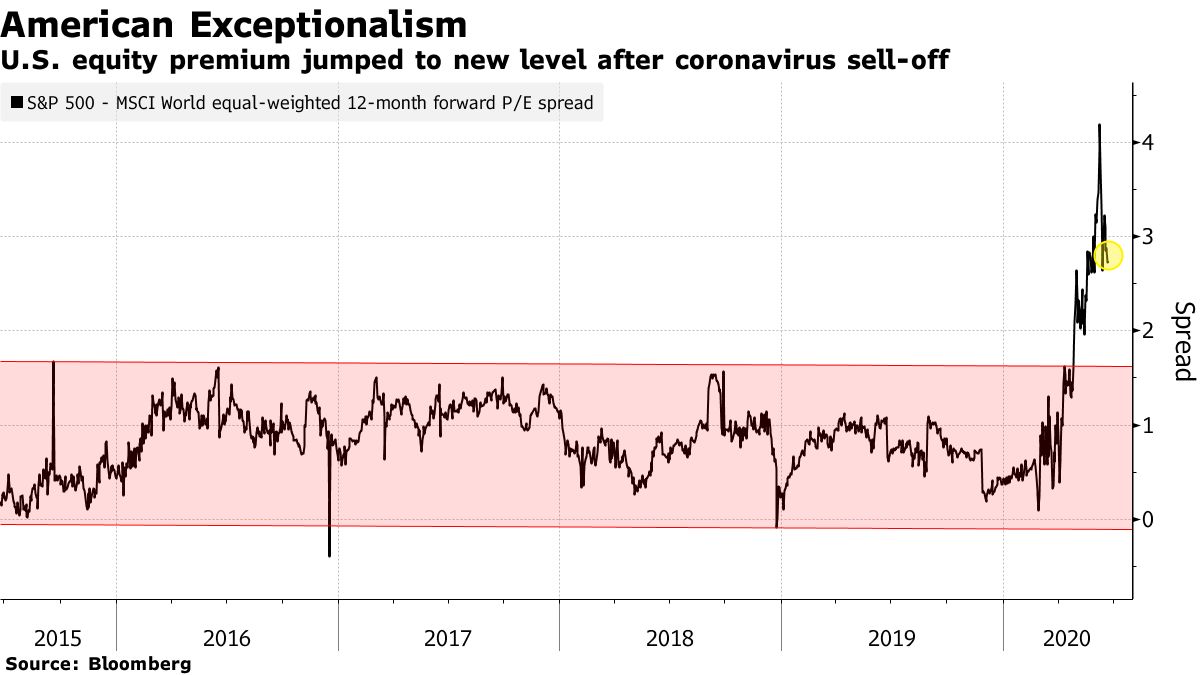
These low equity return expectations are consistent with my previous publication highlighting gold as a confidence indicator (see What gold tells us about confidence). The relative downtrend of the stocks to gold ratio is an ominous sign for long-term equity returns.
Here is one explanation for the lack of confidence. One of the bedrocks of long-term return expectations is valuation. While valuation tells us little about what stock prices will do over the next year, they are highly predictive of long-term returns. Global forward P/E ratios are back to dot-com like valuations.
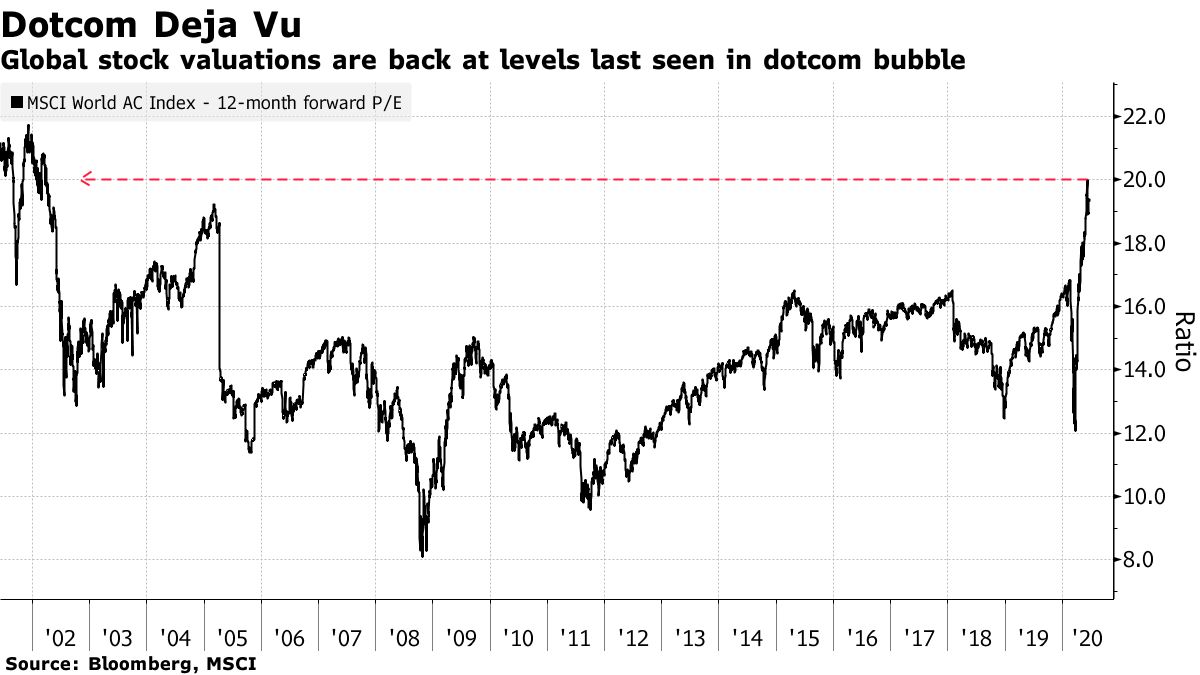
Much of the heightened valuation is attributable to US equities, which account for roughly half the weight of global stocks. But US equity valuations have soared against their non-US counterparts.
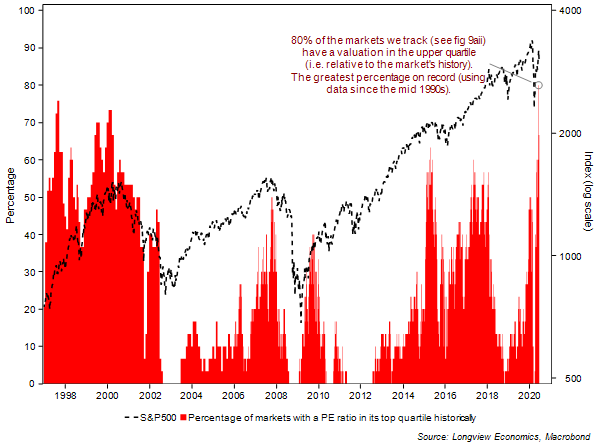
Equity overvaluation cannot be just explained by expensive US stocks, though. Bloomberg reported that Longview Economics found that “80% of the markets [they] track have a valuation in the upper quartile relative to the market’s history — the greatest percentage on record using data since the mid-1990s”. Everything is expensive.
It’s not just stocks that are expensive, bonds can hardly be described as cheap on an absolute basis. Austria recently issued another 100-year bond at a yield of 0.88%. The offering was well subscribed, which is another sign of a bond bubble.
In short, this is a low-return environment, and there are few attractive alternatives.
Where can investors hide?
This begs the question: Where investors can hide in such a low return environment?
Much of the answer depends on the degree of monetary accommodation that global central bankers are willing to provide. The intermediate term outlook is based on the Fed’s focus on unemployment irrespective of asset prices. Consider this exchange at the last post-FOMC press conference between Bloomberg reporter Michael McKee and Fed Chair Jerome Powell.
I came across a statistic the other day that amazed me. Since your March 23rd emergency announcement, every single stock in the S and P 500 has delivered positive returns. I’m wondering, given the levels of the market right now, whether you or your colleagues feel there is a possible bubble blowing that could pop and setback the recovery significantly, or that we might see capital misallocation that will leave us worse off when this is over?
Here is how Powell responded:
So, we — we’re not looking to achieve a particular level of any asset price. What we want is investors to be pricing in risk, like markets are supposed to do. Borrowers are borrowing, lenders are lending. We want the markets to be working. And again, we’re not looking to — to a particular level. I think our — our principal focus though is on the — on the state of the economy and on the labor market and on inflation.
The Fed is signaling a “whatever it takes” moment to bring down unemployment. The Fed has an array of tools to achieve those goals, such as asset purchases, yield curve control, and even negative interest rates. Translated, the Fed is willing to engage in financial repression. Other central banks are either following suit, or ahead of the Fed’s curve. The ECB has already experimented with negative rates.
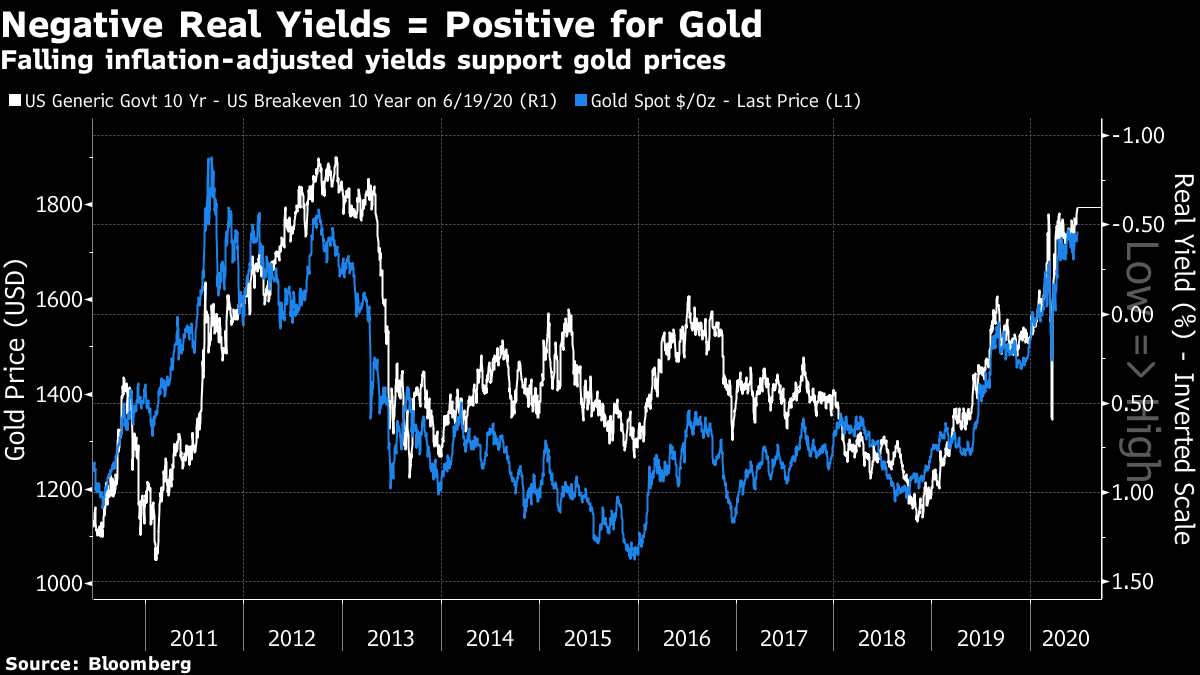
A bet for financial repression, at least for the next 2-3 years, is a bullish bet on gold. Historically, real 10-year TIPS yields (inverted scale) have been highly correlated with gold prices. As long as the Fed is willing to engage in suppressing rates and yield curve control, it should put upward pressure on gold prices.
Is it any wonder why the stock/gold ratio is falling? However, standard portfolio construction solutions call for the weight of gold in a well-diversified medium-risk portfolio to be no more than high single digit or low double digits percentages. I agree with that assessment. That means investors still need some exposure to equities as a source of growth.
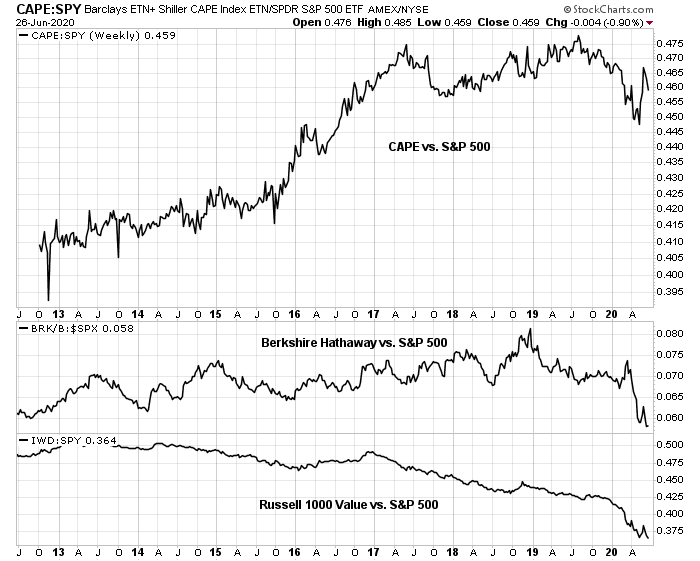
One option is boost long-term returns to consider beaten up value stocks. The growth to value performance ratio has gone parabolic, and the growth to value relationship is extremely stretched.
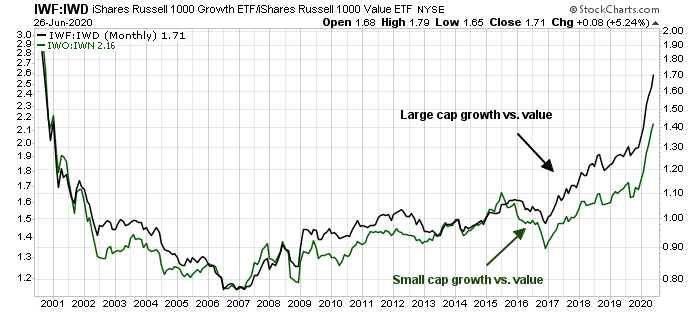
A commitment to value investing comes with two caveats. First, value style portfolios are generally overweight in financial stocks, and financial stocks don’t perform well under conditions of financial repression. As well, the growth/value ratio is still skyrocketing and showing no signs of a rollover. From a tactical perspective, it may be wise to wait for a pause and reversal of the ratio before making a full commitment to value investing.
There are a number of other alternatives for US investors considering the value style. One is Barclays Shiller CAPE ETN (ticker CAPE), which buys the top four cheapest sectors based on CAPE that exhibits relatively strong price momentum. Another is the shares of Berkshire Hathaway, which is not strictly value investing, but quality (wide-moat) companies at a reasonable price. Both CAPE and BRK have lagged the market in the past year, but they have outperformed the value style over the last few years. As well, the last time Warren Buffett was this widely ridiculed for his performance was in 1999, which was a year before the dot-com bubble popped. That said, Buffett has become so successful with Berkshire that the company has a size problem and it has trouble deploying its cash as efficiently as it did in the past. In effect, it has become a cash generative conglomerate, with a sizable position in Apple, and a large cash hoard.
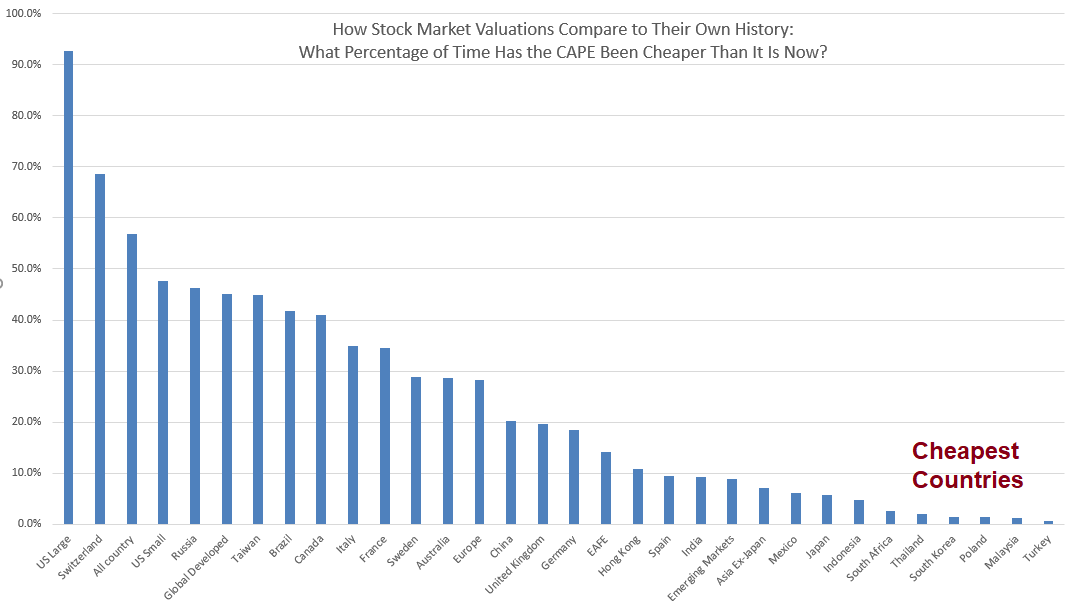
Another option for US equity investors is to look abroad. Rather than simply ranking countries by CAPE, which can lead investors into value traps, such as Europe where stocks appear cheap because of lower growth potential, Research Affiliates ranked country valuations relative to each country’s own historical range of CAPE. Based on this analysis, US large cap stocks are wildly expensive, with Switzerland coming in second place, and US small caps in third. At the other end of the spectrum, Turkey, Malaysia, Poland, South Korea, Thailand, and South Africa are the cheapest countries, in that order.
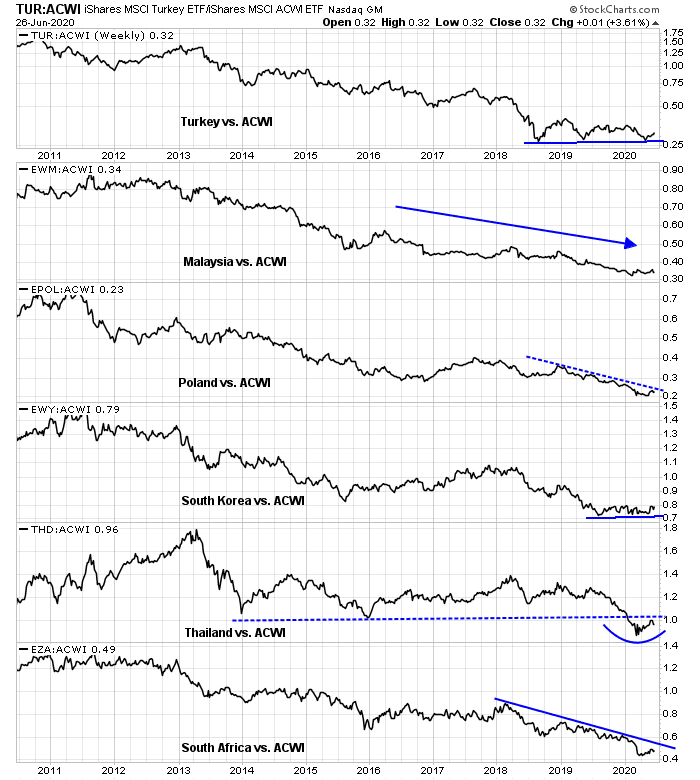
Before plunging into some of these small and somewhat illiquid markets, it’s one thing to buy cheap stocks and markets, and it’s another to watch the markets become cheaper as fundamentals further deteriorate, which is otherwise known as a value trap. To avoid that problem, we overlaid a relative price filter to look for price stabilization in order to avoid the value trap problem. Looking at the relative performance of these countries compared to the MSCI All-Country World Index (ACWI), Turkey and South Korea are the standouts. They have tested relative support and they are forming bases by consolidating sideways. The relative performance of Thailand may be constructive and bears watching. Thai stocks are trying to form a bottom after breaking a key relative support level. The other three are all in relative downtrends and should be avoided for now.
As well, the degree of non-US commitment will partly depend on the outcome of the November elections. Current polling indicates a Biden lead over Trump, and recent victories by progressives in primaries is likely to push the Democrat agenda leftward. A Blue Wave victory in November, which is becoming the base case scenario, will mean MMT-style stimulus, and increased US corporate taxes. These developments will be USD negative, and non-US equity, especially EM, positive.
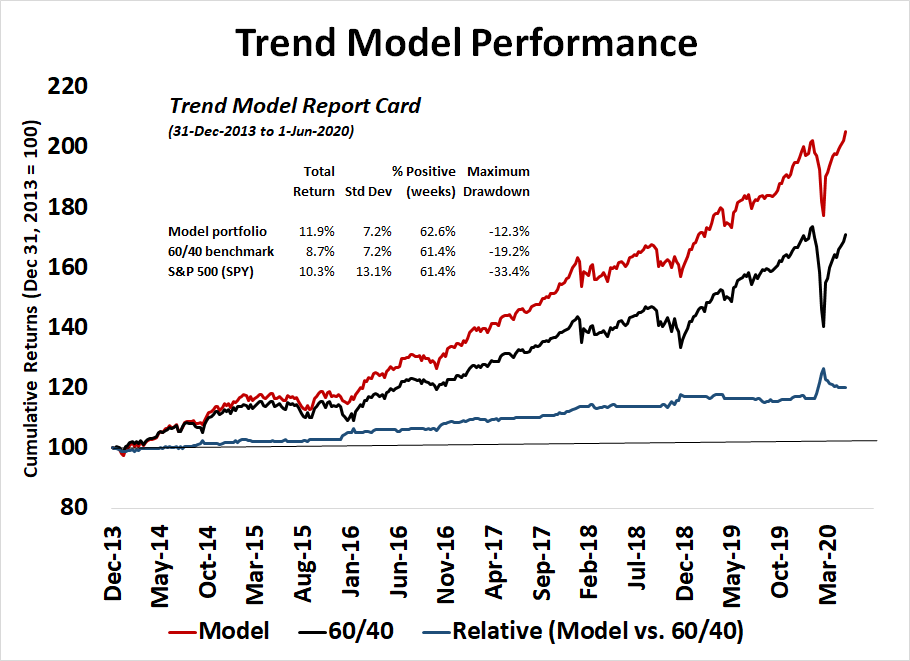
In addition to a buy-and-hold strategy, investors can consider allocating funds to tactical asset allocation as a way of enhancing returns. While I am not claiming that my Trend Asset Allocation Model represents the Holy Grail of investing, an asset allocation switching strategy that uses the out-of-sample signals of the Trend Model has achieved equity-like returns with 60/40 like risk. The usual caveats about how past performance is not indicative of future returns apply.
In conclusion, investors are facing a low return setting in the next decade. However, there are a number of pockets of opportunity for investors. Gold, value stocks, selected cheap foreign markets, and the use of tactical asset allocation are all ways of enhancing returns in a difficult investing environment.
I’ve seen that Household Equity 10 year prediction chart before and have studied it but I cannot find any predictive value in it. If Ned Davis can, more power to him.
As far as a 10 year hiatus in equity returns, I don’t think that will happen unless we see inflation well over 5%. If you study the 1970’s (the last lost decade in equities) you will see a correlation with oil inflation and resulting inflation through out the economy. In that case we will also see the Fed crank up rates which is the market killer.
Without inflation it is more likely that we will see the market rebound once an effective Covid vaccine is released. I should say, IF an effective Covid vaccine is released.
Oh, and about that “blue wave” in November, while anything is possible remember that Biden has pretty much been holed up in his basement except to give some friendly press interviews. Once he is out campaigning people will see that he has a real problem stringing more that one coherent sentence together without notes. The polls and probably the betting sites are going on a lack of information about the candidate and bias in the polling. But, we will see what happens. Personally, I just don’t think it will be pretty for Joe.
Not saying that Trump is out of it, but the betting odds, which reflect market expectations, are saying he is fighting an uphill battle.
Don’t forget we are starting from valuations that are highly stretched. The 2000-2010 period was a lost decade of sorts too.
True. But 10 years is a long time in the life of the stock market.
Cam, an absolutely fantastically written report!!
One of your best yet for helping investors see the forest through these many “burning trees” in our way currently. You give long term investors great insight here! As a money manager, this report gives me great insight and help in doing the best I can for my clients.
Thank you!
Cam, I took a look at a chart of CAPE going back through 2013 (inception?) and it looks like really stable growth until we get to 2018. In 2018 it took about a 20% dip in the last quarter market drop and this year it took a 30%+ dip in our Covid crash. It did recover about 90% of that drop, so it does recover well but that also tells me that it is susceptible to crashes in the general market. It does look like it has great potential for a buy-n-hold investor but be prepared for volatility.
Cam,
Very nice post.
Given your 6-to-9 month S&P500 price target of 1,600-1,800, would you still suggest investing in gold and value stocks? Do you expect them to achieve positive absolute returns during this period?
How do you expect gold miners to perform in this environment?
Shouldn’t the investors, those who can, just sell the equities and buy some inverse ETFs to gain from this crash in the stock market? 50% drop is significant. That doesn’t happen very often.
Starting May 16, cyclical sectors and small caps soared. They had been long term momentum underperformers for years. This type of surge happens at the beginning of new bull markets. It signaled that investors were expecting a V shaped recovery with a Fed steroid boost.
That surge has reversed. Here is a chart of an extreme example, the Oil and Gas Producers ETF XOG. A 50% gain has melted mostly away.
https://tmsnrt.rs/32bk3zH
This can be seen in most Value oriented areas. Their stock price gains in the high 20% range are back to single digits. Financials look particularly sick.
Even, the normally defensive areas are doing badly. Dividend and Utility ETFs are doing very poorly. Maybe the dividend restrictions placed on banks after the Fed Stress Test is reminding investors that dividends are not a sure thing in a Covid world.
A positive spin on this would be that this is just a pullback in a new bull market that one should ‘buy the dip.’ But if things don’t turn around soon, the picture might change to a bear market rally that has end June 8, with surprisingly messy markets ahead of us.
Flip a coin.
Cam- Did you catch Ciovacco’s June 19 video re valuations? Several recent historical examples of markets rallying for long periods of time from current valuations levels – whether trailing PEs or
the CAPE.
As he points out, investors who opted in 1991 to wait for better entries based on above-average PE/CAPE figures would have missed a fantastic multi-year rally – in fact, the number of monthly instances where the CAPE ratio fell below the median during that nine-year period? ZERO. That’s the kind of move the market loves to pull. It just seems dangerous to be sidelined based not only on valuations, but almost any other metric. In order to reap market returns, we need to be IN the market.
I love Ciovacco’s pattern of analysis where n=1 to 3. I never said that you should stay out of the market, only return expectations are low and there are other pockets of opportunity.
Haha -yes, he has a small sample size disclaimer that he posts from time to time. Sometimes that’s the best we can do. My take comes down to – if it’s happened a few times in the past, then it can happen again. Another of his thematic statements, with which I whole-heartedly agree – is that humans (whether individually or in crowds) tend to respond/act in similar ways when faced with similar situations.
A year ago I would have agreed that return expectations are low – period. Now, I tend to think that return expectations are low – but with renewed awareness that expectations can and more often than we think will be turned on its head by a market determined to frustrate the majority of traders.
Another example – and I hate to bring up Hussman again in the same way George Kennedy didn’t have the heart to hit Paul Newman again – would be John Hussman’s impeccable statistical research. He has apologetically tweaked his black box to account for scenarios he didn’t think were possible in 2008 – but that’s little comfort to investors who failed to capitalize on what would become an historic rally off the 2009 lows.
It’s not always the high-probability bet that wins in the market. There’s been a streak of ‘Vs’ that remind me of the time I witnessed a two-hour streak of seven-out calls at the craps table that cleaned everyone out.
It’s not low return expectations that make me move investments to cash – It’s fear of large equity losses that makes me go to cash.
But to quote Pete Lynch:
“Far more money has been lost by investors preparing for corrections, or trying to anticipate corrections, than has been lost in corrections themselves.” – Peter Lynch
Yes, I had forgotten that quote by Lynch – and I don’t think he was just talking his book.
But I understand your point. Sidestepping large drawdowns (as opposed to capturing large gains) is the key to outperformance.
I give Cam full credit for getting me/us out of the way prior to the market plunge last winter. IMO, that move far outweighs any gains we may have missed in the retracement rally.
I just remembered something I was going to mention today. Yesterday I ran across a story that explains a little about the huge increases in new Covid cases. It turns out that in one of Congress’ bills about Covid there is a provision to pay any hospital an amount equal to around $36,000 for every Covid case they report. As a result, hospitals have started testing everyone who comes into the hospital for any reason for Covid. Each positive test rewards them with this huge chunk of dough. I don’t remember where I read this so I don’t have a link.
Why are the hospitals getting paid $36K just for reporting the case? That’s a lot of money! One million positive cases mean $36b in payments.
Here’s one source-
https://www.healthaffairs.org/do/10.1377/hblog20200518.567886/full/
‘The Covered California analysis estimated that commercial insurance would pay $72,000 per COVID-19 hospitalization, and I use that estimate here. The Covered California estimate assumed that mean length of stay is 12 days, and that commercial insurers would pay $6,000 per day. Each of these assumptions appears reasonable. As of April 3, the CDC reported that median length of COVID-19 hospitalizations was 10-13 days. (The Covered California estimate of $72,000 per hospitalization estimate is much larger than the estimates used by Wakely/AHIP, Fair Health, and Bartsch, et. al., which are in the $15,000 to $40,000 range.)
‘On the assumption that Medicare and Medicaid each pay, on average, about 50 percent as much as commercial insurers for similar services, a reasonable estimate is that Medicare and Medicaid would each pay approximately $36,000 per COVID-19 hospitalization.’
https://www.youtube.com/watch?v=7xGxQXmu7Os
The first rock concert I attended was at the Santa Clara Fairgrounds in the spring of 1968 (I took the train down to San Jose on a Saturday with two other eighth graders). The Youngbloods were the first or second set. The band was so new that when the audience asked for an encore they huddled for a minute and then returned to the mike, ‘We didn’t expect an encore, and didn’t rehearse enough to play anything else. Would you like to hear ‘Get Together’ one more time?’
Terry Kath in a remarkable performance at Tanglewood:
https://www.youtube.com/watch?v=7uAUoz7jimg
Quite possible the greatest guitarist no one remembers.
Sanjay, I think they also have to admit them. Then they get the money for treating them. Of course, the incentive for the hospital is to them them to occupy a bed.
OK, back to the markets.
I think there’s an outside chance (or translated into the upside down odds of the market, a good chance) that the businesses predicted to go bankrupt will find ways not only to recapture their previous clients, but actually find new ones. For instance, will restaurants find ways to thrive and prosper in the post-Covid world? Why not? I’m already seeing new business models where the takeout business seems to eclipse the dine-in clientele, and it’s far more efficient. No wait staff or dishwashers needed – just a plexiglass front with portable credit card chip readers.
I not only couldn’t find the story I read about these hospital payments but there were some websites refuting the dollar amounts hospitals are getting from the government. So, please take my original comment with a grain of salt on this subject. I looks like RX has found more pertinent info on the matter.
rxchen2, I agree and will not bet against entrepreneurs. Smart people always find a way. On that note, it saddens me as I do not like take out. I enjoy the experience of dining out and praying that it will return in the future.
Echo Mike’s comment that this is one of Cam’s best yet.
Cam, would you share your thoughts on quality instead of value or dividend growth? QUAL seems to avoid the obvious boat anchors in SCHD. Thanks.
There’s nothing wrong with quality, but you need to buy quality at a price. Quality stocks should hold up well in a bear market, but there’s little upside if they’re expensive.
Quality needs to sort itself out in the new world of anti-globalization, post Covid frugality and no stock buybacks. Everyone’s business model will be tested.
Previous winners may not do as well.
My biggest surprise in the last month is the Dividend ETFs have done so poorly even as the Fed has committed to two years of zero interest rates. Seems investors are smelling dividend cuts on the horizon. The Fed mandating after the bank stress test that they tie dividends to earnings opens up a real possibility of big dividend cuts later this year. Also another big dividend group, Utilities are doing terribly too. Are customers not paying their bills?
All this to say, dividend investors should choose Quality over Dividend or Utility ETFs.